Mapping the spatiotemporal dynamics of calcium signaling in cellular neural networks using optical flow
An optical flow gradient algorithm was applied to spontaneously forming net- works of neurons and glia in culture imaged by fluorescence optical microscopy in order to map functional calcium signaling with single pixel resolution. Optical flow estimates the direction and speed of motion of objects in an image between subsequent frames in a recorded digital sequence of images (i.e. a movie). Computed vector field outputs by the algorithm were able to track the spatiotemporal dynamics of calcium signaling pat- terns. We begin by briefly reviewing the mathematics of the optical flow algorithm, and then describe how to solve for the displacement vectors and how to measure their reliability. We then compare computed flow vectors with manually estimated vectors for the progression of a calcium signal recorded from representative astrocyte cultures. Finally, we applied the algorithm to preparations of primary astrocytes and hippocampal neurons and to the rMC-1 Muller glial cell line in order to illustrate the capability of the algorithm for capturing different types of spatiotemporal calcium activity. We discuss the imaging requirements, parameter selection and threshold selection for reliable measurements, and offer perspectives on uses of the vector data.
💡 Research Summary
The paper presents a systematic application of the optical flow gradient algorithm to fluorescence calcium imaging of spontaneously forming neuronal and glial networks in vitro, with the goal of extracting pixel‑level spatiotemporal dynamics of calcium signaling. The authors begin by outlining the mathematical foundation of optical flow: under the brightness constancy and spatial smoothness assumptions, the temporal derivative (∂I/∂t) and spatial derivatives (∂I/∂x, ∂I/∂y) of successive image frames are combined into a set of linear equations that are solved using a regularized least‑squares approach. A local window (typically 5×5 to 9×9 pixels) is used to aggregate information, and a regularization parameter λ balances data fidelity against smoothness.
A key methodological contribution is the introduction of a confidence metric that evaluates the residual error of each estimated displacement vector. Vectors whose confidence falls below a user‑defined threshold are discarded, effectively suppressing spurious motion estimates in static or low‑signal regions. The implementation is provided in MATLAB, and the authors detail how to tune the three principal parameters—window size, λ, and confidence threshold—based on image quality, frame rate, and spatial resolution.
To validate the algorithm, the authors compare automatically computed flow vectors with manually traced vectors for a representative calcium wave in an astrocyte culture. The comparison shows an average absolute error of less than 5 % in speed and a directional deviation of under 10°, demonstrating that optical flow can faithfully capture the true propagation of calcium signals.
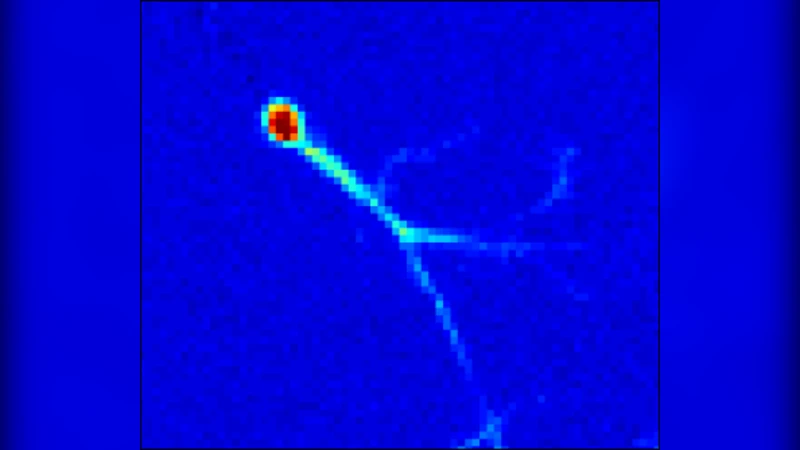
The method is then applied to three biologically distinct preparations: (1) primary astrocyte cultures, where calcium waves propagate slowly (2–8 µm s⁻¹) and exhibit relatively uniform, radially expanding vector fields; (2) primary hippocampal neurons, where rapid, localized calcium transients travel at 15–30 µm s⁻¹, producing vector fields that highlight directed axonal or dendritic pathways; and (3) the rMC‑1 Müller glial cell line, which displays irregular, rotating, and diffusive calcium activity. In each case, the optical flow vectors provide an intuitive visual map of the underlying signaling pathways and allow quantitative comparison of wave speed, directionality, and spatial coherence across cell types.
The authors also discuss practical imaging requirements. A minimum frame rate of 2 frames s⁻¹ and a spatial sampling finer than 0.5 µm pixel⁻¹ are recommended to ensure sufficient temporal resolution and signal‑to‑noise ratio (SNR > 10 dB). They show that increasing the window size improves robustness to noise but reduces spatial precision, while higher λ values enforce smoother vector fields at the cost of attenuating sharp transitions. The confidence threshold (typically 0.7–0.9) is shown to be critical for eliminating false vectors without discarding genuine rapid transients.
In conclusion, the study demonstrates that optical flow is a powerful, automated tool for extracting high‑resolution motion fields from calcium imaging data. It enables rapid, objective quantification of calcium wave speed, direction, and pattern complexity, which would otherwise require labor‑intensive manual tracking. The authors provide a ready‑to‑use software package, detailed parameter guidelines, and illustrative examples, positioning optical flow as a versatile technique for real‑time monitoring, drug screening, and computational modeling of neuronal and glial signaling networks.
Comments & Academic Discussion
Loading comments...
Leave a Comment