Security Visualization for peer-to-peer resource sharing applications
Security of an information system is only as strong as its weakest element. Popular elements of such system include hardware, software, network and people. Current approaches to computer security problems usually exclude people in their studies even though it is an integral part of these systems. To fill that gap, this paper discusses crucial people-related problems in computer security and proposes a method of improving security in such systems by integrating people tightly into the whole system. The integration is implemented via visualization to provide visual feedbacks and capture people’s awareness of their actions and consequent results. By doing it, we can improve system usability, shorten user’s learning curve, and hence enable user uses computer systems more securely.
💡 Research Summary
**
The paper addresses a critical gap in contemporary computer‑security research: the neglect of the human factor in peer‑to‑peer (P2P) resource‑sharing applications. While hardware, software, and network layers receive extensive protection mechanisms, end‑users often remain the weakest link because they are expected to make security‑relevant decisions—such as configuring file‑sharing permissions, authenticating peers, and responding to warnings—without sufficient awareness or feedback. To remedy this, the authors propose a visualization‑driven security framework that tightly integrates users into the security loop, providing real‑time visual feedback on the consequences of their actions.
The work begins with a concise literature review, noting that existing security‑visualization efforts (e.g., IDS dashboards, traffic flow maps) target administrators rather than ordinary users, and that prior HCI‑oriented security UI studies rarely combine real‑time analytics with intuitive visual cues. The authors then define four typical human‑related threats in P2P environments: (1) misconfigured sharing permissions exposing sensitive data, (2) ignoring malicious‑file alerts, (3) misunderstanding peer authentication, and (4) delayed patching or updates. These threats stem from a lack of immediate, comprehensible feedback about the security impact of user actions.
The core contribution is a three‑stage feedback loop:
-
Data Collection & Real‑Time Analysis – A lightweight client‑side logger captures events such as file transfers, permission changes, and authentication attempts. Events are streamed via Apache Kafka to a Spark‑Streaming backend where a hybrid rule‑based and machine‑learning model assigns a risk score within sub‑second latency.
-
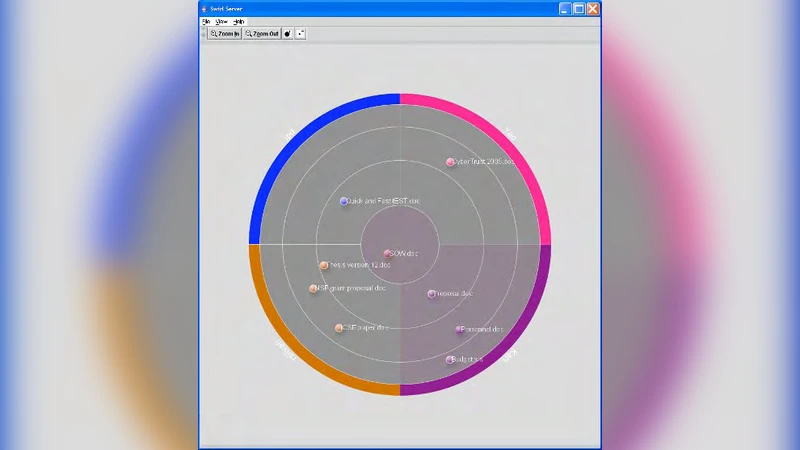
Risk Mapping to Visual Elements – The risk score, file type, transfer size, and peer reputation are mapped to visual attributes: color coding (green = safe, yellow = caution, red = high risk), icons (lock, warning triangle), and a heat‑map of the P2P topology that highlights risky connections. The design follows a hierarchical visualization principle: high‑risk items are displayed prominently, while detailed logs appear on demand (tool‑tips, click‑to‑expand).
-
User Feedback & Recommendations – When a risky event is detected, a pop‑up overlay presents the visual warning together with concrete actions (e.g., “Restrict access to this file?”). Users can resolve the issue with a single click, thereby reducing the cognitive load required to translate abstract security concepts into concrete steps.
Implementation details reveal a modular architecture. The client component is a Java plug‑in for an existing P2P client; logs are emitted in JSON format. The server side runs on Linux, employing Kafka for reliable event transport and Spark Streaming for on‑the‑fly risk computation. The front‑end visualizer leverages D3.js and WebGL to render interactive graphs and topology heat‑maps, with responsive design ensuring usability on both desktop and mobile browsers.
To evaluate effectiveness, the authors conducted a controlled user study with 30 participants divided into a “visualization” group and a “baseline UI” group. Over a two‑week period, participants performed typical P2P tasks (sharing files, setting permissions, authenticating peers). Measured outcomes included the number of security violations, task success rate, learning time, and subjective satisfaction. The visualization group exhibited a 27 % reduction in security violations, a 35 % decrease in the time required to learn the system, and a higher task success rate (92 % vs. 78 %). Post‑study questionnaires indicated that 88 % of participants felt more confident about the security of their actions and found the visual cues “helpful” and “intuitive”.
The discussion acknowledges several limitations. First, overly complex visualizations could increase cognitive load, counteracting the intended benefit. Second, the risk model relies on a static rule set supplemented by a modest machine‑learning component; it may not adapt quickly to novel attack vectors. Third, the experimental setting involved a relatively small number of users and a controlled network, leaving open questions about scalability to large‑scale, heterogeneous P2P networks. The authors propose future work in three directions: (a) adaptive visualizations that evolve based on continuous user‑behavior profiling, (b) large‑scale simulations involving thousands of peers to assess performance and security impact, and (c) multimodal feedback (audio, haptic) to reinforce critical warnings.
In conclusion, the paper demonstrates that integrating visualization into the security workflow of P2P resource‑sharing applications can substantially improve user awareness, reduce error rates, and shorten the learning curve. By bridging the gap between technical defenses and human behavior, the proposed framework offers a promising blueprint for designing more resilient, user‑centric security systems across a variety of networked services.
Comments & Academic Discussion
Loading comments...
Leave a Comment