The Mutual Information of University-Industry-Government Relations: An Indicator of the Triple Helix Dynamics
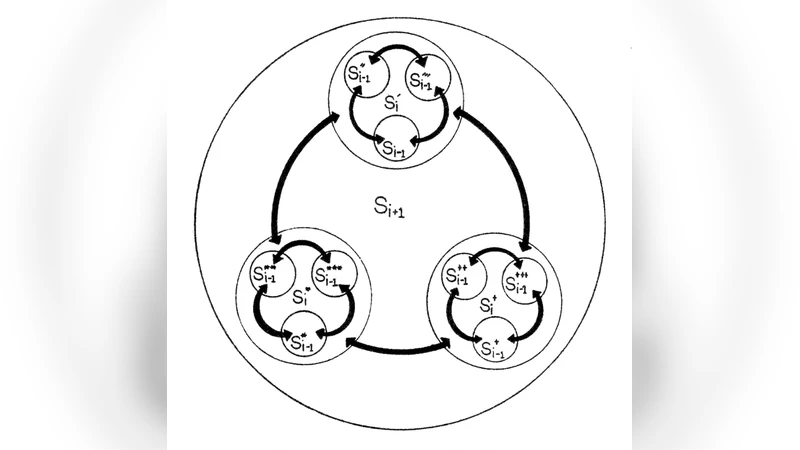
University-industry-government relations provide a networked infrastructure for knowledge-based innovation systems. This infrastructure organizes the dynamic fluxes locally and the knowledge base remains emergent given these conditions. Whereas the relations between the institutions can be measured as variables, the interacting fluxes generate a probabilistic entropy. The mutual information among the three institutional dimensions provides us with an indicator of this entropy. When this indicator is negative, self-organization can be expected. The self-organizing dynamic may temporarily be stabilized in the overlay of communications among the carrying agencies. The various dynamics of Triple Helix relations at the global and national levels, in different databases, and in different regions of the world, are distinguished by applying this indicator to scientometric and webometric data.
💡 Research Summary
The paper proposes a novel quantitative indicator for assessing the dynamics of the Triple Helix (university‑industry‑government) system by applying concepts from information theory. Traditional studies of Triple Helix relations have largely relied on qualitative descriptions or simple counts of co‑authored papers, co‑patents, and joint projects. While useful, these measures do not capture the underlying informational structure of the three institutional spheres and their mutual dependencies. To address this gap, the authors adopt Shannon entropy and the notion of mutual information among three random variables, representing the activities of universities (U), industry (I), and government (G).
Formally, each sphere is treated as a probability distribution over observed events (e.g., publications, patents, web links). The individual entropies H(U), H(I), H(G) quantify the uncertainty within each sector, while the joint entropy H(U,I,G) captures the uncertainty when the three are considered together. The three‑way mutual information is defined as
I(U;I;G) = H(U) + H(I) + H(G) – H(U,I,G).
If the three sectors are statistically independent, I = 0. Positive values indicate overlapping information (redundancy), whereas negative values signal that the combined system is more ordered than the sum of its parts – a hallmark of synergy or self‑organization. The authors argue that a sustained negative I is a robust signature of a self‑organizing Triple Helix.
To test the indicator, three complementary data sources are assembled: (1) bibliometric records from Scopus and Web of Science, where author affiliations are classified into university, industry, or government; (2) patent data from USPTO and EPO, with assignee types similarly coded; and (3) web‑metric data obtained by crawling hyperlinks among .edu, .gov, and .com domains. For each dataset, the authors construct yearly contingency tables that count co‑occurrences of the three institutional types (e.g., a paper co‑authored by a university researcher and an industry scientist, a patent jointly filed by a university and a government lab, a hyperlink from a university website to a corporate site). These tables are normalized to probability distributions, allowing the calculation of H and I for each year, each country, and, where data permit, each metropolitan region.
The empirical results reveal striking heterogeneity across spatial scales. At the global level, the majority of countries exhibit I > 0, suggesting that university, industry, and government activities remain largely independent. However, a subset of nations—including Sweden, the Netherlands, and South Korea—show prolonged periods of I < 0. South Korea, in particular, records a minimum I of approximately –0.12 bits during 2005‑2015, indicating a strong, system‑wide synergy. Regional analyses further refine this picture: metropolitan clusters such as Stockholm, Amsterdam, and Seoul display more negative I values than their national averages, implying that local innovation ecosystems can achieve higher degrees of self‑organization than the broader national system. Web‑metric findings corroborate the bibliometric and patent results: countries where government portals frequently link to university and corporate sites tend to have more negative I, reinforcing the interpretation that cross‑sector digital communication is a proxy for underlying collaborative dynamics.
The authors discuss several policy implications. First, the sign and magnitude of I provide a concise, comparable metric for evaluating the effectiveness of national or regional innovation policies (e.g., R&D tax credits, joint research funding schemes, technology transfer offices). Second, because I can be computed annually, it enables real‑time monitoring of policy interventions, allowing governments to adjust strategies before long‑term outcomes become evident. Third, the methodology is extensible: additional institutional categories (start‑ups, NGOs, international research consortia) can be incorporated to construct higher‑dimensional mutual information measures, offering even richer portraits of complex innovation networks.
In conclusion, the paper demonstrates that three‑way mutual information is a powerful, theoretically grounded indicator of Triple Helix dynamics. Negative mutual information captures the emergence of synergistic, self‑organizing structures that traditional metrics overlook. By applying the indicator to bibliometric, patent, and web data, the authors provide a multi‑modal validation and illustrate its utility for comparative studies across countries, regions, and time. Future work is suggested to integrate finer‑grained institutional classifications, explore causal links between policy changes and I fluctuations, and develop interactive dashboards for policymakers to track innovation system health in near real‑time.
Comments & Academic Discussion
Loading comments...
Leave a Comment