Gain/loss asymmetry in time series of individual stock prices and its relationship to the leverage effect
📝 Original Info
- Title: Gain/loss asymmetry in time series of individual stock prices and its relationship to the leverage effect
- ArXiv ID: 0911.4679
- Date: 2009-11-25
- Authors: Researchers from original ArXiv paper
📝 Abstract
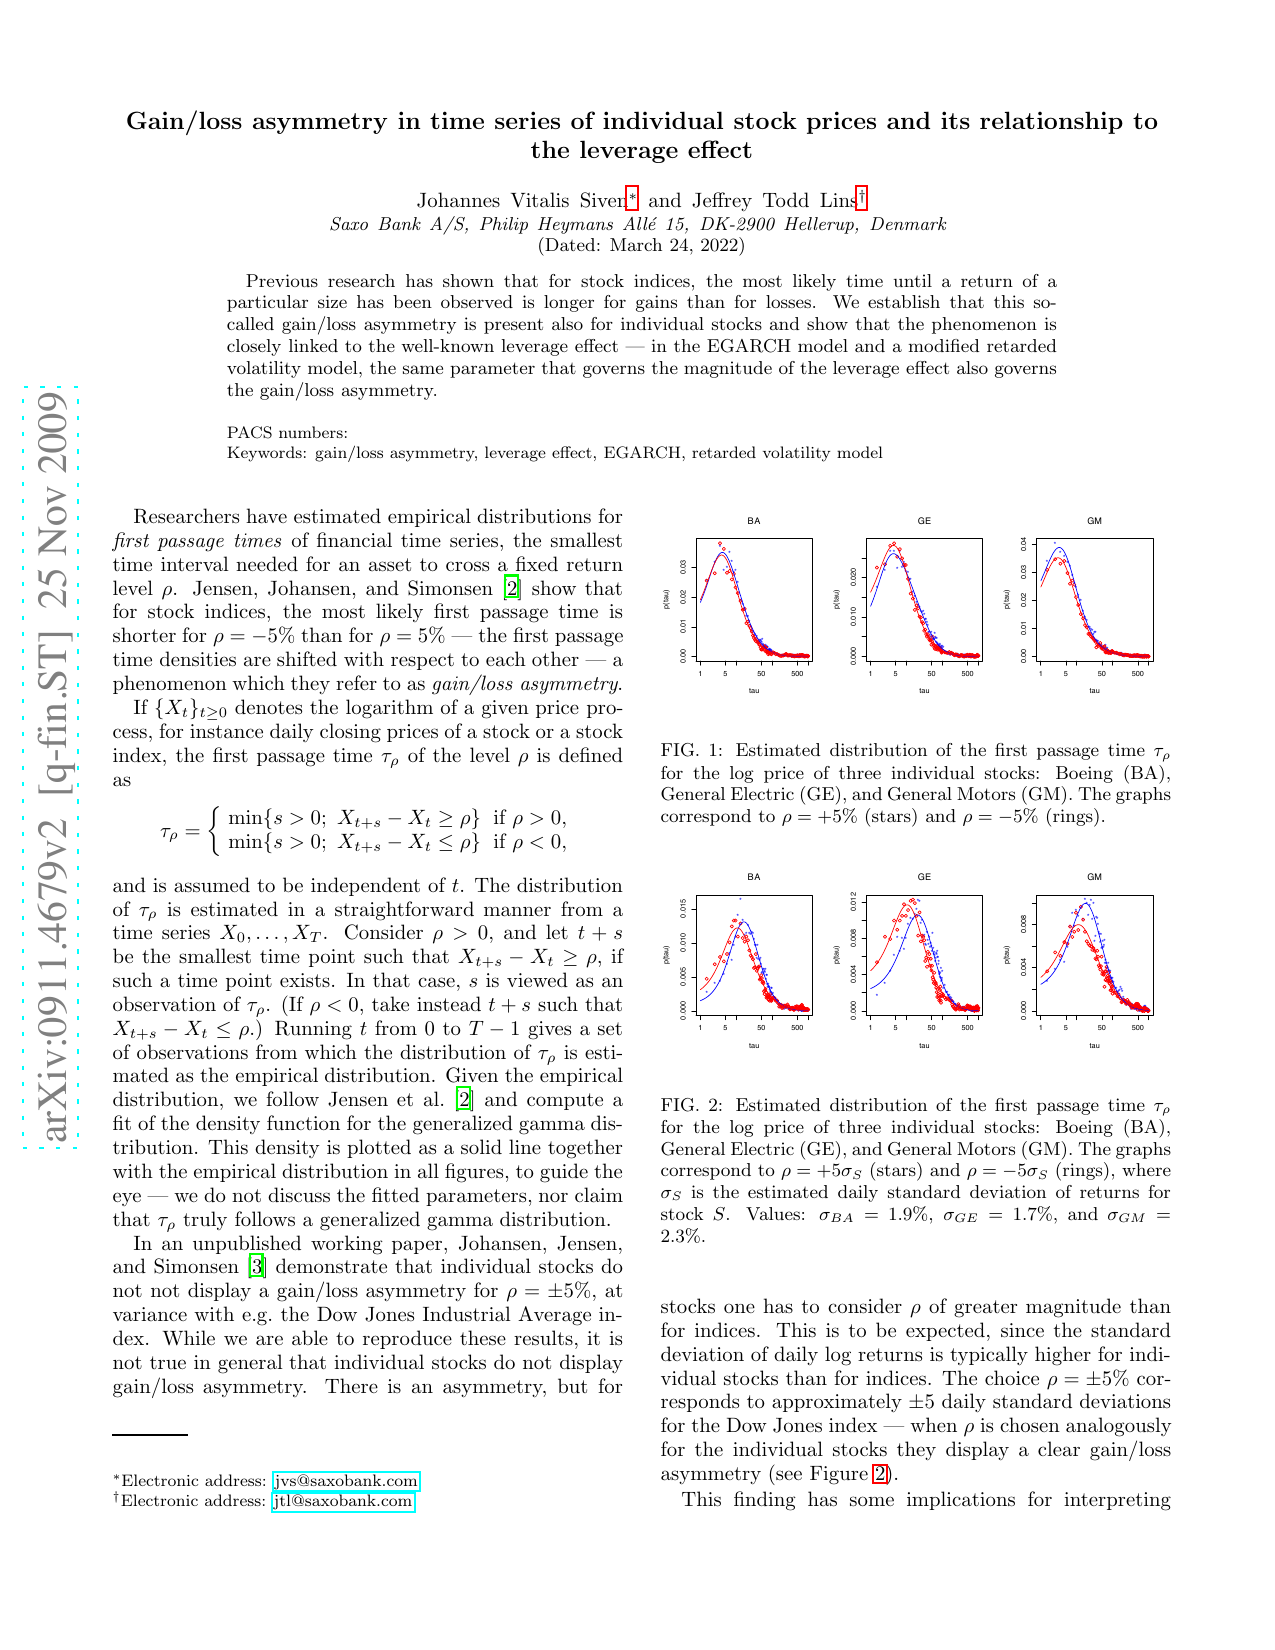
Previous research has shown that for stock indices, the most likely time until a return of a particular size has been observed is longer for gains than for losses. We establish that this so-called gain/loss asymmetry is present also for individual stocks and show that the phenomenon is closely linked to the well-known leverage effect -- in the EGARCH model and a modified retarded volatility model, the same parameter that governs the magnitude of the leverage effect also governs the gain/loss asymmetry.💡 Deep Analysis
Deep Dive into Gain/loss asymmetry in time series of individual stock prices and its relationship to the leverage effect.Previous research has shown that for stock indices, the most likely time until a return of a particular size has been observed is longer for gains than for losses. We establish that this so-called gain/loss asymmetry is present also for individual stocks and show that the phenomenon is closely linked to the well-known leverage effect – in the EGARCH model and a modified retarded volatility model, the same parameter that governs the magnitude of the leverage effect also governs the gain/loss asymmetry.
📄 Full Content
📸 Image Gallery


Reference
This content is AI-processed based on ArXiv data.