PCA Tomography: how to extract information from datacubes
Astronomy has evolved almost exclusively by the use of spectroscopic and imaging techniques, operated separately. With the development of modern technologies it is possible to obtain datacubes in which one combines both techniques simultaneously, producing images with spectral resolution. To extract information from them can be quite complex, and hence the development of new methods of data analysis is desirable. We present a method of analysis of datacube (data from single field observations, containing two spatial and one spectral dimension) that uses PCA (Principal Component Analysis) to express the data in the form of reduced dimensionality, facilitating efficient information extraction from very large data sets. PCA transforms the system of correlated coordinates into a system of uncorrelated coordinates ordered by principal components of decreasing variance. The new coordinates are referred to as eigenvectors, and the projections of the data onto these coordinates produce images we will call tomograms. The association of the tomograms (images) to eigenvectors (spectra) is important for the interpretation of both. The eigenvectors are mutually orthogonal and this information is fundamental for their handling and interpretation. When the datacube shows objects that present uncorrelated physical phenomena, the eigenvector’s orthogonality may be instrumental in separating and identifying them. By handling eigenvectors and tomograms one can enhance features, extract noise, compress data, extract spectra, etc. We applied the method, for illustration purpose only, to the central region of the LINER galaxy NGC 4736, and demonstrate that it has a type 1 active nucleus, not known before. Furthermore we show that it is displaced from the centre of its stellar bulge.
💡 Research Summary
The paper introduces a novel methodology for analysing three‑dimensional astronomical data cubes—datasets that combine two spatial dimensions with one spectral dimension—by employing Principal Component Analysis (PCA). Traditional astronomical research has largely treated imaging and spectroscopy as separate techniques, but modern integral‑field spectrographs now deliver data cubes that contain both spatial and spectral information simultaneously. Extracting physical insight from such massive, highly correlated datasets is non‑trivial, prompting the authors to develop a PCA‑based framework that reduces dimensionality while preserving the most significant variance.
The authors first reshape the data cube into a two‑dimensional matrix where each row corresponds to a spatial pixel and each column to a spectral channel. After subtracting the mean spectrum, they compute the covariance matrix and solve for its eigenvalues and eigenvectors. Each eigenvector (principal component) represents an orthogonal spectral basis vector, ordered by decreasing eigenvalue (i.e., variance explained). By projecting the original data onto each eigenvector, a set of scalar coefficients is obtained for every spatial pixel; mapping these coefficients back onto the sky yields “tomograms,” which are essentially images that encode the spatial distribution of the corresponding spectral component.
Because the eigenvectors are mutually orthogonal, they tend to isolate physically independent phenomena. For example, the first principal component usually captures the bulk stellar continuum, the second may highlight emission‑line regions, and higher‑order components often contain noise or subtle instrumental effects. The orthogonality thus enables a clean separation of stellar light, ionised gas, dust extinction, and background noise, something that is difficult to achieve with conventional line‑fitting or image‑subtraction techniques.
The paper outlines a practical workflow: (1) pre‑process the cube (bad‑pixel correction, sky subtraction, mean removal); (2) compute the covariance matrix and perform eigen‑decomposition; (3) select a subset of components based on eigenvalue magnitude to achieve dimensionality reduction; (4) generate tomograms for each selected component; (5) interpret each tomogram together with its eigenvector spectrum to assign physical meaning. The authors also discuss ancillary benefits such as data compression (retaining only the most significant components dramatically reduces storage requirements) and noise filtering (discarding low‑variance components improves signal‑to‑noise ratios).
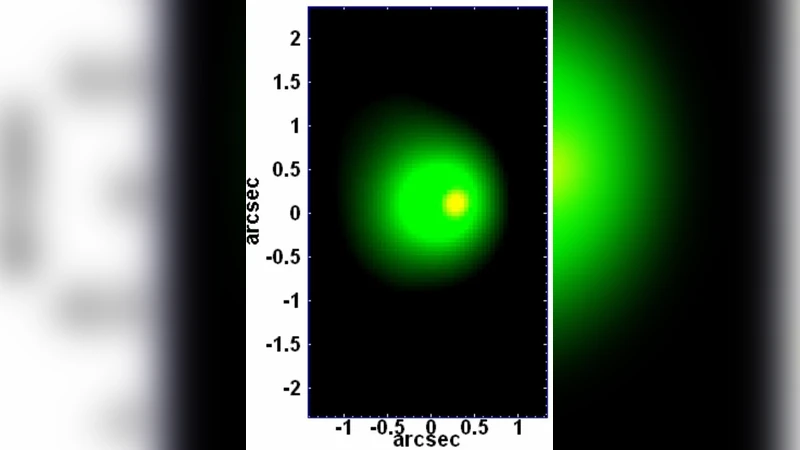
To demonstrate the method, the authors apply it to integral‑field observations of the LINER galaxy NGC 4736. The first eigenvector reproduces a typical old‑stellar population spectrum, and its tomogram shows a smooth distribution centred on the galaxy bulge. The second eigenvector, however, exhibits strong Hα,
Comments & Academic Discussion
Loading comments...
Leave a Comment