The redshifted network contrast of transition region emission
Aims: We study the VUV emission of the quiet Sun and the net redshift of transition region lines in the SUMER spectral range. We aim at establishing a link with atmospheric processes and interpreting the observed downflow as the most evident part of the prevailing global coronal mass transport. Methods: We rank and arrange all pixels of a monochromatic raster scan by radiance and define equally-sized bins of bright, faint, and medium-bright pixels. Comparing the bright pixels with the faint pixels, we determine the spectrally-resolved network contrast for 19 emission lines. We then compare the contrast centroids of these lines with the position of the line itself. We establish a relationship between the observed redshift of the network contrast with the line formation temperature. Results: We find that the network contrast is offset in wavelength compared to the emission line itself. This offset, if interpreted as redshift, peaks at middle transition region temperatures and is 10 times higher than the previously reported net redshift of transition region emission lines. We demonstrate that the brighter pixels are more redshifted, causing both a significant shift of the network contrast profile and the well-known net redshift. We show that this effect can be reconstructed from the radiance distribution. This result is compatible with loop models, which assume downflows near both footpoints.
💡 Research Summary
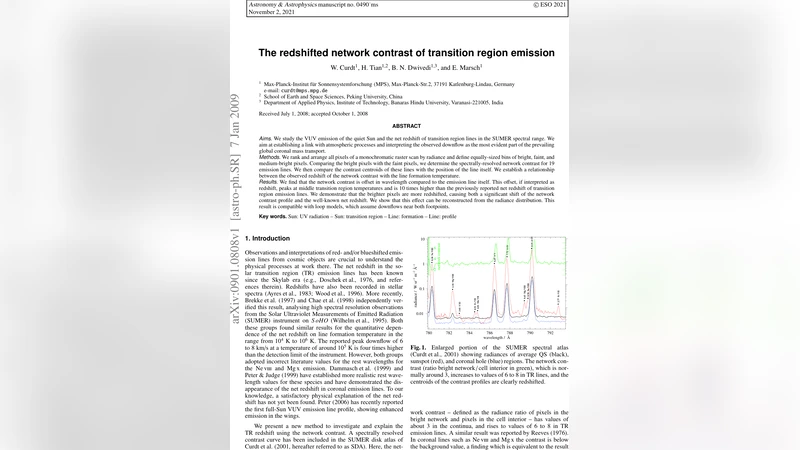
The authors investigate the quiet‑Sun vacuum‑ultraviolet (VUV) emission recorded by the SUMER spectrograph, focusing on the well‑known net redshift of transition‑region (TR) lines. Their methodology departs from traditional line‑center measurements: they first rank every pixel of a monochromatic raster by its radiance, then divide the full set into three equally populated bins – bright (network), medium, and faint (cell interior). For each of 19 TR emission lines they compute the “network contrast”, i.e., the ratio of the average spectrum of the bright bin to that of the faint bin, as a function of wavelength. By locating the centroid of each contrast profile they obtain a wavelength shift relative to the line’s laboratory position.
The key observational result is that the contrast centroid is systematically displaced toward longer wavelengths. This displacement behaves like a redshift that peaks at temperatures around log T≈5.3 K (mid‑TR) and reaches amplitudes roughly ten times larger than the canonical net redshift (≈5–10 km s⁻¹) reported in earlier studies. In other words, the brighter network pixels are more redshifted than the darker internetwork pixels, and this differential motion is sufficient to explain both the large contrast shift and the modest overall line‑center redshift.
To interpret the effect, the authors analyze the radiance distribution, which follows a log‑normal law, and establish a linear relationship between radiance (in log space) and Doppler shift. By applying this radiance‑shift relation to the observed log‑normal radiance histogram they synthesize a composite line profile that reproduces the measured contrast shift. The synthetic profile demonstrates that the observed phenomenon arises naturally from the statistical coupling of intensity and flow: the high‑intensity tail of the distribution contributes disproportionately to the line shape and carries a larger redshift.
These findings dovetail with loop‑based models of the TR, wherein plasma drains down both footpoints of low‑lying magnetic loops while a modest upflow may exist near the loop apex. The enhanced redshift of the bright network thus reflects downflows at loop footpoints, consistent with the idea that the net TR redshift is the integrated signature of many such localized downflows. Moreover, the temperature dependence of the contrast shift suggests that the efficiency of mass transport varies across the TR, peaking where the plasma is most susceptible to radiative cooling and pressure gradients.
In summary, the paper provides a novel diagnostic – the spectrally resolved network contrast – that amplifies the subtle Doppler signatures hidden in average line profiles. By linking radiance statistics to flow velocities, the authors show that the long‑standing net redshift of TR lines is a manifestation of a much larger, intensity‑dependent redshift present in the brightest network structures. This work not only refines our quantitative picture of TR dynamics but also offers a new observational constraint for 3‑D magnetohydrodynamic simulations of coronal mass supply and solar wind formation.
Comments & Academic Discussion
Loading comments...
Leave a Comment