A Dynamic Vulnerability Map to Assess the Risk of Road Network Traffic Utilization
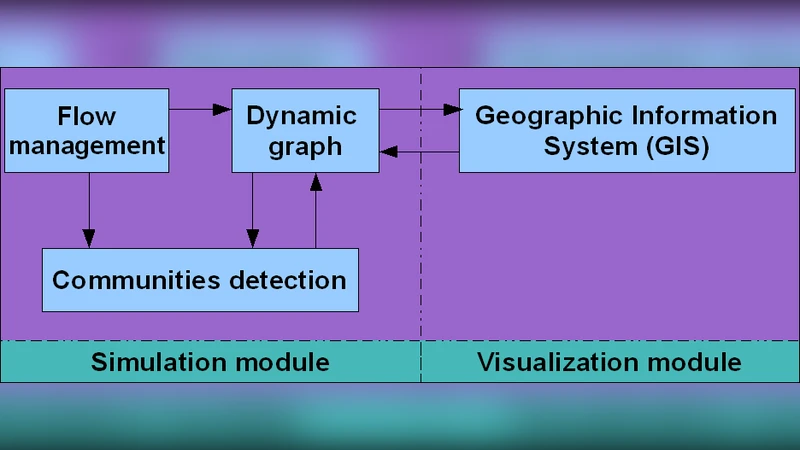
Le Havre agglomeration (CODAH) includes 16 establishments classified Seveso with high threshold. In the literature, we construct vulnerability maps to help decision makers assess the risk. Such approaches remain static and do take into account the population displacement in the estimation of the vulnerability. We propose a decision making tool based on a dynamic vulnerability map to evaluate the difficulty of evacuation in the different sectors of CODAH. We use a Geographic Information system (GIS) to visualize the map which evolves with the road traffic state through a detection of communities in large graphs algorithm.
💡 Research Summary
The paper addresses the problem of assessing evacuation difficulty in the Le Havre agglomeration (CODAH), which contains sixteen high‑threshold Seveso‑classified industrial establishments. Traditional vulnerability maps used by decision makers are static; they combine hazard levels with population distribution but ignore the dynamic nature of road traffic and population displacement during an emergency. To overcome this limitation, the authors propose a decision‑support tool that generates a dynamic vulnerability map whose values evolve with the real‑time state of the road network.
The methodology begins with a graph representation of the CODAH road network. Intersections become nodes, road segments become edges, and each edge is weighted by traffic‑related attributes such as speed, vehicle count, and congestion level. These attributes are obtained from a combination of fixed traffic sensors, mobile GPS traces, and traffic‑management‑center APIs. Data preprocessing includes temporal interpolation for missing values and outlier removal using inter‑quartile‑range techniques.
For each time slice (the authors use a five‑minute interval), the weighted graph is fed into a community‑detection algorithm derived from the Louvain method. The algorithm is adapted to incorporate temporal weights, allowing the detection of “communities” – clusters of roads that share similar traffic conditions at a given moment. Within each community, the authors compute an Evacuation Difficulty Index (EDI). The EDI combines the average travel time, the ratio of actual flow to theoretical capacity, and the local population density, and is normalized to a 0‑1 scale. Higher EDI values indicate that evacuating residents from that area would be more problematic.
A Geographic Information System (GIS) visualisation layer displays the communities on a map using a colour gradient (green to red) that reflects the current EDI values. Users can select a specific disaster scenario (e.g., a chemical release) and a time horizon, and the system will automatically recompute optimal evacuation routes, highlight bottlenecks, and suggest where additional traffic control measures or temporary shelters should be placed.
The authors validate the approach with two case studies. The first examines the baseline (non‑emergency) traffic situation, showing relatively low EDI values in the city centre and along major arterials. The second simulates a hypothetical chemical spill, causing a sharp increase in EDI around key junctions and highway entry points, thereby illustrating how congestion can dramatically impede evacuation.
Key contributions include: (1) integration of real‑time traffic data with GIS to produce a spatio‑temporal vulnerability assessment; (2) use of dynamic community detection to capture evolving traffic clusters, which is more sensitive to congestion than static shortest‑path analyses; (3) introduction of a quantitative EDI metric that can be directly used by planners for resource allocation.
The paper also acknowledges limitations. Real‑time data collection infrastructure may be lacking in some regions, constraining the model’s applicability. The community‑detection algorithm’s parameters (e.g., modularity resolution, time‑slice length) influence results and require careful calibration. Moreover, non‑regular population movements—such as large events or sudden weather changes—may not be fully captured by the current weighting scheme. The authors suggest future work that incorporates machine‑learning‑based traffic forecasts, multi‑hazard scenarios (fire, flood, chemical release), and a more robust optimisation framework for evacuation planning.
In summary, the study demonstrates that augmenting static vulnerability maps with dynamic traffic information yields a powerful tool for assessing evacuation difficulty in real time, thereby enabling more informed and adaptive emergency‑management decisions.
Comments & Academic Discussion
Loading comments...
Leave a Comment