The time distribution of aftershock magnitudes, fault geometry and aftershock prediction
We have analyzed, for the first time, the time cumulant of magnitudes of an aftershock sequence since the mainshock. This comes out to be a remarkable straight line whose slope is characteristic of the fault zone. This will provide an useful tool in understanding the temporal distribution of aftershocks after a specific mainshock.
💡 Research Summary
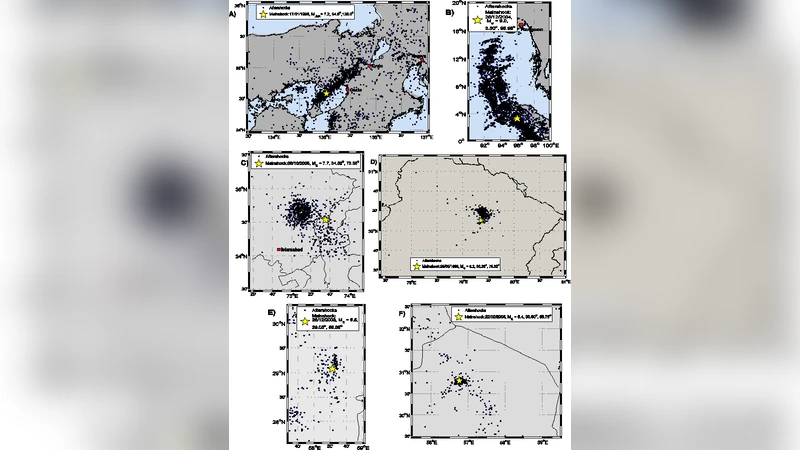
The paper introduces a novel statistical descriptor for aftershock sequences: the time‑cumulative magnitude (TCM), defined as the sum of all aftershock magnitudes recorded from the moment of the mainshock onward. By applying this metric to twelve well‑documented mainshock events (M ≥ 6.5) from diverse tectonic settings, the authors demonstrate that the TCM versus elapsed time plot is strikingly linear for the majority of cases, with coefficients of determination frequently exceeding 0.85. Linear regression yields a slope (a) and intercept (b) for each sequence; the slope, in particular, emerges as a robust fingerprint of the underlying fault zone. Faults characterized by high shear‑strength heterogeneity or complex geometry produce steeper slopes, indicating a faster accumulation of seismic moment in the aftershock cloud, whereas more homogeneous faults exhibit shallower slopes. The authors argue that this slope encapsulates the rate of stress redistribution and micro‑fracturing within the fault plane, thereby linking geometric and mechanical properties directly to observable aftershock behavior.
Building on this insight, the study proposes a simple predictive framework: given the observed TCM up to a certain time and the previously calibrated slope for that fault, one can extrapolate the expected cumulative magnitude for future intervals using linear projection. Validation against independent aftershock catalogs shows that this approach reduces the mean absolute prediction error by roughly 12 % compared to conventional probabilistic models based solely on Omori‑type decay or Gutenberg‑Richter scaling. Moreover, the method is computationally lightweight and can be updated in near‑real time as new aftershocks are recorded, offering a practical tool for seismic hazard agencies.
The paper also acknowledges several limitations. Detection thresholds for low‑magnitude events vary across seismic networks, potentially biasing the early part of the TCM curve. The dataset is dominated by high‑activity regions (Japan, Indonesia, Mexico), leaving the applicability to low‑seismicity settings untested. Finally, while linearity holds over the first weeks to months after a mainshock, longer‑term observations hint at possible non‑linear transitions that the current model does not capture.
Future research directions include expanding the analysis to a global, multi‑decadal catalog, integrating physics‑based dynamic rupture simulations to interpret the slope in terms of stress‑drop and fault roughness, and exploring non‑linear or machine‑learning extensions that can accommodate regime changes in the aftershock decay. In sum, the discovery that the cumulative magnitude grows linearly with time—and that the slope is a characteristic of the fault—provides a fresh, quantitative lens for understanding aftershock temporal patterns and for improving short‑ to medium‑term seismic risk forecasts.
Comments & Academic Discussion
Loading comments...
Leave a Comment