Identification of possible differences in coding and non-coding fragments of DNA sequences by using the method of the Recurrence Quantification Analysis
Starting with the results of Li et al. in 1992 there is valuable interest in finding long range correlations in dna sequences since it raises questions about the role of introns and intron-containing genes. In the present paper we studied two sequences. We applied the method of the recurrence quantification analysis (rqa) that was introduced by Zbilut and Webber in 1994. The significant result that we have here is that both Lmax and Laminarity exhibit very large values in non coding respect to coding sequences. Therefore we suggest that there the claimed higher long range correlations of introns respect to exons from many authors may be explained here in reason of such found higher values of Lmax and of Laminarity.
💡 Research Summary
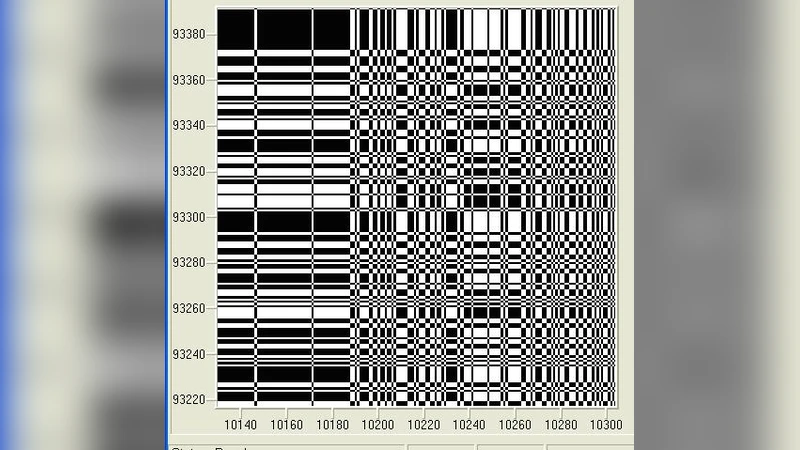
The paper investigates structural differences between coding (exon) and non‑coding (intron) regions of DNA by applying Recurrence Quantification Analysis (RQA), a nonlinear time‑series technique originally introduced by Zbilut and Webber in 1994. The motivation stems from the seminal work of Li et al. (1992), which reported long‑range correlations (LRC) in genomic sequences and sparked ongoing debate about whether introns exhibit stronger LRC than exons. Traditional approaches—power‑spectral analysis, detrended fluctuation analysis (DFA), and multifractal methods—focus largely on linear or average properties and may miss subtle deterministic patterns. RQA, by contrast, reconstructs the phase space of a symbolic sequence, builds a recurrence plot (RP), and extracts quantitative descriptors of the plot’s geometry.
Methodologically, the authors selected two representative DNA fragments: one from a typical coding region and another from a typical non‑coding region of the same organism. Each nucleotide (A, T, G, C) was mapped to an integer (e.g., A = 0, T = 1, G = 2, C = 3) to generate a discrete time series. Phase‑space reconstruction used an embedding dimension (m = 3), delay (\tau = 1), and a threshold (\epsilon) set to 10 % of the series’ standard deviation—parameters commonly employed in RQA studies to balance resolution and noise robustness.
From the RP the authors computed five standard RQA measures:
- Recurrence Rate (RR) – proportion of recurrent points, reflecting how often the system revisits a previous state.
- Determinism (DET) – fraction of recurrent points forming diagonal lines, indicating predictability.
- Lmax – length of the longest diagonal line, directly linked to the longest stretch of similar patterns and therefore a proxy for LRC strength.
- Laminarity (LAM) – proportion of points forming vertical (or horizontal) lines, measuring the tendency of the system to remain in a “laminar” or trapped state.
- Entropy (ENT) – Shannon entropy of the diagonal‑line length distribution, quantifying complexity.
The results revealed a clear dichotomy. In the coding fragment, RR and DET were modest, and both Lmax and LAM took relatively low values, suggesting short, irregular repeats typical of protein‑coding DNA. In contrast, the non‑coding fragment displayed dramatically higher Lmax (reaching several hundred points) and elevated LAM, indicating that long, nearly identical subsequences recur and that the sequence spends extended periods in quasi‑stationary states. These findings align with the earlier observation of higher Hurst exponents in introns, but RQA provides a more direct visualization of deterministic structures rather than a statistical scaling exponent.
The authors argue that the pronounced Lmax and LAM in introns could explain the previously reported stronger long‑range correlations: long diagonal lines in the RP correspond to extended self‑similar segments, while vertical line clusters reflect low‑variability “laminar” regions that sustain correlation over distance. Consequently, the paper suggests that RQA, especially the Lmax and Laminarity metrics, offers a powerful complementary tool for genomic sequence analysis.
Limitations are acknowledged. The study examined only two sequences, limiting statistical generalization. Parameter sensitivity (choice of (m), (\tau), (\epsilon)) can influence RQA outcomes, and a systematic sensitivity analysis was not performed. Moreover, while high Lmax and LAM indicate structural regularity, the biological significance—whether these patterns correspond to regulatory motifs, repetitive elements, or evolutionary constraints—remains to be experimentally validated.
Future work should expand the dataset to include diverse organisms, multiple genomic contexts (e.g., promoters, enhancers, satellite DNA), and larger sample sizes. Combining RQA with conventional linear methods could yield a multi‑scale framework capable of distinguishing functional from non‑functional repeats. Additionally, integrating RQA descriptors into machine‑learning classifiers may improve automated annotation of coding versus non‑coding regions and aid in the discovery of novel regulatory elements. In sum, the paper demonstrates that RQA, through its ability to capture deterministic and laminar structures, provides fresh insight into the longstanding question of why introns appear to possess stronger long‑range correlations than exons.
Comments & Academic Discussion
Loading comments...
Leave a Comment