A.-M. Guerrys Moral Statistics of France: Challenges for Multivariable Spatial Analysis
Andr\'{e}-Michel Guerry's (1833) Essai sur la Statistique Morale de la France was one of the foundation studies of modern social science. Guerry assembled data on crimes, suicides, literacy and other ``moral statistics,'' and used tables and maps to …
Authors: Michael Friendly
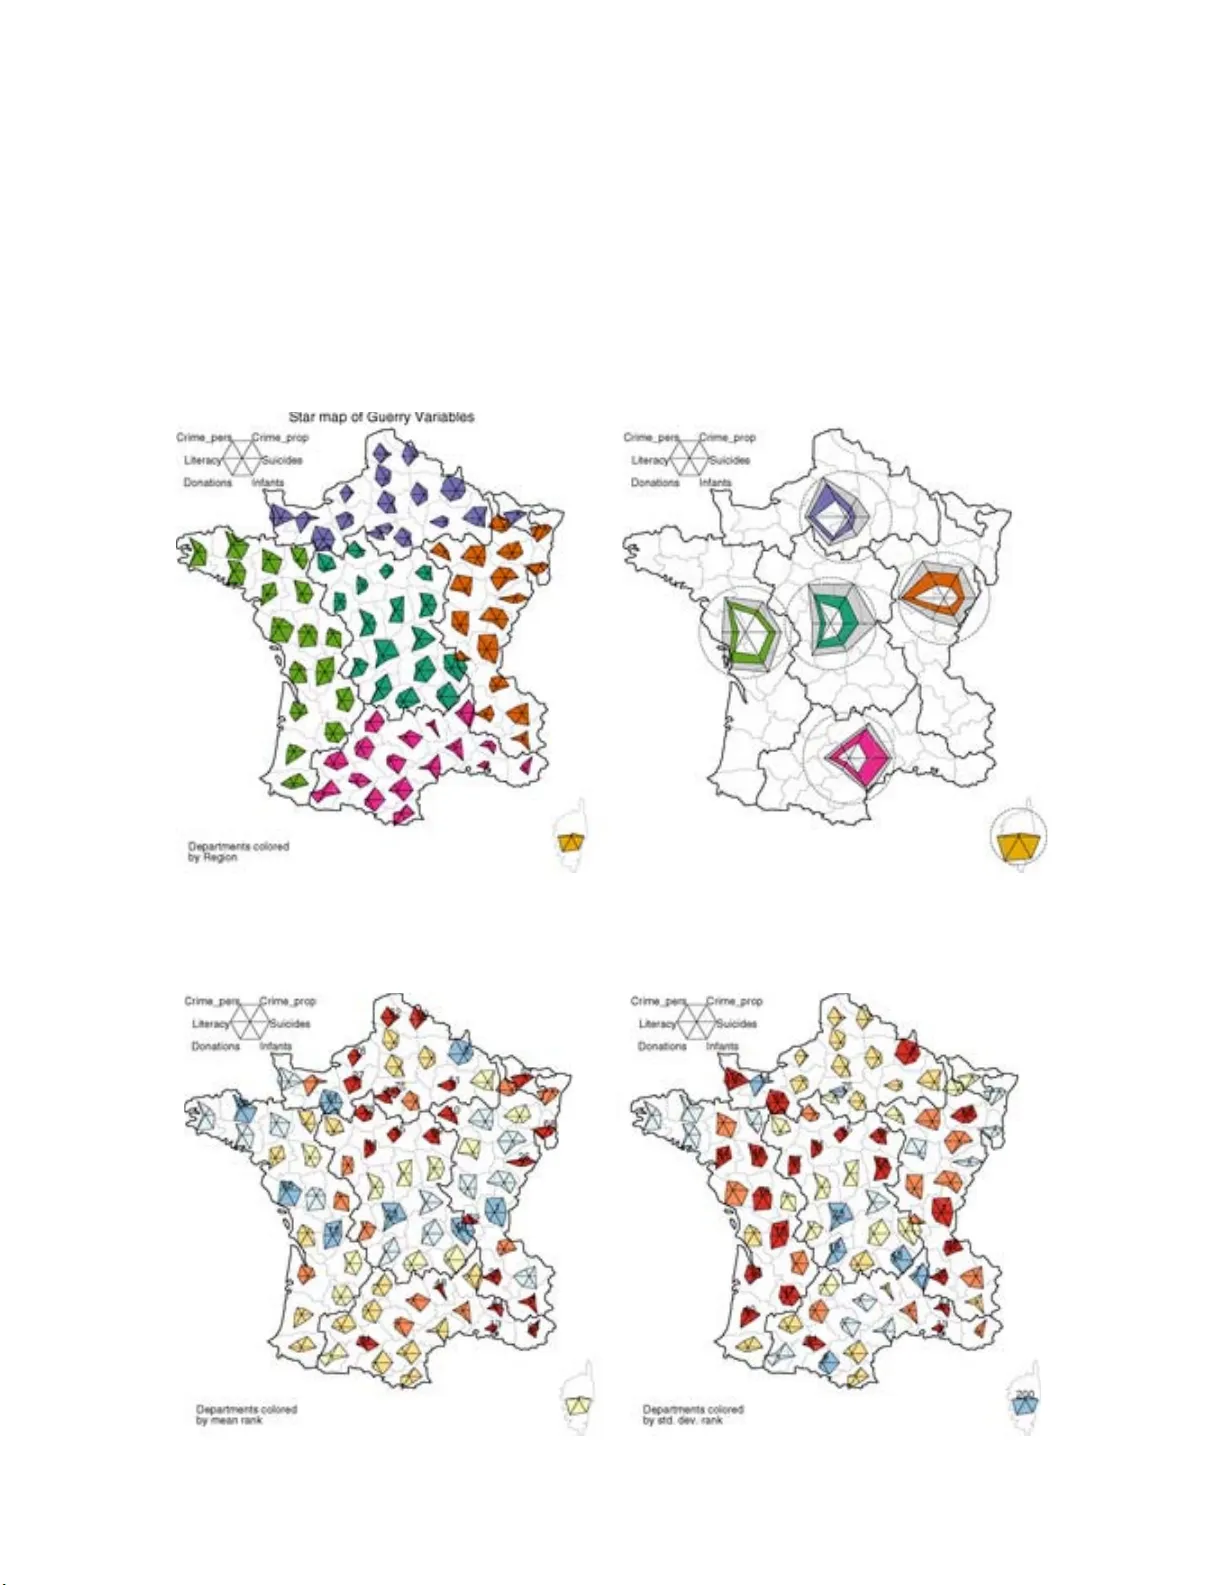
Statistic al Scienc e 2007, V ol. 22 , N o. 3, 368– 399 DOI: 10.1214 /07-STS241 c Institute of Mathematical Statistics , 2007 A.-M. Guerry’s Mo ra l Statistics of F rance: Challenges fo r Multiva riable Spatial Analysis Michael F riendly Abstr act. Andr´ e-Mic hel Guerry’s (1833 ) Essai sur la Statistique M or ale de la F r anc e w as one of the foundation stud ies of mo dern so cial science. Guerry assem bled data on crimes, suicides, literacy and other “moral statistic s,” and used tables and maps to analyze a v ariet y of so cial is- sues in p erhaps the first comprehensive study r elating suc h v ariables. Indeed, the Essai ma y b e considered the b o ok that launched mo d- ern empirical so cial science, for the questions raised and the metho d s Guerry dev elop ed to try to answer them. Guerry’s data consist of a large num b er of v ariables recorded for eac h of the d´ epartmen ts of F rance in the 1820–1830s and therefore in v olv e b oth m ultiv ariate and geographical asp ects. In additio n to h istorical in terest, these data p ro vide the opp ortunity to ask ho w modern meth- o ds of statistic s, graphics, thematic cartograph y and geo visualizat ion can shed further light on the questions he raised. W e presen t a v ariet y of metho ds attempting to addr ess Guerry’s c hallenge for m ultiv ariate spatial statistics. Key wor ds and phr ases: History of graphics, crime m apping, biplot, m ultiv ariate visualization, moral statistics. 1. INTRODUCTION On July 2, 1832 a slim manuscript w as presen ted to the Acad ´ emie F ran¸ caise des Sciences by t he 29 y ear old la wyer Andr´ e-Mic h el Guerry titled Essai sur la Statistique Mor ale de la F r anc e . Guerr y’s find ings w ere b oth startling and comp elling. His p resen ta- tion, in tables and c artes figur atives , of statistical data on crime, suicide and other m oral asp ects, mea- sured only recen tly in F rance, broke new groun d in thematic cartograph y and data visualization. Along Michae l F riend ly is Pr ofessor, Psycholo gy D ep artment, Y ork University, T or onto, Ont ario, M3J 1P3 Canad a e-mail: friend ly@yorku.c a . This is a n electronic repr int of the original ar ticle published by the Institute of Ma thematical Statistics in Statistic al Scienc e , 20 07, V ol. 22 , No. 3, 368–3 99 . This reprint differs from the o riginal in pa g ination and t yp ogr aphic detail. with the nearly sim ultaneous w ork of Adolphe Quetelet ( Quetelet ( 1831 ), 1835 ) in Belgium, Guerry’s Essai (pu blished in 1833) established the scien tific study of “moral stati stics” in Europ e and b ecame the laun ching pad for muc h of m o dern so cial sci- ence: criminology and so ciology in particular. Guerry’s results were startling for tw o reasons. First he show ed that rates of crime and suicide re- mained remark ably stable o v er time, when broke n do wn by age, sex, region of F rance and even sea- son o f the y ear; y et these num b ers v aried system- atical ly across d ´ epartemen ts of F rance . This regu- larit y of so cial num b ers created the p ossibilit y to conceiv e, for the first time, that human actions in the so cial world we re go v erned by so cial la ws, just as inanimate ob jects w ere go v erned by la ws of the physi cal world. By extension, these la ws could b e unco v ered by the careful collection and analysis of so cial “fact s,” meaning n umbers. Second, h e ov er- turned some w idespread b eliefs ab out the nature 1 2 M. FRIENDL Y and causes of crime and its relation to other observ- able f actors, suc h as education and p o vert y . Ov er h is lifetime, h e completed th ree ma jor works on moral statistic s, winning the Mon t yo n prize in statistics t wice from the Acad ´ emie F ran¸ caise des S ciences. His last w ork ( 1864 ) con templated multiv ariate ex- planations of relations among moral v ariables, at a time well b efore the dev elopment of correlation and regression. Y et Guerry’s contributions to statistics, graphics and the rise of mo dern so cial science in the early 1800s are n either well kno wn nor widely ap- preciated outside criminology and so ciology . This p ap er recoun ts Guerry ’s w ork, the questions he ask ed and the metho ds he used to answ er them in relation to his place in the history of d ata visu- alizat ion and statistics. T o d o so, we fi rst d escrib e the cont ext in wh ic h he w ork ed and whic h led to the rise of th e moral statistic s mo v ement in Eur op e. A second section describ es his life and wo rks and the metho ds he introdu ced to the stud y of moral statis- tics. Guerry w ork ed with vo luminous data on so cial v ariables, distributed o ver t ime and space (d ´ epartemen ts of F r ance, coun ties of England), and finely catego rized along numerous dimensions (age, sex and status of accused, detailed breakdo wn of t yp es of p ersonal and prop ert y crime, mot iv es for suicide, etc.). The final sections attempt some re- analyses of Guerry’s data to addr ess the c hallenges p osed for mo dern m ultiv ariate and spatial analysis. 1.1 The Rise of “Mo ral S tatistics” and Mo dern So cial Science The empirical and quantit ativ e study of factors affecting human so ciet y suc h as education, crime and pov erty that ga ve rise to mo d ern s o cial sci- ence b egan b et wee n 1825 and 1835, with the work of Andr ´ e-Mi c hel Guerry and Adolphe Quetelet . Bu t the ro ots of th is endea v or and the v ery p ossibilit y of observ ation-based la ws go v erning h uman p opula- tions go bac k muc h f urther. The systematic study of so cial n u m b ers, at first concerning p opulation data and dynamics, b egan in the 1660s with J ohn Graunt’ s ( 1662 ) and Willia m P ett y’s ( 1665 ) analyse s of the London Bil ls of Mor- tality . This work sho w ed ho w suc h n umb ers could inform the state ab out m atters rela ted to p opula- tion gro wth, age-sp ecific mortal it y , abilit y to rai se an army , the consequences of plagues, w ealth, taxes and so forth. “P olitic al arithmetic ,” as it was called, w as based on ly on the simple ideas of standardiz- ing ra w n um b ers by r elev an t tota ls and the “rule of three,” a : b as c : ? , to mak e prop ortional compar- isons; but by these means p olitical arithmeticians w ere able to establish a basis for comparisons o v er geographic region, time, age and other categories ( Klein ( 1997 )). The Bil ls of Morta lity w ere based on parish records of c hristenings and deaths, recorded nearly wee kly and with at least a mod icum of uniformity . In 1710, John Arb uthnot ( 1 710 ), a Scotti sh minister and physi cian to Queen Anne, calculate d the ratio of male to female births from these r ecords for 1629– 1710 and obs erv ed that the r atio w as consisten tly greater than 1 (see Figure 1 ). He used this la w- ful regularit y to argue that divine pro vid en ce, not c hance, go v erns the sex ratio, in p erhaps the first application of p r obabilit y to so cial statistics an d the first formal significance test. By the mid-1700s, the imp ortance of measuring and analyzing p opulation d istributions and th e id ea that ethical and stat e p olicies could encourage w ealth through p opulation gro wth was established, most notably by J ohann Pe ter S ¨ ussmilc h ( 1741 ), w ho ad- v o cated expansion of go v ernment al collec tion of p op- ulation statistics. Data on the so cial c haracter of h uman p opu lations w as still lac kin g, ho w ev er. In the p erio d leading u p to and through the Bour- b on Restoratio n follo wing Nap oleon’s defeat in 1815, crime was a serious concern, particularly in P aris, whic h witnessed an explosiv e growth in p opulation, along with w idespread inflation and unemp lo ymen t, and the emergence of an imp o v erished, dangerous class of p ett y criminals (les mis´ erables); see Beirne ( 1993 a ) and Chev alier ( 1958 ). Then, as no w, there w ere t wo basic schools of thought regarding crimi- nal j ustice p olicy and m uc h debate ab out the trea t- men t of prisoners. A lib eral, philanthr op e p ositio n adv o cated increased education, r eligious instruction, impro v ed d iet (bread and soup !) and b etter prison conditions as the means to reduce crime and recidi- vism. Hard-line, conserv ativ es feared attempts at prison reform, doubted the efficacy of campaigns for public educatio n and view ed suggestions to abandon the harsh pu n ishment of con victs u nder th e ancien r ´ eg ime with grav e susp icion if not alarm. But the ev- idence marshalled to sup p ort su c h recommendations w as fragmen tary , restricted and often idiosyncratic . See Whitt ( 2002 , p ages xxvi–xxxi), Beirne ( 1993b ) and Porter ( 1986 , pages 27–30) for m ore bac kground on the so cial cont ext in whic h the Essai was written. This c hanged in 1825 w h en th e Ministry of Justice in F rance in stituted the first cen tralized, national GUERR Y’S MORAL ST A TISTICS OF FRANCE 3 Fig. 1. Ar buthnot ’ s data on the male/female sex r atio. The aver age, shown by the upp er dashe d line is 1.07; the thicker l ine shows a lo ess smo oth. The pr ob abil ity of r atios gr e ater than 1 over 82 ye ars is ( 1 2 ) 82 = 2 × 10 − 25 under the nul l hyp othesis that the pr ob ability of a male bi rth is 1 / 2 . system of crime rep orting, collected quarterly f rom ev ery d´ epartemen t and r ecording the details of ev- ery criminal c harge laid b efore the F renc h courts: age, sex and o ccupation of the accused, the nature of the c harge and the outcome in court. 1 Ann ual statistic al pu blications of this data, known as the Compte G´ en´ er al de l’A dministr ation de la Justic e Criminel le en F r anc e , b egan in 1827 u nder th e ini- tiativ e of Jacques Guerry d e C hampneuf, the direc- tor of affair es criminel les in th e Ministry of Justice ( F aure , 1918 , pages 293–29 4). 2 1 This ex tended a mo del b egun in Paris in 1821 with an- nual publications of the R e cher ches Statistiques sur la Vi l le de Paris et le D´ ep artement de la Seine und er the direction of Jean Baptiste Joseph F ourier (1768–18 30) tow ard t h e end of his life. These volumes detailed births, marriages and deaths, but also pro vided extensiv e tabulations and breakdo wns of in- mates of P arisian insane asylums, and of motives and causes of suicides. See Hac king ( 1990 , pages 73–77). 2 Guerry de Champneuf w as said to b e related to Andr´ e- Mic hel, by a contemporary reviewe r of t h e Essai ( Caun ter ( 1833 )); Hacking ( 1990 , page 77) calls him a cousin. There is n o evidence to supp ort a family relation. The similarit y of names caused some confusion among American sociolo- gists, starting with M. C. Elmer ( 1933 ), who conjoined th e During the same p eriod, a w ealth of other data on moral and other v ariables b ecame a v ailable: data on age d istributions and imm igran ts in P aris b egan with the 1817 censu s; Alexander P aren t-Duc hatelet ( 1836 ) pro vided comprehensive d ata on p rostitutes in P aris, b y y ear and place of birth; the Ministry of W ar b egan to record data on conscripts who could read and write; inf orm ation on wea lth (indicated b y taxes), in d ustry (indicated by patent s filed) and ev en wa gers on roy al lotteries b ecame a v ailable for the d ´ epartement s of F rance in v arious bulletins of the Ministry of Finance, 1820–18 30. Th us, the stag e w as set by this “a v alanc he of num b ers” ( Hac king ( 1990 )) for someone to t ry to mak e sense of com- p eting claims ab out the causes of crime from com- prehensive data and detailed analysis. Andr ´ e-Mic hel Guerry happ ened to b e in the right place at the righ t time, bu t more imp ortantl y , he had a passion for n umb ers a nd his qu est f or taming it w ould nea rly o ccup y his ent ire professional life. tw o into the sia mese twi n, M. de Guerry de Champn eu f, or M. d e Champneuf for short. 4 M. FRIENDL Y 2. GUERRY’S LIFE, WORK AND METHODS Unlik e Qu etelet, a br illiant academic p olitician and effectiv e self-promoter who ac h iev ed pr ominence in academic and so cial circles throughout Europ e and whose life h as b een w idely biographed, Guerr y’s fame in his lifetime, like his life itself, was more mo dest. Aside from brief, bare-b ones entrie s in the Gr and Dictionnair e Universel ( Larousse ( 186 6 )) and similar sources ( Carr ´ e de Busserolle ( 1880 ); V ap ereau ( 1858 )), the primary sources on Guerry’s life are the sev en-page necrology b y Alfred Maury , a long-time friend and fello w memb er of the Acad ´ emie des Scie nces Morales et Pol itiques, read at his fu - neral in April, 1866, and notices on Gu erry’s wo rk b y Hyp olyte Diard and Ernest Vinet. These w ere ini- tially published s eparately in the month of Guerr y’s death and then p rint ed together in Diard ( 1867 ). Secondary sources include Whitt’s ( 2002 ) p reface to the translation of the Essai , Beirne ( 1993b ) and a scattering of brief ment ions, often in relation to Quetelet, b y criminologists, so ciologists ( Lazarsfeld ( 1961 ); Isambert ( 1969 )) and historians ( Hac king ( 1990 ); P orter ( 1986 )). Guerry w as b orn in T ours on Decem b er 24, 18 02; his birth certificat e lists his father, Mic hel Guerry , as a public w orks contrac tor, and the indicatio ns from historical sources are that his family circumstances w ere comfortable though neither w ealth y nor highly connected. He studied la w, literature and p h ysiol- ogy at the Un iv ersit y of P oitiers, and wa s admitted to the bar in Paris, w here he b ecame a Ro yal Adv o- cat ( Diard ( 1867 )). In 1827 he b egan to work with the Compte G ´ en´ er al in the course of his d uties with the Ministry of Justice. He b ecame so fascinated by these data that he abandoned activ e practice in la w to devo te himself to their analysis, a task h e w ould pursue unt il his d eath in 1866. Sadly , n o details of his p ersonal or family life are a v ailable. 3 One early statistica l work ( Guerry ( 1829 )) exam- ined the relati on b et we en weather and morta lit y from v arious diseases, and cont ained graph s of admissions to hospitals and p olar area diagrams of the v ariation of w eather phenomena, by month and hour 4 ; other 3 Guerry had n o siblings, he n ever marrie d and had no chil- dren. Nothing is yet kno wn ab out his p ersonal life in Paris. How ever, his famil y h ad deep roots in the area around T ours that ha ve no w b een traced bac k to t h e early 1600 s ( F riendly ( 2007c )). 4 These 1829 p olar area charts predate those by Florence Nighti ngale ( 1857 ), who is widely credited as the in ven tor of early studies concerned ph ysiologic al c haracteristics (e.g., p ulse rate) of in mates at insane asylum s and prisons. T o w ard the end of his career, he in v ente d a calculating or tabulating device (the or donna teur statistique ) to aid the work on the d ata from his last w ork and magnum opus ( Guerry ( 1864 )), the details of which remain shrouded. 5 Ov er h is career, he pro- duced the th r ee ma jor w orks on moral statistic s de- scrib ed b elo w. General discussion of his metho ds of analysis follo ws in Section 2.4 . 2.1 1829: Stat istique Compar ´ ee de l’ ´ Etat de l’Instruction et du Nomb re des Crimes Guerry’s first publication on moral statistics wa s a large, single-sheet set of three shaded maps com- paring crime and instruction titl ed Statistique Com- p ar´ ee de l’ ´ Etat de l’Instruction et du N ombr e des Crimes pr o duced together with the V enetian ge- ographer Adriano Balbi ( Balbi and Guerry ( 1829 )), sho wn here in Figure 2 . The data on crime from the Compte G´ e n ´ er al of 1825– 1827 w ere com bined with data fr om the census to giv e measures of p opulation p er crime (num b er of inhabitant s to giv e one con- demned p erson) for 81 d´ epartemen ts; the data on instruction a re based on the num b er of male c h il- dren in primary sc ho ols in 26 educational d istricts (cours roy ales and acad ´ emies) in F rance, also in the form of inhabitan ts p er stud en t. this graphical form, using sectors of fixed angle, b ut v arying radii to sh ow frequen cy of some events, typically for cy clic phenomena. Guerry’s plate show s six such diagrams, all for daily phenomena. F our of these show direction of the wind in 8 sectors, for 3-month perio ds; tw o show births and deaths, respectively , by hour of the da y . Guerry says that t hese rep- resen t just a part of his original, muc h larger diagrams, which w ere not at first designed to b e published. 5 The or donnateur statist ique is simply mentioned in pass- ing by Larousse; Maury (page 5) says the mac hine w as offered by Guerry’s heirs to the Conserv atoire des Arts et M´ etiers. It is p ossible that this d evice briefly came i nto the h ands of Maurice d’Ocagne, Professor at th e ENPC and principal de- velo p er of nomog raphy , but almost certain that h e observ ed it when he disco vered the collecti on of calculating machines held b y the Conserv atoire. Ocagne presented several lectures at the Conserv atoire in F ebruary and Mar ch 1893 titled “Le Calcul Simplifi´ e par les Proc´ ed´ es M´ ecaniques et Graphiq ues,” but th ere is no mention of Guerry in the pap ers printed in the Annales du Conservatoir e ( d’Ocagne ( 1893 )). There is a curious connection with I BM h ere: IBM F rance introdu ced the term or dinateur to replace the deprecated franglais term, c omputeur ; Ocagne also stud ied another collection of early calculating d ev ices b elonging to General S eb ert, p urchased later by IBM F rance, which may also h a ve acquired others. The arc hivists at IBM can find no records of these. GUERR Y’S MORAL ST A TISTICS OF FRANCE 5 Fig. 2. Guer ry and Balbi ’ s 1829 Statistique Compar´ ee de l’ ´ Etat de l’Instruction et du Nom bre des Crimes . T op left: crimes against p ersons; top right: crimes against pr op erty; b ottom: instruction. In e ach map, the d´ ep artements ar e shade d so that darker is worse (mor e crime or less e duc ation). The le gend at the l ower left gi ves the data on which the maps wer e b ase d. Source: Courtesy of BNF; Palsky ( 1996 , Figur e 19). The exact source of the d ata on instr u ction is u n- clear. T he leg end for the maps cites the Ministry of Instruction for 18 22, but Guerry’s printe d commen- tary on this w ork (repub lished in Guerry ( 1832 )) cites Bal bi’s 1822 Statistique du R oyaume de Portu- gal. . . as the first do cument that published a table of data on the lev el of pu blic education in F rance. What is clear is the impact they had on Guerry and others. I n 1823 the geographer Conrad Malte- Brun (1775– 1826) 6 in commen tary on Balbi’s ta- ble remarke d that there app eared to b e a muc h 6 Journal des D´ eb ats , 21 jul 1823, pages 3–4. lo w er lev el of instru ction in the south of F rance com- pared with the north; he referred to this as the con trast b etw een la F r anc e obscur e and la F r anc e ´ eclair´ ee . Quite sh ortly , Baron Charles Dupin , p er- haps ins pired by this observ ation, though t to p or- tra y these data on a map of F rance ( Dupin ( 1826 ), 1827 ), u sing s hades of v arying darkness to d ep ict degrees of ignorance. This in v enti on—the first mod- ern statistical map—w as the starting p oin t of a true graphical rev olution that Guerry w ould extend to a more general so cial cartograph y with the c omp ar a- tive analysis of so cial issues. The legac y of this rev- olution is commonplace to d a y , in maps of disease 6 M. FRIENDL Y incidence, p o v ert y , c hild mortali t y , income distribu- tion 7 and so forth ( F r iend ly and P alsky ( 2007 )). Guerry and Balbi’s Statistique Comp ar´ ee. . . in 1829 w as th e first use of shad ed maps to p ortra y crime rates. T heir presen tation is also notable in the history of statistical graphics as the first to com- bine seve ral moral v ariables in a single view, al- lo wing direct comparison of crimes against p ersons and against prop ert y with data on instruction across the d ´ epartemen ts of F r ance. They suggested that, (a) su rprisingly , p ersonal crimes and prop erty crimes seemed in v ersely r elated o v erall, bu t b oth tended to b e high in more urban areas; (b) a clear demarca- tion could b e seen in instru ction b et w een the n orth and south of F rance along a line run ning northeast from Genev a (Ain) to Cˆ otes du Nord 8 ; (c) the north of F rance not only sho we d the highest lev els of ed- ucation, b ut also of prop ert y crime. A t the v ery least, this work testified to the imp ortance of de- tailed data, sensibly presente d, to inform the d ebate on the relations of crime and education. 2.2 1833: Essai sur la St atistique Mo rale de la France Ov er the n ext thr ee yea rs Guerry w ould occupy himself with the extension and r efinemen t of these initial results, w ith extensiv e tabulation of n ew data from d iv erse sources and with answers to metho d- ologic al questions that mig ht lead to c hallenges t o his conclusions. On the method ologic al s id e, he d iscussed h o w these measures shou ld b e defined to ensure comparabilit y across F rance and what we would no w term v alid- it y of the ind icators used. F or education, f or exam- ple, he considered the rep orted lev els of in s tr u ction (n umber of male children in pr imary sc ho ol) to b e susp ect due to v ariations in lo cal rep orting; after 1827, b etter and more un iform d ata b ecame a v ail- able from the Ministry of W ar, whose exams for n ew recruits ga v e num b ers for those who could read and write. A second ma j or question he addr essed was whether crimes should b e coun ted by the num b er of indict- men ts ( ac cus´ es ) or by the num b er of con victions 7 See www.w orldmapp er.org for a collection of ove r 300 w orld cartograms, where t erritories are resized according to the sub ject of in terest. 8 This sharp cleav age b etw een F rance du Nord et Midi or F rance obscure vs. F rance ´ eclair´ ee would b ecome reifin e d as the “Sain t-Malo–Genev a line” and generate much debate about causes and circumstances through th e end of the 19th century . ( c ondamn ´ es ). Here, he argued p ersuasiv ely that the n umb er of indictment s wa s a more useful indicator of the n umb er of crimes committed b ecause it is less lik ely to b e influenced by the factors that affect ju - ries: the nature of the crime, sev erit y of punishment and the place where the acc used is judged. More- o v er, a lthough an in d ictmen t by n o means implies the guilt of t he accused, it do es reasonably imply that a crime was committed; con v ersely , a p erson migh t b e acquitte d f or a v ariet y of reasons, but that do es not mean that a crime did not tak e place. The Essai published in 1833 con tained numerous tables giving breakdo wns of crimes against p ersons and prop erty by charac teristics of the accused, fre- quencies of v arious s ubt yp es of crime in rank order for b oth men and women (for men, the most p opular p ersonal crime was assault and battery; for w omen, infan ticide) and frequencies of crimes by age groups. T o go b ey ond simple description, Guerry classi- fied the crimes of p oisoning, m an s laughter, m urder and arson according to the apparent motiv e in d i- cated in court records (for p oisoning, th e motiv e w as most frequent ly adultery; f or m urder, it w as hatred or ve ngeance). Th is quest to examine mo- tiv es and causes is most apparen t an d impressiv e in his analysis of suicide, a topic of considerable de- bate in b oth the medical communit y (whic h con- sidered it in relation to madness and other mal- adies) and the legal comm unit y (whic h c onsidered whether it should b e a crime or at least within the purview of t he ju stice m in istry). “W hat would b e useful to kn o w would b e the frequency and imp or- tance of eac h of these causes relativ e to all the oth- ers. Bey ond this, it w ould b e n ecessary to determine whether their influence . . . v aries b y age, sex, edu- cation, w ealth, or social p osition” (( Guerry , 1833 , page 131, WR trans.)). T o this end, he carried out p erhaps t he first c onte nt a nalysis in social science b y classifying the suicide notes in Paris acc ording to motiv es or sentimen ts expressed for taking one’s life. This approac h to the study of suicide would later b e adopted by Durkheim ( 1897 ), b ut without m uc h credit to Guerry and other moral statisticians. The Essai also con tained a collec tion of b ar graphs, highligh ting certain comparisons (crimes against p er- sons o ccurred most often in su mmer months, wh ile those against p rop erty were most fr equen t in the win ter; suicides b y y oung males w ere most often car- ried out with a pistol, wh ile older males preferred hanging). As well, to d iscuss geographica l differences and relat e these moral v ariables to eac h other, he GUERR Y’S MORAL ST A TISTICS OF FRANCE 7 Fig. 3. Guerry ’ s 1833 map of levels of instruction in F r anc e (Plate I I I ). The original c ontains the numb ers (p er c ent of young men who c an r e ad and wri te) for e ach d´ ep artement in r ank or der liste d b elow the map. Source : Aut hor’s i mage c ol l e ction. prepared six thematic maps of F rance, adding ille- gitimate births ( infants natur el les ), donations to the p o or (num b er of gifts and b equ ests) and s uicide to those of p ersonal crime, prop erty crime and edu ca- tion presen ted earlier, b ut based on more complete data and b etter indicators. F or ease of comparison, these v ariables w ere all expressed in a form such that “more is b etter,” for example, p opulation p er crime or p ercen t able to read and write. In p reparing the maps, these v ariables w ere fi rst conv erted to ranks and then t he d ´ epartemen ts w ere sh aded according to rank, so that darke r tin ts w ere applied to the d ´ epartemen ts th at fared w orse on a give n measure (more crime, less education). These maps are generally more detailed and finely dra wn th an those p r o duced in 1829 . Figure 3 shows an example, the m ap lab eled “Instruction,” but sho w- ing the p ercen t of military conscripts wh o could read and wr ite. Figure 4 shows all six of Guerry’s maps, repro du ced f r om his data using mod ern soft w are. Guerry’s E ssai was receiv ed with considerable en- th usiasm in Europ ean statistica l circles, particularly in F r ance and England. In F rance it wa s a w arded the Prix Mont yon in 1833 and the publication includes a laudatory rep ort on its conte nts to the Acad ´ emie d es Sciences. Guerry was also elected to the Acad ´ emie des S ciences Morales et Poli tiques and at some p oin t w as a wa rded the cross of chev alier of th e Legion of Honor ( Diard ( 1867 )). The Essai wa s reviewe d quite fa v orably in the A thenaeum ( Caun ter ( 1833 )) and the Westminster R eview ( Anon ymous ( 1833 )), whic h ga ve a length y d iscussion of Guerry’s find ings and p raised the b o ok as one of “substan tial in ter- est and imp ortance.” Henry Lytton Bulw er’s ( 1834 ) F r anc e , So cial , Liter ary , Politic al devot ed 26 pages to Guerr y’s results, calling the w ork “remark able on 8 M. FRIENDL Y Fig. 4. R epr o duction of Guerry ’ s six maps. Color c o ding, as in Guerry ’ s originals, is such that darker shading signifies worse on e ach m or al variable. Numb ers for e ach d ´ ep artement give the r ank or der on that variable. man y acco unts.” Guerry display ed the maps in sev- eral exp ositions in Europ e and, in 1851, had t w o ex- hibitions in England—an h onored public one in the Crystal Pa lace at the L ondon Exp ositio n and a s ec- ond at the British Asso ciation for the Adv ancemen t of Science (BAAS) in Bath. 2.3 1864: Stat istique Morale de l’Angleterre Compa r´ ee avec la Stat istique Morale de la F rance. . . Guerry’s most am bitious wo rk, and the capstone of his career, did not a pp ear for another 3 0 years, but it w as well w orth w aiting for. The Statist ique Mor ale de l’A ngleterr e Comp ar´ ee ave c la Statistique Mor ale de la F r anc e w as p ublished in a grand form at (56 × 39 cm, ab out the size of a large coffee table ); it con tains an int ro d uction of 60 pages and 17 exquisite color plates. The int ro d uction sets out Guerry’s view of the h istory of the application of statistics to th e moral s ciences. In it, he prop oses to r eplace the term “moral statistics” or simp ly do cumen tary statistics with “analytical statistic s.” The former, present ed almost inv ariably in tables, is concerned with the n umerical exp osition of facts; the latte r p resen ts the successiv e transformation of these f acts, b y calc ula- tion, b y concen tration and their reduction to a small n umb er of general abstract r esults. One can see here a th orough explanation of the graphic metho d ap- plied to moral and so cial data. Fifteen of the plates show data for the d ´ epartemen ts of F r an ce (from 1825 to 1855) or the coun ties of England (1834–1856 ) on a particular topic, first for F rance, then for England: crimes against p ersons, crimes against prop ert y , m urder, rap e, larcen y b y serv an ts ( vol dom estique ), arson, instruc- tion and suicide (only for F rance). In eac h case, to ensure comparabilit y of the num b ers for the v ari- ous crimes across d ´ epartemen ts and counti es, and from one measure to another, Guerry stand ard ized the rates for eac h map and coun try to “degree of criminalit y ,” with a mean of 1000 and common (un- sp ecified) metric. Thus, one could easily see where P aris/Seine or London sto o d on m urd er vs . suicide or compare one to the other on theft. GUERR Y’S MORAL ST A TISTICS OF FRANCE 9 Fig. 5. Guerry ’ s 1864 Pl ate 1: Cri m es against p ersons in F r anc e. Source : Court esy of Staats bibliothek zu Berlin. Eac h of these plates exemplifies the p rogram of statistique analytique that Guerry h ad in mind, as illustrated by Figures 5 and 6 . The m ap of En gland or F rance shows the geog raph ic distribution, with coun ties or d ´ epartemen ts s h aded according to th eir rank order on the v ariable, the highest (rank = 1) shaded darke st and the lo west shaded ligh test. A large v ariet y of sp ecial symb ols and annotations are used on the map to indicate notew orthy patterns or circumstances, fo r example, up or down arro ws to 10 M. FRIENDL Y Fig. 6. Guerry’s 1864 Plate 2: C ri mes against p ersons i n England. Source : Courtesy of Staat sbibliothek zu Berlin. sho w increase or d ecrease o v er time in a geo graphic unit. The table b elo w the map lists the ranks and data v alues, expressed as “degree of criminalit y .” Eac h map is an o v erall su mmary for 30 y ears, for a ll accused and for all crimes in a give n class. Guerry w ant ed also to sh o w patterns, trends or de- viations within these d ata. Thus, sur rounding eac h map, h e placed a v ariet y of line graph s designed to decomp ose or transform these o ve rall facts or to re- late them to o ther factors. Mo st of these featured time series graphs of trends o ver time, ofte n d ecom- p osed in to separate series by sub t yp e of crime or GUERR Y’S MORAL ST A TISTICS OF FRANCE 11 Fig. 7. Detail fr om Plate 1: Time series chart of de ath sentenc es and exe cutions, 1825–1855. Source : Courtesy of Staats- bibliothek zu Berlin. c haracteristics of the accused, such as age or sex. Plate 1 (Figure 5 ), for example, includes at the top a general su mmary time series of the num b er of crimes aga inst p ersons and prop ert y (left), and of the num b ers cond emned to death and executed ov er the 30 y ear p erio d (righ t: Figure 7 ). Distributions of crimes b y mont h of the y ear, moreo ve r, reve al that crimes against p ersons w ere greatest in th e summer and least in th e win ter; pr op ert y crimes in F rance sho we d the r ev erse pattern. Beneath the map, an in- dex plot of the degree of criminalit y v alues by rank sho ws the fo rm of th e distribution across coun ties and d ´ epartement s. Aga in, many sp ecial symb ols are used to mark the minimum, m axim um, m ean, me- dian, increase or decrease, p ossibly f allible num b ers and so forth; the nearly 10 0 such symbols defined in an app endix clea rly required some typographic calisthenics, as they r un thr ough sev eral alphab ets plus the a v ailable diacritical marks. The fi n al t wo plates serv e as the culmination of Guerry’s program of analytical statistics and pro- vide an am bitious attempt to delineate multifac tor and multiv ariate r elations among rates of crime in England and F rance; these are d iscus sed in the sub - section b elo w. One cannot fail to b e impressed b y the sheer v ol- ume of d ata summarized here; th ese include o v er 226,00 0 cases of p ersonal crime in t w o countrie s ov er 25 y ears and o ve r 85, 000 suicide records, classified b y motiv e. Guerry estimated that if all his num b ers w ere written do w n in a line, they w ould stretc h o ver 1170 meters! Hac king ( 1990 , page 80) credits this ob- serv ation as the source of his phrase “an av alanc h e of n umbers.” 2.4 Guerry’s Metho ds and Analyses Guerry w ork ed in a time b efore the ideas of cor- relation and regression were inv en ted, and at about the same time that the first true scatterplot of t wo v ariables app eared in an astronomical pap er by John Hersc hel ( 1833 ); see F riendly and Denis ( 2 005 ) fo r an account of the origin of the scatterplot) . Although he later included quotations from Herschel in the 1864 comparativ e study of England and F rance, there is no e vidence that he w as a ware of any biv ariate metho ds in 1833, and ev en the 1864 w ork shows n o a w areness of scatterplot s for studying the rela tion b et we en v ariables. 2.4.1 Gr aphic c omp arisons. His metho d w as there- fore limited to direct comparisons of distribu tions or pairs of v ariables, sho wn either in rank ed lists or on his shaded maps . Figure 8 attempts to cap- ture the spirit of Gu err y’s approac h , comparin g the map of r ates of crimes against p ersons with that for literacy . T o illustrate Guerry’s thin king, I used the in teractiv e Mondrian soft w are ( Theus ( 2002 )) to comp ose s ide-b y-side maps with a rank ed parallel co ord inates plot in th e midd le. Th e b est conclusion one can dra w directly from the maps is that any re- lation b et w een the tw o is w eak or inconsisten t, as 12 M. FRIENDL Y Fig. 8. Comp arison of crimes against p ersons with liter acy ( % who c an r e ad and write). The two maps (a) and (c) show, by shading intensity, the r ank or ders of e ach of these variables. The midd le p anel (b) i s a p ar al lel c o or dinates plot of the r anks, c onne cting the two maps. Images f r om analysis with Mondrian ( Theus ( 2002 )). there are r egions w h ere literacy is lo w and crime is high (c ent ral F rance), but other areas where b oth are relativ ely high or lo w. He sa ys: Let us no w compare this map with the one for crimes against p ersons. The maxim um crime rate is in Corsica. Is this b ecause there is greate r ignorance there? Ou r map supplies evidence to the con trary . F urther, the minim um o ccurs in the western an d cen tral pr ovinces. Can it b e said that the highest lev el of education p rev ails there? Clearly , the relationship p eople talk ab out do es not exist ( Guerry ( 1833 ), page 90, WR trans.). Similarly , in discussing the relationship b et w een crime and suicide he sa ys: One might think that . . . the violen t n a- tional c haracter of our southern p ro vinces, whic h . . . pro duce s uc h a large n um b er of crimes against p ersons, should also lead man y p eople to kil l themselv es. But this w ould b e incorrect. A co mparison of the suicide m ap with the one for crimes against p ersons leads to the d isco v ery that, w ith v ery few exceptions (esp ecially for Alsace and Pro ve nce), the d ´ epartemen ts wh ere the liv es of others are most often attac ke d are precisely those wh ere p eople most rarely mak e attempts on their o wn and vice v ersa ( Guerry ( 1833 ), page 130). T o da y , conclusions based on such comparisons of group ed rates are often charged with commission of an ecol ogical fallacy ( F reedman ( 2001 ))—that in- ferences ab out relationships observe d for aggregate data m ay not hold for individuals (du e to confound- ing or aggreg ation bias). 9 Guerry w as certainly a w are of the problem of ecologi cal co rrelation, at least in general terms. In his discussion of the relationship b et we en crimes and education ( Guerry ( 1833 ), pages 94–95 ), he n oted that since 1828 the Comp te pr e- sen ted data on th e educational lev el of accused p er- sons and ask ed rhetorically , “is it the case that there is indeed greater ignorance among individuals pros- ecuted for crimes against p ers on s than among other defendant s?” One answer to the p roblem of ecologic al co rrela- tion is pro vided b y comparing the literac y of prison- ers with those in the general p opulation. T o count er the argument that those found guilt y of crimes against p ersons are more ignorant than those wh o commit only prop ert y crimes, he sho w ed that educa- 9 The classic example is Durkh eim’s ( 1897 ) assertion th at suicide was someho w promoted by the so cial conditions of Protestan tism b ecause suicide wa s higher in countries that w ere more heavily Protestan t. Of course, the largely Protes- tant countrie s differed from the Catholic countries in man y w ays b esides religion. Current rese arch on the relation of suicide to other va riables contin ues to examine correlations o ver geographical units, often uncritically (e.g., Bills and Li ( 2005 )). GUERR Y’S MORAL ST A TISTICS OF FRANCE 13 tion is in fact higher among those committing p er- sonal crimes; moreo ver, “among these latter crimes, the most depra v ed and p erv erse app ear generally to b e committed by p reference b y educated p erp etra- tors” ( Guerry ( 1833 ), page 94). T o examine how the particular t yp es of crimes committed v aried wit h age of the ac cused, Guerry in 183 3 prepared the rank ed lists sho wn in Fig ure 9 for b oth crimes against p ersons and crimes against prop erty . T o make the trends more amenable to vi- sual insp ection, h e connected the same crime across age with lines. T his giv es a semigraphic display that com bines a table (sho wing actual n umbers) with the first kno wn instance of a parallel co ordinate plot. In the original, the trace lines are han d colored in d if- feren t ligh t hues to mak e them visually distinct. F rom this, Guerry discussed a v ariet y of trends, suc h as the decrease in indecen t assault on adults ( viol sur des adultes ) with age (while indecen t as- sault on c hildren r ises to the top f or those ov er 70) and the increase in parricide with age (sur p risingly reac hing a maxim um for “c hildren” aged 60–70 ). Among crimes aga inst p r op ert y , he p oin ted out that theft and domestic theft are the m ost co mmon at all ages, but (the curious sub categ ory) theft from c h urches has a U-shap ed relation with age, while extortion and emb ezzlemen t ( c oncussion ) rise fr om the very b ottom in the y oung to near the top among older groups. As noted ab o ve , by 186 4, Guerry w as striving for more analytic metho ds to rev eal the regularit y and v ariation in moral statistic s, and he had an enor- mous amoun t of data: 30 y ears for F rance, 23 for England. In the final t wo p lates in 1864, Guerry abandoned the geographical f ramew ork of the map to highligh t more general patterns in crime and rela- tions with explanatory and p ossibly causal factors, and ho w these compare in En gland and F rance. Plate 16 (sho wn in Figure 10 ) is dev oted to a de- tailed comparativ e analysis of the age distribu tion for v arious crimes and suicide (only for F r an ce, b ot- tom left). In con trast to the rank ed lists he had used earlier (Figure 9 ), he u sed sid e-b y-side displa ys for England (197,0 00 accused of kn o wn age) and F rance (205,0 00 accused) of 10 collec tions of frequency d is- tributions across age for crimes in v arious categories (theft, arson, murder, indecency and so forth). Eac h blo c k provi des separate curv es comparin g the age distributions of su bt yp es within a giv en category (e.g., Bloc k I I: m urder, manslaugh ter, gra v e wound- ing; Blo c k VI: bu rglary , housebreaking, robb ery). V arious annotations on the c harts sho w the mean (M), missin g d ata (small circles, indicating no crimes recorded in a give n ag e category), the relativ e fre- quency of crimes committed by those under 21 and so forth. 2.4.2 Guerry’s Magnum Opus. The last p late (Plate 17, sho wn in Figure 11 ), t itled Causes G ´ e n´ er ales des Crimes , is by far the most imp res- siv e and also the most complex, and ma y b e called Guerry’s Magn um Opus. It is a no vel semigraphic table d evised to s ho w the multiv ariate asso ciations of v arious t yp es of crimes with other moral and p op- ulation c haracteristics, b ut at a time wh en ev en bi- v ariate metho ds w ere unkno wn. The image sho wn here cannot do ju stice to the original, so I will try to describ e it and also con ve y the sense of a we I felt when I firs t saw it in the British Library . Guerry’s goal h ere is to show the factors associated b oth p os- itiv ely and n egativ ely w ith crimes and their geo- graphic distribution, us in g data from England as a sp ecimen of this approac h. The c hart is headed “Libration Compar ´ ee des Crimes d e Chaque Na ture et d es ´ El ´ emen ts S tatis- tiques a v ec Lesquels ils son t Li ´ es dans leur Distri- bution G ´ eographique” (comparativ e libration of the crimes of eac h nature and the statistica l elemen ts with w hic h they are link ed in their geographical dis- tribution). The rows sho w 23 t yp es of crimes ordered b y frequency and seriousness f rom top (debauc hery , bigam y , domestic theft) to the b ottom (fraud, rap e, m urder). Ju st b elo w this are s ets of summaries con- densing these in to crimes ag ainst p ersons and prop- ert y , and other general categories. The columns re- fer to the rank orders of the 52 coun ties of England on e ac h crime separately . Thus, on crimes aga inst p ersons, Mi dd lesex sta nd s at rank 1 (left), with a “degree of criminalit y” of 1958, wh ile Merioneth is at rank 52 (righ t) with 392. F or the crime of arson, differen t countie s occupy these ranks, of course, but it is the c haracteristics of the counties at v arious ranks that Guerry w an ts to sh o w. The ent ries in this graphic table are symbols for a v ariet y of moral a nd social c h aracteristic s found either w ith high prev alence or lo w prev alence in the particular count y at eac h rank for eac h crime. The legend at the b ottom id en tifies the follo wing kinds of symb ols: (a) those for asp ects of p opulation (den- sit y of p opulation, p ercen tage of Irish , agricultural, maritime, domestics, etc.); (b) asp ects of criminal- it y (pred ominan ce of m ale, female, young, old, etc. 14 M. FRIENDL Y Fig. 9. R elative r anking of crimes at differ ent ages. relativ e to th e av erage); (c) instruction (predomi- nance of instru ction of males, of criminals, of pris- oners); (d) asp ects of religio n (Anglicans, dissidents, Catholic, etc.; attendance at public w orship). Ov erlaid on this are seve ral sets of lines trac ing profiles of the “cen tre d e libr ation” (an astronom- ical term meaning ce nter of osc illation) of v arious t yp es of so cial in d icator s ym b ols. One curv e for the sym b ol a (p opulation density) is drawn as an ex- ample and lab eled “path of a in the vertic al series of ordinates,” the idea b eing that one could see d i- rectly to wh ic h crimes p opulation d ensit y was re- lated p ositiv ely (bigam y and d omestic violence) and negativ ely (arson and cattle theft). Starting at the left (rig ht) are t wo ot her smo othed curv es lab eled “curv e of p ositiv e (negativ e) coincidence.” An inset quotation from J. W. Hersc hel ( 1831 ) in a b o x at the top right sums up Guerry’s an ticipation of the utilit y of his metho d, and a ca veat : “Causes will v ery frequently b ecome obvi ous by a mere arrange- men t of our facts in the ord er o f intensit y , though not of necessit y , b ecause counterac ting or mod ifying causes ma y b e at the same time in action.” It should b e noted that Guerry in tended this only as a sp ecimen. He did not provi de an analysis of these data or the obvi ous parallel c hart for F rance, nor did he dra w conclusions ab out the many rela- tions b et ween crimes and these social and moral as- p ects. He states in the introduction t hat suc h dis- cussion will b e the su b ject of a subsequent b o ok, bu t this w as neve r published. This magnificen t vol ume, p ublished in 1864, had b een cro wned by the Acad ´ emie in 1860 and w as a w arded the Prix Mon t y on th e follo wing y ear ( Biena ym ´ e ( 1861 )). In Octob er of 1864, Guerry , who had b een made an h onorary mem b er of the S tatisti- cal So ciet y of Lond on (SSL), trav elled to En gland to attend the BAAS meetings in Bath at the invita tion of William F arr; president of the so ciet y , F arr had also b een instrumen tal in arr anging Guerry’s acc ess to the jud icial r ecords of England. The Statistique Mor ale de l’Angleterr e and its s plendid 17 plates w ere p ut on public disp la y for the nearly 2800 mem- b ers who attended, and b ecame the sub ject of a commen tary by W. Heywoo d, vice-presiden t of the SSL. GUERR Y’S MORAL ST A TISTICS OF FRANCE 15 Fig. 10. Guerry ’ s 1864 Plate 16: Influenc e of age. L eft: Ag e distributions for various crimes in England; right: in F r anc e. Source : Courtesy of Staatsbibliothek zu Berlin. The follo w ing August, while consulting the arc hiv es of the Hˆ otel d e Ville de Paris, Guerry suffered a strok e; he su rviv ed, bu t grew progressiv ely w eak er, and died on April 9, 1866 at age 64. S ome w ork on the am bitious analysis and in terpretation of the data for England and F rance w as con tinued and rep orted b y Diard ( 1866 ), who describ ed Guerry’s last wo rk as an atlas of crimin al ju stice comparable in scop e and b eaut y to the atl as of Berghaus ( 1838 ) on ph ys- ical geography o f the w orld . Guerry’s papers w ere donated b y h is heirs, Charles an d Andr´ e P oisson, to the So ci ´ et ´ e des Sciences, Arts et Belles-Lettres 16 M. FRIENDL Y Fig. 11. Guerry ’ s 1864 Plate 17: Gener al c auses of crimes. Source : Courtesy of Sta atsbibliothek zu Berlin. d’Indre-et-Loire; they ha v e not b een lo cated, if they y et survive. 10 10 In subsequent wo rk ( F riendly ( 2007c )) I ha ve determined that Guerry’s n otes and p apers concerning the 1884 vol- ume were entrusted to D iard. The Anna les de la So ci´ et ´ e. . . record comm unications by Diard (April, 1867 ; 1868 ) concern- ing a p ro ject to edit and publish some of these manuscripts, adopted by the S oci´ et´ e in 1869. This was never completed and n o trace of these works has been found in lo cal archiv es. GUERR Y’S MORAL ST A TISTICS OF FRANCE 17 Fig. 12. Pl ots of crimes against p ersons vs. li ter acy. L eft : Al l r e gions, with 68% data el li pse and lo ess smo oth. Right : R e gion differ enc es. D ´ ep artments outside the 90% data el lipse ar e identifie d in b oth p anels. It is inten tionall y hyperb olic for me to cal l the Es- sai the b o ok that launched mo d ern so cial s cience, and to tell the story of Guerry’s con tributions to statistic s and graphics, I hav e in ten tionally a v oided the issue of the priorit y d ispute with Quetelet, along with the con trib utions of others in F rance and Eng- land to what b ecame the “moral statistic s mov e- men t” in the m id dle and later part of the 19th cen- tury . Although his work w as certainly hon ored dur- ing his lifetime, his mo d est p ersonalit y and his p osi- tion as a ded icated amateur without high academic or so cial connections left h is accomplishment s some- what underappr eciate d outside of criminology . 3. MUL TIV ARIA TE ANAL YSES: D A T A-CENTRIC DISPLA YS As we ha v e seen, Guerry’s data consist of a large n umb er of v ariables recorded for eac h of the d ´ epartemen ts of F r ance in the 182 0–1830s and there- fore in vo lv e b oth multiv ariate and geographical as- p ects. In addition to historical in terest, these d ata How ever, the F ranco-Prussion war b egan in July , 1870 and these pap ers may hav e b een lost. I ronically , for the history of statistical graphics, Guerry’s work w as not the only casu- alt y of this war: Charles Joseph Minard, whose works I ha ve detailed elsewhere ( F riendly ( 2002 )), fled from P aris to Bor- deaux in September 1870, “carrying only one ligh t bag and some studies already b egun” ( Chev allie r ( 1871 ), page 22, D. Finley , trans.); these also ha ve b een lost. pro vide the opp ortunity to ask ho w mo dern meth- o ds of statistics, graphics, thematic cartograph y and geo visu alizati on can shed fu r ther ligh t on the ques- tions he raised. T o put it an other wa y , What could we do to d a y , if Guerr y arr iv ed as a consulting clien t at our do or and ask ed f or assistance in u n derstanding these data on moral statistics of F r ance? This section and the follo w ing are merely meant to b e s u ggestiv e of the kinds of exploratory , graphical metho ds that might b e of use. T o a v oid going too far afield, I m ake little attempt at mo deling these data here. Along the wa y , I try to suggest some sp ecific chal- lenges and opp ortunities for fur ther gro wth that these applications enta il. More generally , th ese examples call for great er in tegratio n of m ultiv ariate s tatisti- cal metho ds and data d ispla ys with spatially refer- enced analyses and d ispla ys. See W hitt, McM orris and W ea v er ( 1997 ) and Whitt ( 2007 ) for some at- tempts to construct m ultiv ariate and spatial mo d els addressing Guerry’s data and questions. The easiest approac hes to the questions Guerry raised simply treat his data as a m ultiv ariate sample and apply s tand ard analysis and visualiz ation m eth- o ds. In graph s we can represent geographic lo cation b y color co d ing or other visual attributes. This giv es data-cen tric displays in which the multiv ariate data are sho wn directly and geographic relations app ear indirectly . I do this in a spirit b oth of giving Guerry 18 M. FRIENDL Y a helping hand a nd a sking whether mo d ern meth- o ds can shed an y ligh t on the questions that Guerry en tertained. T o provide others the opp ortunit y to do the same and to issue this Guerry c hallenge pub- licly , the data from Gu err y ( 1833 ) and other sour ces, and base maps of F rance in 1831 are provided at www.math .yorku.c a/SCS/Gallery/guerry/ . 3.1 Biva riate Displa ys Ev en simple scatterplots can b e enhanced b y sho w- ing more (or less) than just the d ata to aid in- terpretation or pr esen tation of resu lts. Figure 12 sho ws t wo ve rsions of a plot of crimes against p er- sons against literacy that Guerry might ha v e found helpful in understanding and explaining the relation b et we en them. The left panel plots the data tog ether with a 68% data (concen tration) ellipse and a smo othed lo ess curv e to fo cus atten tion on the ov erall relation b e- t w een crime and literacy , and ask wh ether there is an y indication that this is nonlinear. T o highligh t particular d ´ epartemen ts that migh t b e unusual (as explained b elo w), observ ations relativ ely far f rom the cen troid are lab eled. Th e righ t panel sho ws sep- arate 68% data ellipses for eac h of the five regions of F rance together with ± 1 standard error crosses for the cen troid of eac h region. The data ellipse ( Monette ( 1990 ); F riendly ( 2007b )) of size c is d efined as the set of p oint s y whose squared Mahalanobis distance ≤ c 2 , D 2 ( y ) ≡ ( y − ¯ y ) ⊤ S − 1 ( y − ¯ y ) ≤ c 2 , where S is the sample v ariance–co v ariance mat rix. When y is (a t least appro ximately) biv ariate nor- mal, D 2 ( y ) has a large-sample χ 2 2 distribution with 2 degrees of freedom, so taki ng c 2 = χ 2 2 (0 . 68) = 2 . 28 giv es a “1 standard deviation biv ariate ellipse,” an analog of the standard univ ariate inte rv al ¯ y ± 1 s . The lab eled p oint s in Figure 12 are those for whic h Pr( χ 2 2 ) < 0 . 10. See F riendly ( 20 06 , 2007b ) for d etails and extensions of these ideas. 11 11 In particular, one should note that these n ormal- theory (first and second momen ts) summaries can b e dis- torted by multiv ariate outliers, particularly in smaller sam- ples. In principle, such effects can b e coun tered by us- ing robust cov ariance estimates such as multiv ariate trim- ming ( Gnanadesik an and Kettenring ( 1972 )) or the high- breakdow n b ound minimum volume ellipsoi d (MVE) and minim um co v ariance d eterminan t (MCD) metho ds devel- oped by Rousseeuw and others ( Rousseeu w and Leroy ( 1987 ); Rousseeu w and V an Driessen ( 1999 )). Often, these robust Th us, Guerry and his readers w ould ha v e b een able to see directly that o ve rall there is no linear relation b et we en crimes against p ersons and liter- acy , nor is there a ny hint of a nonlinear one. T h e d ´ epartemen ts that are lab eled w ould h a v e serv ed to highligh t the discussion alo ng the lines that Guerry c hose, for example, the Ari` ege is near the b ottom on crime and also on literacy , while Ind r e stands about the same on literac y , but is near the top on p ersonal crime. The right panel, h ighlighti ng region differences, sho ws a n umb er of th ings that Guerry did not ob- serv e (or commen t on). F or example, most of the v ariation b et w een regions on these v ariables is due to the difference b etw een the cent er and west vs. north and east on literacy , but these regional differ- ences on crime are very small. The south of F rance stands out as b eing quite low on b oth of these v ari- ables, and , moreo v er, the within-region co v ariatio n is p ositiv e. Here, the Ari` ege do es not stand out as b eing particularly unusual for the south of F rance. As m en tioned earlier, in his last work Guerry ( 1864 ) attempted to come to grips with asp ects of the mul- tiv ariate relations among moral v ariables. W ere he around to da y , h e w ould s u rely find scatterplot ma- trices of in terest, so w e ha v e p repared one for his insp ection. Fig ur e 13 shows a n umber of int eresting relations: There is in fact a mo derately p ositiv e rela- tionship b et ween p ersonal crime and prop erty crime for F r ance as a whole, apparent ly con tradicting h is claim that they are n egativ ely r elated. Th ere are also negativ e, and p ossibly nonlinear, r elations b e- t w een literacy ( x ) and prop erty crime, s u icides, and c hildren b orn out of wedlock, and so forth . The neg- ativ e r elatio n b et ween s u icide and p ersonal crime that Guerry clai med is there, but rather w eak; he migh t also b e surprised by the p ositiv e relation b e- t w een suicide and prop erty crime. Ho w ev er, Fig ure 13 , lik e an y other graph, sho ws some features of the data and hides others. I n partic- ular, as w e sa w in Figure 12 , there are large r egional differences in some of these measur es wh ic h help to explain some apparent find ings for the total sample. 3.2 Reduced-Rank Displa ys Visual sum maries, such as the d ata ellipse and lo ess smo oths, used w ithin a scatterplot as in Fig- ure 13 , ma y sho w quite effectiv ely the relations method s supply w eights t h at can be used to “robustify” other multi v ariate metho ds and v isualizatio n techniques, b ut this integ ration in applied softw are is still quite sp otty . GUERR Y’S MORAL ST A TISTICS OF FRANCE 19 Fig. 13. Enhanc e d sc atterplot matrix for crimes against p ersons, crimes against pr op erty, li ter acy, suicides, childr en b orn out of we d lo ck (infants natur el les) and donations to the p o or. Each p anel plots the r ow variable on the vertic al against the c ol um n variable on the horizonta l. among a reasonably large num b er of v ariables. Y et there are ev en b etter met ho d s for display of com- plex, high-dimensional data. 3.2.1 Bi plots. Among these, the biplot ( Gabriel ( 1971 ), 1981 ) m ust rank among the most generally useful. Biplots can b e regarded as th e multiv ari- ate analog of scatterplots ( Go w er and Hand ( 1996 )), obtained by p r o jecting a m ultiv ariate sample in to a lo w-dimensional space (t ypically of 2 or 3 dimen- sions) accoun ting for the greatest v ariance in the data. The (symmetric) scaling of th e b iplot used here is equiv alen t to a plot of p rincipal comp on ent scores for the observ ations (sh own as p oin ts), to- gether with principal comp onent co efficien ts for the v ariables (shown as vect ors) in the same 2D (or 3D) space. When there are classification v ariables dividing th e obs erv ations int o groups, we may also o v erla y data elli pses for th e scores to pro vide a lo w - dimensional visu al su m mary of differences among groups in means and co v ariance matrices. F or example, Figure 14 sho ws a 2D biplot of Guerry’s six quan titativ e v ariables. In this plot, (a) the v ariable v ecto rs hav e their origin at the mean on eac h v ariable and p oin t in the direction of p ositiv e deviations from the mean on eac h v ariable (more is b etter); (b) the angles b et we en v ariable v ecto rs 20 M. FRIENDL Y Fig. 14. Biplot of Guerry ’ s six quantitative mor al variables, with 68% data el lipses for r e gions, dimensions 1 and 2. T o avoid overplotting, d´ ep artements within their el lipse ar e lab ele d by numb er r ather than name. p ortra y the correlati ons b et wee n them, in the sense that the cosine of the angle b et ween an y t w o v ariable v ectors appr oximat es the correlation b et ween those v ariables (in th e reduced space); (c) th e orthogonal pro jections of the observ ation p oin ts on the v ari- able v ectors show ap p ro ximately the v alue of eac h observ ation on eac h v ariable. (These in terpretations assume that the axes are equated, so that a unit data le ngth has the same physic al length on b oth axes in the plot.) The t w o dimensions account for 35.4% and 20.8%, resp ectiv ely , of the total v ariance of all measures. The total, 56.2%, is relativ ely lo w, reflecting the generally small correlations among these moral v ari- ables. Neverthel ess, a n umb er of interesti ng features ma y b e read from this plot. The fi rst dimension, aligned mainly w ith literacy on one sid e and sui- cides on the other is largely the distinction b et w een F rance obscur e and F rance ´ eclair ´ ee, with the North and East higher on literacy th an the other regions. Seine (consisting essen tially of Paris) stands out as particularly high on lite racy , w hile Creuse, Ha ute- Loire and V end ´ ee are particularly high on pr op ert y crime, suicides and infants natur el les . The second dimension might b e describ ed as “b enev olence,” con trasting p ersonal crime against donations to the p o or, with C orsica standing out as the most extreme on b oth. Guerry do es not suggest an y comfort from the kno wledge that getting robb ed in C orsica migh t b e offset by gifts to c haritable es- tablishmen ts, but he does note from his map that most of the donations to the p o or are found to the southeast of a line from Cˆ ote d’Or to Ari ` eg e and that “if Cors ica is excluded, one encount ers the great- est contributions to the p o or in those d ´ epartements where the Catholic clergy is most widespread and where crimes against p ersons are at the same time most common” Guerry ( 1833 , page 114, WR trans.). GUERR Y’S MORAL ST A TISTICS OF FRANCE 21 3.2.2 Canonic al discriminant plots. If instead of accoun ting for v ariation among all the d´ epartemen ts, w e ask what low-rank view sh o ws the greate st differ- ences among regions of F rance, we are led to ca non- ical d iscriminan t (CD) plo ts (( F riendly , 1991 , Sec- tion 9 .5.2)). This metho d plots s cores for th e d ´ epartemen ts on linear com binations of the v ari- ables whic h maximally discriminate among the group mean v ectors, in the sense of giving the largest p ossi- ble un iv ariate F statistic. It is equiv alen t to a canon- ical correlation analysis b et w een the set of resp onse (moral) v ariables and a set of d ummy v ariables rep- resen ting group membersh ip (regio n). The CD p lot for Guerr y’s data is sho w n in F ig- ure 15 . Similar to the biplot, w e hav e added v ariable v ectors wh ose angles with the axes indicate the cor- relation of eac h v ariable with the canonical dimen- sions to aid in terpretation. Th e length of eac h v ari- able vect or is then pr op ortional to its contribution to discriminating among the means for the regions of F r ance. Because the canonical v ariates are un- correlated, confidence ellipses for the means of eac h Region plot as circles ( Seb er ( 1984 )). Here w e c an accoun t for o ve r 90% of the differ- ences in the means of regions in tw o dimensions. Th e first dimens ion is most highly correlated with liter- acy and suicide, b ut the latter distinguishes most among the regions. The configuration of the regions largely reflects F rance obscure vs. F rance ´ ecl air ´ ee. Along the sec ond dimension, the m eans for region are correlated so that donations to the p o or and p ersonal crime correlate p ositiv ely , and the south of F rance d iffers most from the w est. 3.2.3 Gr aphic al chal lenge: lab ele d sc atterplots. In a n umber of historical studies and r eviews ( F riendly ( 2005 ); F riendly and Denis ( 2005 ); F riendly ( 2007a )) I h av e b een struc k b y what may b e learned in the pro cess of working with old data in a m o dern con- text, a topic I call statistic al historio gr aphy . In this connection it is useful to co mment on one s p ecific c hallenge faced here in attempting to create the plots sho wn so far in this section with mo d ern soft w are. Although Guerry w as, throughout his career, fun- damen tally concerned with r elations among moral v ariables, he nev er thought to dra w a scatte rp lot, b ecause this graphical form as such wa s not inv en ted unt il 1833 ( Hersc hel ( 1 833 )) and did n ot enter com- mon u se un til after he had died ( F r iendly and Denis ( 2005 )). But he alw ays w an ted to in terpret fi n dings in relation to the p h ysical and s o cial geograph y o f F rance. The identit y of d ´ epartemen ts in the map of F rance was at least implicit ly kn own to Guerry’s readers; in any case, h e pro vided a legend. In a scat- terplot, he w ould ha v e wa nte d to iden tify the p oin ts and wo uld ha v e carefully p ositioned the names b y hand to maximize legibilit y . In Figure 12 , I c hose to label only those p oints out- side the 9 0% data ellipse to hig hlight t hose d ´ epartemen ts that were at ypical in the relation b e- t w een prop erty crime and literacy . In a static graph, this must b e d one by programming; int eractiv e graphic softw are allo w s identificat ion by mouse clic ks. P erhaps y ou did not notice w hat was missing, but Guerry certainly w ould ha ve. The initial ve rsion of the biplot (Figure 14 ) la- b eled all p oint s with the d ´ epartemen t name, but man y of these w ere obscured due to ov erp lotting. In the ve rsion shown here, the lab els were thin n ed b y replacing names b y d ´ epartement n umbers within the data ellipse for eac h region; this is b etter visu- ally , but requires lookup (see the App end ix ). The C D plot in Figure 15 w as a great er chall enge, b ecause I felt it w as imp ortant to iden tify all the d ´ epartemen ts directly . In the end, I carefully ad- justed graphic parameters, but then hand-edited the P ostScript figure to redu ce occlusion. There h a v e been a v ariet y of pr op osals for more automatic wa ys to lab el a m aximum n umber of p oin ts in a plane (scatt erplot or map) with minim um o ver- lap, in the psyc hometric and statistical graphic liter- ature (e.g., Kuhfeld ( 1991 ), 1994 ; Noma ( 1987 )), in cartograph y (e.g., Hirsc h ( 1982 )), compu ter science and graphic information systems (e.g., v an Krevel d, Strijk and W olff ( 1999 )). An exte nsive map-lab eling bibliography ( W olff and Strijk ( 1996 )) no w lists o v er 300 references on this topic. As f ar as I kno w, n one of these is imp lemen ted in commonly a v ailable statistical softw are, except for Kuhfeld ( 1994 ) in SAS and the R function thig maphobe.l abels in the plotrix pac k age ( Lemon et al. ( 2007 )). 3.3 HE plots for Multivariate Linea r Mo dels I close this section with one more displa y that relates to Guerry’s aspirations in 1864 to address the multi v ariate relations of crime with other moral and p opulation charac teristics. Figure 16 is based on a scat terplot of crimes against p ersons and prop ert y corresp onding to the p anel in r o w 1, column 2 of Figure 13 , with p oints outside a 95% data ellipse iden tified by d ´ epartement name. 22 M. FRIENDL Y Fig. 15. Canonic al discriminant plot for Guerry ’ s six quantitative variables. Ci r cles show 99% c onfidenc e r e gions for the r e gion me ans; variable ve ctors indic ate the c orr elation of e ach variable with the c anonic al dimensions. This is ov erlaid with an hyp othesis–error (HE) plot ( F riendly ( 2006 ), 2007b ; F o x et al. ( 2007 )) that pro vides a compact visual sum mary of the hyp oth- esis (H) and error (E) cov ariati on in the m ultiv ari- ate linear mo d el, Y = X B + E . Here w e are fitting p opulation p er crime against prop ert y and p ers ons to the region factor and the qu an titativ e effects of suicides, literacy , donations, infan ts and weal th. 12 In R/S-Plus notation, this is 12 I am using this simply as an example here, rather than a full-blow n attempt to mod el crime in relation to all of Guerry’s moral v ariables. In particular, it can b e argued th at crimes should b e expressed as the reciprocals of Guerry’s me a- sures, giving rates per unit population as is commonly done today . Whitt, McM orris and W ea ver ( 1997 ) pro vided analy- ses of a series of univ ariate linear models for most of Guerry’s moral v ariables and discussed these in relation to so cial th eory and Guerry’s findings. As in the present example, t h ese use ordinary least sq uares method s which ignore the spatial aut o- correlatio n (e.g., Anselin and Bera ( 1998 )) of residuals surely guerry.m od <- lm( cbind (Crime_p rop, Crime_pe rs) ~ Region + Suicides + Literacy + Donations + Infants + Wealth) This mo del yields an R 2 of 0.43 for prop erty crime and 0.36 for p ersonal crime, and giv es the multi v ari- ate analysis of v ariance (MANO V A) test statistics b elo w. The HE plot provides a d irect visualization of the size and nature of these effects. In Figure 16 , the error ellipse is the 68% data el- lipse of the b iv ariate residuals ( E ) divided b y t he error degrees of fr eedom ( n − p ) and cen tered at present in such geographical data. A recen t paper by Wh itt ( 2007 ) applied a v ariet y of spatial regressio n mod els and visu- alizatio ns to examine the relatio n b etw een crimes of violence and suicides. Y et anoth er chall enge is the extension of these method s to multiv ariate linear mo dels. GUERR Y’S MORAL ST A TISTICS OF FRANCE 23 Fig. 16. HE plot for the multivariate line ar mo del fitting r ates of crime to r e gion and the c ovariates suicides, l iter acy, donations, infants and we alth. The black, solid el lipses (and de gener ate lines) show the (c o)variation of the hyp othesize d pr e dictor effe cts r elative to the r e d, dashe d err or (E) el lipse. They have the pr op erty that they pr otrude b eyond the E el lipse iff the hyp othesis c an b e r eje cte d by the R oy maximum r o ot test. > Manova(guerr y.mod, test="Roy") Type II MANOVA Tests: Roy test statistic Df test stat app rox F num Df den Df Pr(>F) Region 5 0.6859 10.2 878 5 7 5 1.554e-0 7 *** Suicides 1 0.1437 5.3170 2 74 0.00695 7 ** Literacy 1 0.0361 1.3354 2 74 0.26932 8 Donations 1 0.0336 1.2444 2 74 0.2940 59 Infants 1 0.0091 0.3385 2 74 0.71392 3 Wealth 1 0.1479 5.4719 2 74 0.00607 7 ** --- Signif. codes: 0 ’***’ 0.001 ’**’ 0.01 ’*’ 0.05 ’.’ 0.1 ’ ’ 1 the grand means, to pu t it on the same scale as the data. The E ellipse th us repr esen ts the partial co v ariation b et we en th e crime rates, con trolling for the m o del effects. The orie nta tion of the E elli pse indicates that crimes against p ers ons and prop ert y are s till p ositiv ely related after adjusting for those effects. Its shadows on the axes are p rop ortional to the residual standard errors on the data scale. Eac h p redictor effect is sho wn as the biv ariate H ellipse for the Typ e I I su m of squares and cross- pro du cts matrix ( SSP H ) u sed in the corresp ond ing m ultiv ariate test. F or a 1 df hyp othesis, such as the fiv e quan titativ e regressors, the SSP H is of rank 1 and the H “ellipse” collapses to a line. The H el- lipses ha v e all b een scaled to p rotrude outside the E ellipse iff the corresp ondin g Roy maxim um ro ot test is significant at a con ve ntio nal α = 0 . 05 lev el. [This scaling is p r o duced by dividing SSP H b y λ α ( n − p ), where λ α is the critical v alue of Ro y’s statistic for a test at lev el α .] T hus, the directions in whic h the h yp othesis ellipse exceed the error ellipse are infor- mativ e ab out h ow the resp ons es depart significantly from H 0 . 24 M. FRIENDL Y Quite a lot can b e read from this plot. It is far less detailed (and hop efully more compr ehensible) than Guerry’s ( 1864 ) Gener al Causes of Crimes (Figure 11 ), but attempts to address similar issues of m ultiv ariate relations. Regio n d ifferences are partic- ularly large in p ersonal crime, b ut n ot s o in prop ert y crime (cont rolling for the regressors). Suicide and w ealth (a ranked ind ex based on taxes on p ers onal and mo v able prop ert y p er inhabitan t) are strongly related to crimes against prop ert y , but not to crimes against p ersons. In this mo del literacy , donations to the p oor and infan ts are not individually significant predictors of crime, although their predicted effects are p ositiv ely related to eac h other. The v ariatio n in the region m eans on the crime v ariables ma y b e read d irectly , as noted earlier, and the six at ypi- cal d´ epartemen ts identified b y p oint labels can also b e und ers to o d in relat ion to the plots we ha v e seen ab o v e. 4. MUL TIV ARIA TE MAPPING: MAP-CENTRIC DISPLA YS Compared with the data-cen tric displays just re- view ed, the cartographic displa y of m ultiple ph e- nomena s imultaneously , called multivariate mapping , has th e adv an tage of p reserving geospatial con text, but creates its o w n difficulties and c hallenges. These include: (a) ho w to enco de m ultiple v ariables in a ge- ographic unit for different pu rp oses (readabilit y , ex- ploring r elatio ns among v ariates, detecting u nusual patterns); (b) ho w to r elate maps to mo del-based summaries; (c) ho w to show indicators of v ariabil- it y , u ncertain t y or data qualit y . I illustrate just a few metho ds b elo w , 13 simply to illustrate some curr ent tec h niques, d iscuss their limitations and encour age others to do b etter. 4.1 Star Maps Multiple v ariables can b e displa ye d together on a single m ap in a v ariet y of wa ys (e.g., Slo cum et al. ( 2005 )) bu t most of these fall in to t wo main cate- gories: either the separate v ariables are assigned to differen t visual attributes of a glyph or p oint symbol [e.g., angle and length of r ays, heigh t and width of 13 The d´ epartemen t and region bound aries for th e base map used in these displays were created starting with a mo dern map of F rance, with d´ epartements merged or d eleted to adjust it to that in 1830. The map files in v arious formats are av ail- able on the companio n w eb site for this articl e. D´ epartement names, numbers and regions are listed in the App endix . rectangles, facial features in faces symb ols ( Chernoff ( 1973 )) and s o forth], or they are com bined into more inte gral forms, su c h as when tw o v ariables are represen ted by shades of t wo complemen tary colors o v erla y ed (e.g ., by additiv e or sub tr activ e mixing) to determine the shading col or of eac h regio n ( T rumbo ( 1981 )). Among the former class, ray glyph s or star sym b ols (radial lines p ositioned around a circle, eac h of length prop ortional to a giv en v ariable) are widely used and can b e used for an y num b er of v ariables. Figure 17 shows t w o v ersions of a star map for Guerry’s main v ariables designed f or differen t pur- p oses. In graphics it is alw ays true that details mat- ter, b ut this is particularly true for displa ys lik e this, where there are man y c h oices, not all of them ob- vious. The order of the v ariables around the circle greatly affects the kinds of shap es th at app ear. Here, w e wan t to use the information ab out correlations among v ariables to simplify the shap es, so the v ari- ables w ere ordered according to their angular p osi- tions in the biplot (Figure 14 ), follo wing the princi- ple of correlat ion effect ordering ( F riendly and Kwan ( 2003 )). Seco nd , scaling and orienta tion of the v ari- ables matter in determining the relativ e size and shap e of the s tars. Here, Guerry’s v ariables, scaled so that large r num b ers reflect b etter outcomes, w ere first con verted to ranks and the ranks were assigned to the lengths of the ra ys in suc h a wa y that bigger also corresp onds to a b etter or more moral result on eac h v ariable. T h us, d´ epartemen ts with b etter outcomes on all measures are sho wn as larger stars. If one w an ted to fo cus on the d´ epartemen ts with w orse outcomes, enco ding r a y length by rev erse rank w ould b e m ore appropriate. Finally , th e star glyphs may b e colored to reflect some other asp ect or extended in other wa ys. In Fig- ure 17 w e fo cu s on the comparisons across regions of F rance. T he figure at the righ t shows a schemat ic summary of the distributions within eac h regio n us- ing o v erlaid star glyphs to s ho w the median, low er quartile (white) and upp er qu artile (grey) , a kind of simple m ultiv ariate b oxplot glyph (sho wing only the middle 50% of eac h d istrib ution). Alternativ ely , if we w an t to capture statistical c haracteristics of the profile f or eac h d ´ epartement , w e migh t use colo r to encode the mean moral rank (reflect ed by size of eac h glyph) or the standard deviation of the ranks (reflected b y eccen tricit y of the shap e), as is done in Figure 18 . In such figures, it will b e seen that it is the con- figural prop erties of size and s h ap e that attract the GUERR Y’S MORAL ST A TISTICS OF FRANCE 25 ey e; individu al v ariables can b e read, with a bit of effort and aid of the v ariable ke y . Figure 17 (b) pro- vides a relativ ely compact su mmary of the differ- ences among regions on all v ariables sim ultaneously . In the plots showing individual d´ epartemen ts, Cor- sica stands out b ecause it is very bad on crime, b u t relativ ely high on other v ariables; in the north, re- gions aroun d P aris [Seine (75), Yv elines (78) and Marne (51)] are all small and similar in shap e, re- flecting high literacy , b ut relati ve ly lo w on all other v ariables; in the ea st, most d´ epartemen ts a re rela - tiv ely large, with the exceptio n of Drˆ ome (69); in the cen ter, most d ´ epartemen ts are relativ ely go o d on all v ariables except literacy; in the south, most Fig. 17. Star maps of Guerry ’ s data, using r ays pr op ortional to the r ank of e ach variable (longer = b etter ). V ariables have b e en or der e d ac c or ding to their angular p ositions in the biplot (Figur e 14 ). L eft: Glyphs for individual d´ ep artements. Right: Multivariate b oxplot glyphs for the me dians and quartiles acr oss d ´ ep artements in e ach r e gion of F r anc e. Fig. 18. Using c olor for other enc o dings. Le ft: M e an r ank; right: standar d de viation of the r anks. D´ ep artments that ar e unusual ly high or low on e ach me asur e ar e identifie d by d´ ep artement numb er. 26 M. FRIENDL Y d ´ epartemen ts are relativ ely p oor on a num b er of v ariables, particularly d onations to the p o or, and Bouc hes-du-Rhone (13), w hose main cit y is Mar- seilles, and Loz ` ere (48) stand out as particularly lo w. These displa ys are necessaril y quite complex, but they p ack age a lot of information. It wo uld b e of in terest to kno w what Guerry w ould mak e of them. 4.2 Red–Green–Blue Blended Color Maps A v ariet y of schemes can b e used to com bine t wo or more v ariables in bi-, tri- or multiv ariate c horo- pleth maps in more in tegral w a ys. When color is used, it is most conv enient, b oth conceptually and computationally , to us e v arious m etho ds to b lend or inte rp olate comp osite colors in r ed–green–blue (R GB) color space, ev en though it is wel l known that R GB colors are neither p erceptually uniform (e.g., in br igh tness) nor p erceptually linear. F or the presen t purp oses, the simplicit y of RGB blending is sufficien t to con ve y the main ideas. Thus, for three v ariables, x 1 , x 2 , x 3 , we use the col or mapping func- tion, C ( x 1 , x 2 , x 3 ) 7→ rgb( x i , x j , x k ) for i, j, k some p ermutat ion of 1, 2, 3. See Ihak a ( 2003 ) for a dis- cussion of alternativ e color spaces from a statistical p ersp ectiv e. Figure 19 sho ws a triv ariate R GB map of crimes against p ersons, crimes against prop erty and liter- acy , using a li near scale t o m ap eac h v ariable int o 0–100 % of th e color indicated in the legend. 14 The color combinatio ns of th e d ´ ep artements form a rather wide r ange of the sp ectrum and are relativ ely easy to in terpret, remem b erin g that more is b etter for eac h v ariable. Thus, d ´ epartement s w here literacy is high are shaded in blues and purp les, and more blue to the exten t that crime r ates are lo w; the north of F rance is primarily in this catego ry . Those that ha ve high v alues for b oth p op u lation p er crime v ariables (lo w crime rate) but are lo w in literacy are colored y ello w, suc h as Cr euse (23) and Ain (1). C orsica, with relati ve ly lo w v alues for p opulation p er crimes (high crime rates), but mo derately high literacy is shaded bluish. 14 It is difficult to indicate all possible three-v ariable color blends compactly . The actual colors plotted correspond to color blends calculated contin uously by linear interpolation. The legend in Figure 19 uses trilinear co ordinates to show the colors corresponding to r elative amounts of red, green and blue; thus vectors of (0.25, 0.25, 0) and (0.75, 0.75, 0) b oth map to yello w in the legend, but app ear differently in the p lot. This scheme for color-blended choroplet h maps ma y b e extended to m ore than three v ariables by use of rank-reduction te c hn iques. One simple idea is to use p r incipal comp onent s or factor analysis to obtain scores for eac h d epartmen t on three comp o- nen ts or factors, to w hic h color blend ing is applied. T able 1 sho ws th e r esult of a p r incipal comp onen t analysis follo w ed b y v arimax rotation for G uerr y’s six moral v ariables, w ith tent ativ e lab els for three factors. 15 Applying these weig hts to the v ariables giv es scores for e ac h d´ epartmen t on the t hr ee uncorrelated di- mensions, F 1 , F 2 , F 3 . T h us, F 1 will b e large wh en the r ates of prop erty crime, illegitimate births and suicides are lo w; from Figure 13 it ma y b e seen that these are all in v ersely related to literacy . F 2 relates p ositiv ely mainly to donations to the p o or, and F 3 is an ind ex of crime, most heavil y weigh ted on p er- sonal crime. The color mapping fun ction C ( F 1 , F 2 , F 3 ) 7→ rgb( F 1 , F 2 , F 3 ) then pro d uces Figure 20 . Th e north– south distinction is again eviden t, with shades of blue in most of the north going to wa rd reds and purples to th e south. A num b er of d´ epartemen ts stand out in relation to their neigh b ors. These are all d´ epartemen ts that app ear as outliers for their re- gions in the biplot (Figure 14 ): Calv ados (14), Cor- sica (200), Creuse (23), Haute-Loire (43) and V end ´ ee (85). 4.3 Conditioned Chorople th Ma ps In spatial data analysis, inte rest is often fo cused on one or t wo main geographic indicators, b ut it is 15 In an u nrotated principal comp onents solution, th e w eights for vari ables are identical to those shown in the b iplot (Figure 14 ). T able 1 R otate d c omp onent lo adings for thr e e-factor RGB blending; c omp onent weights less than 0.30 ar e not shown F actor 1 F actor 2 F actor 3 V ariable Civil so ci e ty Moral v alues Crime P op. p er crime against p ersons 0.97 P op. p er crime against prop erty 0 . 75 0.39 P ercent read & write − 0 . 72 P op. p er illegitimate birth 0 . 62 0.42 Donations t o the po or 0.89 P op. p er suicide 0 . 80 . GUERR Y’S MORAL ST A TISTICS OF FRANCE 27 Fig. 19. RGB map of crimes against p ersons, crimes against pr op erty and liter acy. The le gend shows the mapping of c olors to the variables and the c ombinations that r esult fr om RGB blending in triline ar c o or dinates (indic ating the relative amounts of R, G and B). desired to see ho w this change s or v aries spati ally when other, bac kground v ariables are controll ed or accoun ted for. Th is is certainly tru e for Guerry’s data, where the main fo cus is on rates of crime and one w ould lik e to con trol for p oten tial p r edictors suc h as literacy or economic conditions. One conceptually s imp le appr oac h is to fit a mo d el using the backg roun d v ariables as predictors and then d ispla y the residuals on a map. Th en, h o w ev er, the backg round v ariables are remov ed from th e map displa y as w ell as from the resp onse; w e see only the deviation of the v ariable of int erest from its exp ec- tation under a particular mo del. An attrac tiv e alter- nativ e is to use the predictors as conditioning v ari- ables, sp litting the geographic units into su bsets and sho wing the resulting set of maps in a coheren t mul- tipanel displa y . This m etho d, called a c onditione d chor opleth map ( Carr, White and MacEac hren ( 2005 )), th us pr o vides a map-based analog of coplots or trel- lis displa ys ( Clev eland, Grosse and Shu ( 1992 ); Clev eland ( 1993 )) that hav e pro v ed useful for simi- lar graphic analysis of nonspatial data. In a basic conditioned c horopleth map (CC map), t w o p oten tial pred ictor (“giv en”) v ariables, x and y , can b e used to allo cate the geographic regions (d ´ epartemen ts, here) into cells in a t wo-w ay table of size n x × n y using either nonov erlapping or o v er- lapping ranges (called shingles ). The CC map is then an n x × n y arra y of choropleth maps of the resp onse v ariable for just those regions in eac h cell; for conte xt, other regions are also shown, but with a bac kground color. An in teractiv e imp lemen tation of CC maps by Dan Carr and Y uguang Zhang ( www.galaxy .gm u.edu/˜dcarr/ccmaps ) pro vides d y- 28 M. FRIENDL Y Fig. 20. R e duc e d-r ank R GB m ap of Guerry ’ s main mor al variables. namic selection of the conditioning inte rv als and the color cod ing of the resp onse lev els via sliders. Figure 21 sho ws an example of a static displa y of prop ert y crime, conditioned on literacy and eco- nomic w ealth (measured as the rank order of taxes on p ersonal prop ert y p er inhabitan t, where 1 is the maxim um, 86 is the minim u m). Both conditioning v ariables we re divided in to t w o shingles, allo wing 10% o v erlap for eac h . Crime rate, expressed as p op- ulation p er p ersonal crime, is shown b y a bip olar (div erging) color scheme based on cutting the com- plete distribution of p ersonal crime at p ercenti les from 20 to 80 in steps of 10 and using shades of red or blue to d enote, resp ectiv ely , higher or lo w er lev els of crime. 16 F or eac h panel, the marginal y el- 16 Although crime is a unip olar v ariable, it seems more use- ful to use a diver ging bip olar color scale here to focus attention on regions that are higher or low er than a verage. Use of red lo w bars sho w the v alues of literacy and wea lth used in that conditional map, w ith lengths prop ortional to th e p ercen t of d´ epartemen ts falling into eac h in- terv al. Annotations in the u pp er left corner of the panel sho w the median crime rate and n umb er of d ´ epartemen ts repr esen ted in that panel. The in terpretation of Figure 21 is as follo ws. Th e upp er righ t p anel sh o ws the d ´ epartemen ts where literacy is high and w ealth is high (small ranks); except fo r a few, these are m ainly in the n orth of F rance. But, as Guerry concluded, these are, para- do xically , largely the d´ epartemen ts in whic h there are the greatest num b ers of crimes, as can b e seen b y the n umb er shaded red. Con v ersely , the lo w er left panel sho ws the d´ epartemen ts w here literacy is low and we alth is lo w, whic h are all found in F rance ob- for “high risk” v s. blue for “low risk” is conve ntional in areas where CC maps are used. GUERR Y’S MORAL ST A TISTICS OF FRANCE 29 Fig. 21. Conditione d chor opleth map for p opulation p er crime against pr op erty, str atifie d by liter acy (%) and we alth (r ank, 1 = b est). F or e ach quadr ant, only those d´ ep artements in the i ndic ate d r anges of liter acy and we alth ar e shade d. Shading levels c orr esp ond to p er c entiles of crime, f r om 20 to 80 i n steps of 10, with r e d indic ating hi ghest crime and blue indic ating lowest . scure. Here, rate of prop erty crime is relativ ely lo w, particularly in the cen ter of F rance (shaded blue). Note that the 2 × 2 CC map displa y is a geo vi- sual represen tation that m igh t b e associated with a t w o-w a y analysis of v ariance or with a t wo-predictor regression mo d el if literacy and wea lth are treated as quantit ativ e v ariables. In a r egression of prop erty crime on literacy and wealt h, the R 2 is a resp ectable 0.27. Ho w ev er, the standard disp lays asso ciated w ith suc h mo dels seem less useful than CC m aps here. F or example, Figure 22 sho ws b oth the predicted v alues and the residu als for this mo del. The predicted v al- ues are largely in terpretable as sho wing higher crime in th e north as we sa w b efore, but the residuals do not ha v e any ob vious int erpretations. Moreo ve r, the con text p r o vided by the lev els of literacy and w ealth in the CC map is lost. 5. SUMMARY AND CONCLUSIONS The ma jor goal of this pap er was to suggest th at Andr´ e-Mic hel Guerry deserv es greater recogniti on in the history of statisti cs and data visualizatio n than h e is generally accorded. The 1833 Essai br ok e new ground in thematic cartograph y and statistic al graphics, and established the qu antita tiv e study of 30 M. FRIENDL Y Fig. 22. Fitte d values and r esiduals fr om a r esp onse surfac e r e gr ession pr e dicting p ersonal crime fr om liter acy and we alth. D´ ep artments wi th “ outside ” r esiduals in a b oxplot ar e lab ele d. moral statistics that ga v e rise to mo dern so cial s ci- ence. His 1864 comparativ e stud y of England and F rance con tains graphic d ispla ys that r ank amo ng the b est statistica l graphics pro d u ced d u ring what I hav e called the Golden Age of Graphics ( F riendly ( 2007 a )); as I su ggested, this study con templated ideas of m ultiv ariate explanation well b ey ond the- ory and metho ds a v aila ble at the time. Y et, as I ha v e also tried to suggest, his qu estions, metho ds and data still presen t c h allenges for multi- v ariate and spatial visu alizat ion tod a y . In particular, what b egan in Guerr y’s time as thematic cartog- raphy and t he first instances of modern statistical maps has p rogressed to what is now called geo visual- izatio n (e.g., Dyk es, MacEac hren and K raak ( 2005 )) and exploratory sp atial data analysis (ESD A), often pro viding multiple link ed univ ariate views of geospa- tial data. Ov er the same p erio d , stat istical analy- sis d evelo p ed to encompass multiv ariate mod els and graphic displa ys, but the in tegration of these data- cen tric m ultiv ariate metho ds with map-cen tric visu- alizat ion a nd analysis is still incomplete. Who w ill rise to Guerry’s c hallenge? APPENDIX: REGIONS AND D ´ EP ART EMENTS OF FRANCE IN 1830 As noted earlier, the data from Guerry ( 1833 ) used in this article, together with map files in v arious formats, ha v e b een made a v ailable at http://w ww.math. yorku.ca/SCS/Gallery/guerry/ . In addition, it ma y b e useful for the reader to hav e a table listing the names and n umb ers of the d ´ epartemen ts of F rance in 1830, as I ha v e u s ed them in my analyses. Corsica, often an outlier and orig- inally d´ epartemen t 20, w as sub divided into Haute- Corse (2A) and Corse-du-Su d (2B) in 1975, bu t is listed in all m y fi les as 200. A CKNO WLEDGMENTS This work is supp orted by Grant 8150 fr om the Natural Sciences and Engineering Researc h Council of Canada. I am grateful to Gilles P alsky , who initi- ated my in terest in Guerry with the gift of images of his maps. V arious friends and colleagues, including Jacques Borow czyk, Antoi ne de F alguerolles, Chris- tian Genet and Ian Sp ence, help ed me correct errors and otherwise strengthen the initial draft, as d id the editor and three anon ymous review ers. REFERENCES Anonymous (1833 ). Guerry on the statistics of crimes in F rance. W estminster R eview 18 353–3 66. Anselin, L. and Bera, A. (1998). Spatial dep endence in linear regression mo dels with an introduction to spatial econometrics. In Handb o ok of Applie d Ec onomic Stat istics (A. U llah and D. Giles, eds.) 237–289 . Dekker, New Y ork. GUERR Y’S MORAL ST A TISTICS OF FRANCE 31 Region D´ epartment (#) Cen tral Allier ( 3 ), Cantal ( 15 ), Cher ( 18 ), Corr` eze ( 19 ), Creuse ( 23 ), Eure-et-Loire ( 28 ), Indre ( 36 ), In dre-et-Loire ( 37 ), Loir- et-Cher ( 41 ), Loire ( 42 ), Haute-Loire ( 43 ), Loiret ( 45 ), N i ` evre ( 58 ), Puy-de-Dˆ ome ( 63 ), Sarthe ( 72 ), Haute-Vienn e ( 87 ), Y onne ( 89 ) East Ain ( 1 ), Basses -Alp es ( 4 ), Hautes-Alpes ( 5 ), Aub e ( 10 ), Cˆ ote-d’Or ( 21 ), Doubs ( 25 ), Drome ( 26 ), Is` ere ( 38 ), Jura ( 39 ), Haute-Marne ( 52 ), Meurthe ( 54 ), Bas-Rhin ( 67 ), Haut-R h in ( 68 ), Rhˆ one ( 69 ), H aute-Saˆ one ( 70 ), Saˆ one-et- Loire ( 71 ), V osges ( 88 ) North Aisne ( 2 ), Ardennes ( 8 ), Calv ados ( 14 ), Eure ( 27 ), Manc he ( 50 ), Marne ( 51 ), Meuse ( 55 ), Moselle ( 57 ), Nord ( 59 ), Oise ( 60 ), Orne ( 61 ), Pa s-de-Calais ( 62 ), S eine ( 75 ), S eine-Inf´ erieure ( 76 ), Seine-et-Marne ( 77 ), Seine-et-Oise ( 78 ), Somme ( 80 ) South Ard` eche ( 7 ), Ari ` ege ( 9 ), Aude ( 11 ), Aveyron ( 12 ), Bouc hes-du-Rhone ( 13 ), Gard ( 30 ), Haute- Garonne ( 31 ), Gers ( 32 ), H´ erault ( 34 ), Lot ( 46 ), Loz` ere ( 48 ), Hautes-Pyr´ en´ ees ( 65 ), Pyr´ en´ ees-Orien tales ( 66 ), T arn ( 81 ), T arne-et- Garonne ( 82 ), V ar ( 83 ), V aucluse ( 84 ) W est Charente ( 16 ), Charen te-Inf´ erieure ( 17 ), Cˆ otes-du-N ord ( 22 ), D ordogne ( 24 ), Finest` ere ( 29 ), Gironde ( 33 ), Ille-et- Vilaine ( 35 ), Landes ( 40 ), Loire-Inf´ erieure ( 44 ), Lot-et- Garonne ( 47 ), Maine-et-Loire ( 49 ), Ma yenne ( 53 ), Morbihan ( 56 ), Basses-Pyr´ en´ ees ( 64 ), Deux-Sevres ( 79 ), V endee ( 85 ), Vienne ( 86 ) Other Corse ( 200 ) Arbuthnot, J. ( 1710). An argumen t for devine pro vidence, taken from the constant regularit y observ’d in the births of b oth sexes. Philosophic al T r ansactions 27 186–19 0. Balbi, A. (1822). Essai statistique sur l e r oyaume de Portugal et d ’ A lgarve, c omp ar´ e aux autr es Etats de l ’ Eur op e et suivi d ’ un c oup d ’ œil sur l ’ ´ etat actuel des scienc es, des lettr es et des b e aux-arts p armi les Portug ais des deux h´ emisph ` er es. . . Rey et Gravier, Paris . 2 vol. BNF: FB-16466/7 . Balbi, A. and G uerr y, A.-M. ( 1829). Statist ique c omp ar ´ ee de l ’ ´ etat de l ’ instruction et du nombr e des crimes dans les divers arr ondissements des ac ad ´ emi es et des c ours r oyales de F r anc e . Jules Renouard, Paris . BL:T ab.597 .b.(38); BNF: Ge C 9014 . Beirne, P. (1993a). Adolphe Quetelet and the origins of pos- itivist criminology . Amer. J. So ciolo gy 92 1140–11 69. Beirne, P. (1993b). The social cartography of crime: A . M. Guerry’s Statistique Mor ale (1833). In Inventing Criminol- o gy Chapter 4, 111– 141. State Universit y of A lbany Press, Albany , NY. Bergha us, H. (1838). Physikalischer Atlas . Justus P erthes, Gotha. Biena ym ´ e, J. (1861). R app ort sur le concours p our le prix de statistique (1860). F ondation Montyon , Comptes r endus de l ’ A c ad ´ emie des scienc e . 25 Mar 1861, t. LI I, and 23 Dec 1861, t. LI I I. Bills, C. B. and Li, G. (2005). Correlating homicide and suicide. I nternat. J. Epidemiolo gy 34 837–8 45. Bul wer, H. L. (1834). F r anc e , So cial , Liter ary , Politic al . Baudry’s European Library , Paris. Carr, D., , D. and MacEa chren, A. (2005). Conditioned c horopleth maps and hyp othesis generation. Ann. Asso c. Amer ic an Ge or gr aphers 95 32–53. Carr ´ e de Bussero lle, J.-X. (1880). D ictionnair e g ´ eo gr aphique , historique et bio gr aphique d ’ Indr e-et-L oir e et de l’ancienne pr ovinc e de T our aine . Rouill´ e-Ladev´ eze, T ours. Caunter, G. H. (1833). Review of Essa y on the Moral Statis- tics of F rance. A thenaeum 303 537 –539. Chernoff, H. (1973). The u se of faces to represent p oin ts in k -dimensional space graphically . J. Amer. Statist. Asso c. 68 361–368. Chev alier, L. (1958). Classes L ab orieuses et classes dan- ger euses ` a Paris p endant la pr ` emier e moiti´ e du XIX si` ecle . Plon, Paris. Chev allier, V. (1871). Notice n´ ecrologique sur M. Minard, inspecteur g´ en ` eral ds ponts et c hauss´ ees, en retraite. A nn. p onts et chauss ´ ees , 5 e s ´ erie; 2 e semestre, 1–22. Cleveland, W . S. (1993). Visualizing Data . Hobart Press, Summit, N J. Cleveland, W. S., G ro sse, E. and S hu, W . M. (1992). Local regressi on mo dels. I n Statistic al Mo dels in S (J. M. Cham b ers and T. J. Hastie, ed s.) 309–372. W adsworth, Pa - cific Gro ve, CA. Diard, H. (1866). Statistique Mor ale de L’ An gleterr e et de la F r anc e p ar M. A.-M. Guerry : ´ Etudes sur c et Ouvr age . Bailli ` ere et fils, P aris. Diard, H. (1867). Disc ours de M. A. Maury et notic es de MM. H. Diar d et E. Vinet [ On Andr ´ e-Michel Guerry ]. Bailli ` ere et fils. BNF: 8- LN27- 23721 I. Discours de M. Al- fred Maury I I. Notice de M. H. Diard (Journal d’Indre-et- Loire, 13 Apr 1866) I I I. Notice de M. Ernest Vinet (Journal des d´ ebats, 27 Apr 1866). d’Ocagne, M. (1893). Le calcul simplifi ´ e par les proc´ ed´ es m´ ecaniques et graphiques. Ann. Conservat oir e des Art s et M´ etiers , 2e s ´ erie, tome 5, 231–2 68, 269 –282, 323–349. Dupin, C. (1826). Carte figur ative de l ’ instruction p opulair e de l a F r anc e . Jobard. BNF: Ge C 6588 [F un khouser (1937, page 300) incorrectly dates this as 1819.] Dupin, C . ( 1827). F or c es pr o ductives et c ommer ciales de la F r anc e . Bac helier. Durkheim, E. (1897). L e Sui cide . A lcan, Paris. Dyk es, J., Ma cEachren, A. M. and Kraak, M.-J. (2005). Exploring Ge ovisualisation . Elsevier, New Y ork. 32 M. FRIENDL Y Elmer, M. C. (1933). Century-old ecologic al studies in F rance. Amer. J. So ciolo gy 39 63–7 0. F aure, F. (1918). The development and progress of statistics in F rance. In The History of Stat istics : Their Development and Pr o gr ess in Many Countries (J. K oren, ed.) 218–329. Macmilla n, New Y ork. F ox, J., Friendl y, M. and M onette, G. ( 2007). Visual hypothesis tests in multiv ariate linear mod els: The hep- lots pack age for R . I n DSC 2007 : Dir e ctions i n Stat istic al Computing . Au ckla nd, NZ. Freedman, D. A. (2001). Ecolog ical inference and the eco- logical fallacy . In Inter national Encyclop e dia of the So cial and Behavior al Scienc es (N. J. Smelser and P . B. Baltes, eds.) 6 4027–4030 . North-Holland, Amsterdam. Friendl y, M. (1991). SAS System for Statistic al Gr aphics , 1st ed . SAS Institute, Cary , NC. Friendl y, M. (2002). Visions and Re-Visions of Charles Joseph Minard. J. Educ ational and Behavior al Statistics 27 31–51. Friendl y, M. (2005). Milestones in the h istory of data vi- sualizatio n: A case study in statistical historiograph y . In Classific ation : The Ubiquitous Chal lenge (C. W eihs and W. Gaul, eds.) 34–52 . S pringer, New Y ork. Friendl y, M. (2006). Data ellipses, HE plots and reduced- rank d ispla ys for multiv ariate linear mo dels: SAS soft ware and ex amples. J. Statist. Softwar e 17 1–42. Friendl y, M. (2007a). A brief history of data v isualiza- tion. In Handb o ok of Computational Statistics : Data Vi- sualization (C. Chen, W. H¨ ardle and A. Unwin, eds.) I I I . Springer, Heidelberg. Friendl y, M. (2007b). HE plots for multiv ariate general lin- ear mo dels. J. Comput. Gr aph. Statist. 16 421– 444. Friendl y, M. (2007c). La vie et l’o euvre d’Andr´ e-Michae l Guerry (1802–1866 ). M´ emoir es de l ’ A c ad´ emie de T our ai ne . T o app ear. Friendl y, M. and Denis, D. (2005). The earl y origins and develo pment of the scatterplot. J. History of the Behavior al Scienc es 41 103–13 0. Friendl y, M. and Kw an, E. (2003). Effect ordering for data displa ys. Comput. Statist. Data Anal. 43 509–539. MR200545 1 Friendl y, M. and P alsky, G. (2007). Visualizing nature and society . In Maps : Finding Our Plac e in the World ( J. R . Ack erman and R. W. Karro w, eds.) 205–251. Univ. Chicago Press. Gabriel, K. R. (1971). The biplot graphic display of ma- trices with app lication to principal comp onents analysis. Biometrics 58 453–467 . MR031264 5 Gabriel, K. R. (1981). Biplot display of multiv ariate ma- trices for inspection of d ata and diagnosi s. In Interpr eting Multivariate Data Chapter 8 (V. Barnett, ed.) 147–173. Wiley , London. MR0656974 Gnanadesikan, R. and Kettenring, J. R. (1972). Robust estimates, residuals, a nd outlier detection with m ultire- sponse data. Biometrics 28 81–124 . Go wer, J. C . and H a nd, D. J. (1996). Bipl ots . Chapman and H all, London. MR138286 0 Graunt, J. ( 1662). Natur al and Poli tic al Observations Men- tione d in a F ol lowing Index and Made Up on the Bi l ls of Mortality . Martin, Allestry , and Dicas, London. Guerr y, A.-M. (1829). M´ emoire sur les v ariations m´ eterolog iques compar´ ees aux p h´ enom ` enes physiolog iques. An n. d ’ Hygi` ene Publique et de M ´ ede cine L ´ egale I 228. Guerr y, A.-M. ( 1832). Statist ique c omp ar ´ ee de l ’ ´ etat de l ’ instruction et du nombr e des crimes . Everat, Paris. Guerr y, A.-M. (1833). Essai sur l a statistique mor ale de la F r anc e . Crochard, P aris. Guerr y, A.-M. (1864). Statistique mor ale de l ’ Ang leterr e c omp ar´ ee ave c la statistique mor al e de la F r anc e, d ’ apr ` es les c omptes de l ’ administr ation de la j ustic e criminel le en An gleterr e et en F r anc e, etc. J.-B. Bailli ` ere et fils, Par is. BNF: GR FOL-N-319; SG D/4330 ; BL: Maps 32.e.34; SBB: Fe 8586 ; LC: 110 05911 . Hack ing, I. (1990). The T aming of Chanc e . Cam bridge Univ. Press. Herschel, J. F. W. (1831). A Pr eli m inary Disc ourse on the Study of Natur al Philosophy . Carey and Lea, London. Herschel, J. F. W. (1833). On the in vestigatio n of the orbits of revolving double stars. Memoirs of the R oyal Astr onom- ic al So ci ety 5 171–222. Hirsch, S. A. (1982). A n algorithm for automatic name placemen t around p oint d ata. The Americ an Carto gr apher 9 5–1 7. Ihaka, R. (2003). Colour for p resen tation graphics. In Pr o- c e e dings of the 3r d Interna tional Workshop on Distribute d Statistic al Computing (DSC 2003) . T echnisc he Un iversit¨ at Wien, Vienna, Austria. Isamber t, F.-A. (1969). Les rec herches statisti ques d’Ange- Mic hel Guerry (sic). Cahiers Internationaux de So ciolo gie 47 35–44. Klein, J. L. (1997). Statistic al Vi sions in Time : A History of Time Series Analysis, 1662– 1938 . Cam bridge Univ. Press. MR147940 9 Kuhfeld, W. F. (1991). A heuristic p ro cedure for lab el placemen t in scatterplots. Pa p er presented to the Psycho- metric Society . Kuhfeld, W. F. (1994). Graphical scatterplots of la- b eled points. O bservations 3 223–237. Av ailable at http://sup port.sas.com/te chsup/technote/ts722k.pdf . Laro usse, P. (1866). Gr and dictionnair e universel du XI X si´ ecle . Larousse, P aris. Lazarsfeld, P. F. (196 1). N otes on the history of quantifi- cation in sociology—trends, sources and problems. Isi s 52 277–33 3. Lemon, J., Bolker, B., Oom, S., Klein, E., Ro wling- son, B., Wickham, H., Ty agi, A. and Eterradossi, O. (2007). Plotrix : V arious plotting functions . R pack age ver- sion 2.1-8. Monette, G. (1990). Geometry of m ultiple regression and in- teractiv e 3-D graphics. In Mo dern Metho ds of Data Anal- ysis Chapter 5 (J. F ox and S. Long, eds.) 209–25 6. S age Publications, Beverly Hills, CA. Nightingale, F. (1857). Mortality of the British Army . Har- rison and Sons, London. Noma, E. (1987). Heuristic method for lab el placemen t in scatterplots. Psychometrika 52 463–46 8. P alsky, G. (1996). Des Chiffr es et des Cartes : Naissanc e et d ´ evelopp ement de la c arto gr aphie quantitative fr an¸ caise au XIX e si` ecle . Comit ´ e des T rav aux H istoriques et Scien- tifiques (CTHS), Paris . GUERR Y’S MORAL ST A TISTICS OF FRANCE 33 P arent-Duch ˆ atelet, A. J. B . (1836). De la pr ostitution dans la vil le de Paris . Dumont, Bruxelles. Petty, W. (1665). The Ec onomic Writings of Sir W il liam Petty : T o gether with the Observations up on the Bil ls of Mortality . Cam bridge U niv. Press. Por ter, T. M. (1986). The Rise of Statistic al Thinking 1820– 1900 . Princeton Univ. Press. Quetelet, A. (1831). R e cher ches sur l e p enchant au crime aux diff´ er ents ˆ ages . Ha yez, Brussels. Quetelet, A. (1835). Sur l ’ homme et le d´ evelopp ement de ses facult ´ es, ou Essai d ’ une physique so ciale . Bac helier, P aris. Ro usseeuw, P. and Lero y, A. (1987). R obust R e gr ession and Outlier Dete ction . Wiley , N ew Y ork. MR091479 2 Ro usseeuw, P. and V an Driessen, K. (1999). A fast algo- rithm for the minimum cov ariance determinant estimator. T e chnometr ics 41 212 –223. Seber, G. A . F. (1984). Mul tivariate Observations . Wiley , New Y ork. MR074647 4 Slocum, T. A. , McMaster, R. B., Kessler, F. C. and Ho w ard, H. H. (2005). Thematic Carto gr aphy and Ge o- gr aphic Vi sualization , 2nd ed. P earson Pren tice Hall, U p- p er Sadd le River, NJ. S ¨ ussmilch, J. P. (1741). Di e g¨ ottliche O r dnung in den V er¨ and erungen des menschlichen Geschle chts , aus der Geburt , T o d , und F ort pflantzung . Germany . Theus, M. (2002). Interactive data visualization using Mon- drian. J. Statist . Softwar e 7 . Trumbo , B. E. (1981). A theory for coloring biv ariate sta- tistical m aps. The Americ an Stat istician 35 220–226 . v an Kreveld, M., S trijk, T. and Wol ff, A. (1999). Poin t labeling with sliding lab els. Comput. Ge ometry : The ory and Applic ations 13 21–47. MR170301 9 V apereau, G. (185 8). Dictionnair e universel des c ontemp o- r ai ns . H achette, Paris. Whitt, H. (2002). Inven ting so ciology: Andr´ e-Mic hel Guerry and th e Essai sur la statistique mor ale de la F r anc e . In Es- sai sur l a stat istique mor ale de la F r anc e ix–xxxv ii. Edwin Mellen Press, Lewiston, NY. Whitt, H. P. (2007 ). Mo dernism, internal colonialism, and the direction of violence: S uicide and crimes against p er- sons in F rance, 1825–1 830. U npublished manuscript. Whitt, H. P., McMorris, B. J. and Wea ver, G. (1997). Crime and v iolance in F rance, 1825–18 30: Andr´ e-Michel Guerry and the Essai sur la statistique de la F r anc e . Paper presented at th e Annual Meeting of the South ern Sociolog- ical Society , New Orleans, LA. Wo lff, A. and Strijk, T. (1996). The ma p- labeling bibliograph y . W eb document. Av ailable at http:// i11www.iti .uni-ka rlsruhe.de/˜a wolff/ map-lab eling/bibliography/ .
Original Paper
Loading high-quality paper...
Comments & Academic Discussion
Loading comments...
Leave a Comment