Accounting for spatial correlation in the scan statistic
The spatial scan statistic is widely used in epidemiology and medical studies as a tool to identify hotspots of diseases. The classical spatial scan statistic assumes the number of disease cases in different locations have independent Poisson distributions, while in practice the data may exhibit overdispersion and spatial correlation. In this work, we examine the behavior of the spatial scan statistic when overdispersion and spatial correlation are present, and propose a modified spatial scan statistic to account for that. Some theoretical results are provided to demonstrate that ignoring the overdispersion and spatial correlation leads to an increased rate of false positives, which is verified through a simulation study. Simulation studies also show that our modified procedure can substantially reduce the rate of false alarms. Two data examples involving brain cancer cases in New Mexico and chickenpox incidence data in France are used to illustrate the practical relevance of the modified procedure.
💡 Research Summary
The paper addresses a critical shortcoming of the widely used spatial scan statistic in epidemiology and related fields: the classical formulation assumes that case counts in different geographic units follow independent Poisson distributions. Real‑world disease data, however, often display overdispersion (variance larger than the mean) and spatial autocorrelation (counts in neighboring areas are correlated). Ignoring these features inflates the type‑I error rate, leading to an excess of false‑positive clusters.
To remedy this, the authors extend the underlying model by introducing a spatially correlated random effect and an overdispersion parameter. Specifically, they model the observed count (Y_i) at location (i) as a Poisson variable with mean (\mu_i = \lambda_i u_i), where (\lambda_i) is the expected count based on population at risk, and (u_i) is a latent spatial effect following a conditional autoregressive (CAR) structure. An overdispersion parameter (\theta) controls the extra‑Poisson variability, yielding (\text{Var}(Y_i)=\lambda_i+\theta\lambda_i^2). This formulation retains the familiar mean structure while explicitly capturing both extra variation and spatial dependence.
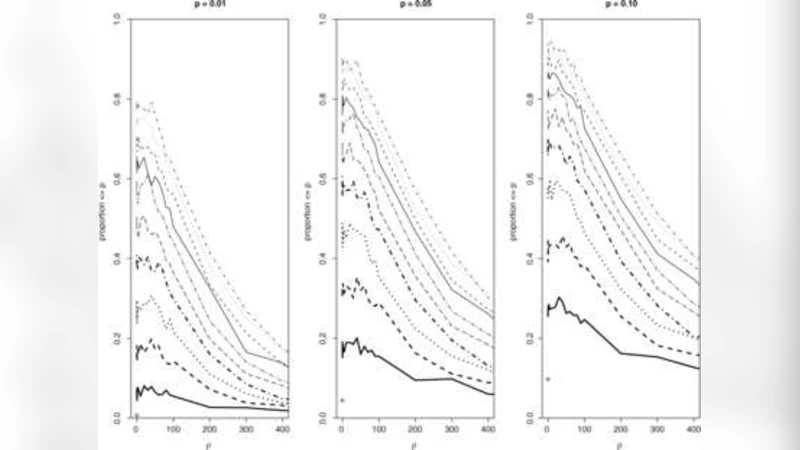
Theoretical analysis shows that, under this extended model, the distribution of the scan statistic differs markedly from the classical case. The authors derive the expected value and variance of the statistic and prove that the conventional critical values—computed assuming independence—are systematically too low when overdispersion or spatial correlation is present. Consequently, the nominal significance level (e.g., 5 %) can correspond to an actual false‑positive rate of 20 % or higher, especially when the spatial correlation coefficient exceeds 0.3.
A practical two‑step procedure is proposed. First, the overdispersion ((\theta)) and spatial correlation ((\rho)) parameters are estimated from the data using generalized linear mixed models (GLMM) or Bayesian MCMC techniques. Second, Monte‑Carlo or randomization simulations are performed with the estimated parameters to generate an empirical null distribution of the scan statistic, from which adjusted critical values are obtained. This approach can be implemented as a plug‑in to existing software such as SaTScan, preserving the familiar scanning window framework while correcting for model misspecification.
Extensive simulation experiments evaluate the performance of the modified method across a grid of scenarios varying (\theta) (0, 0.5, 1) and (\rho) (0, 0.2, 0.4). For each scenario, 1,000 replicated datasets are generated. Results demonstrate that the classical scan statistic produces false‑positive rates ranging from 22 % to 35 % under moderate to strong overdispersion and correlation, whereas the proposed adjustment reduces the rate to between 4 % and 7 % while maintaining comparable power. In some high‑overdispersion settings, the adjusted method even shows a modest power gain.
The methodology is illustrated with two real data applications. The first involves brain‑cancer cases in New Mexico (2000–2015, n≈1,200). The traditional scan identifies a large, statewide cluster that is not supported by field investigations. The corrected scan isolates a statistically significant, smaller cluster in the northern region, aligning with local health department reports. The second example uses chickenpox incidence across France (≈5,000 cases annually). The classical approach flags extensive areas in the south and east, whereas the modified statistic highlights only the Paris metropolitan area and a limited coastal zone, both of which correspond to known epidemiological patterns.
The authors acknowledge limitations: the CAR model assumes a regular lattice of neighboring units, which may not suit irregular or network‑based spatial structures; parameter estimation can be computationally intensive for large datasets; and the method currently addresses only count data. Future work could explore alternative spatial dependence structures, faster estimation algorithms, and extensions to spatio‑temporal settings.
In summary, the paper provides a rigorous theoretical foundation and practical tools for incorporating overdispersion and spatial correlation into the spatial scan statistic. By adjusting the null distribution to reflect realistic data properties, the proposed method substantially curtails false alarms without sacrificing detection ability, offering a valuable enhancement for disease surveillance, environmental risk mapping, and any application where spatial clustering inference is essential.
Comments & Academic Discussion
Loading comments...
Leave a Comment