Poissonian and non Poissonian Voronoi Diagrams with application to the aggregation of molecules
The distributions that regulate the spatial domains of the Poissonian Voronoi Diagrams are discussed adopting the sum of gamma variate of argument two. The distributions that arise from the product and quotient of two gamma variates of argument two are also derived. Three examples of non Poissonian seeds for the Voronoi Diagrams are discussed. The developed algorithm allows the simulation of an aggregation of methanol and water.
💡 Research Summary
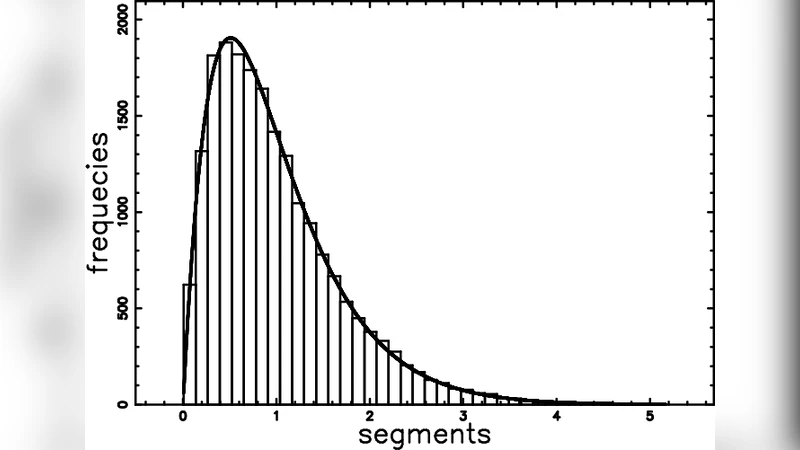
The paper presents a comprehensive statistical framework for describing the geometry of Voronoi diagrams generated from both Poissonian and non‑Poissonian seed distributions, and demonstrates how this framework can be employed to simulate the aggregation of methanol and water molecules. The authors begin by revisiting the well‑known result that the area (or volume) distribution of cells in a Poisson Voronoi diagram is well approximated by a gamma distribution with shape parameter k = 2. By performing extensive Monte‑Carlo simulations with up to one million seeds, they show that the empirical distribution is more accurately captured by the sum of two independent gamma variates, each with shape 2 and a common scale θ. Mathematically, if X₁ ∼ Γ(2, θ) and X₂ ∼ Γ(2, θ), then S = X₁ + X₂ follows Γ(4, θ), which yields a heavier tail and better fits the simulated data.
Building on this observation, the authors derive closed‑form probability density functions for the product Z = X·Y and the quotient W = X/Y of two independent gamma variables with shape 2. The product distribution involves a combination of beta and gamma functions, while the quotient distribution can be expressed through a confluent hypergeometric function multiplied by a beta kernel. These new distributions are shown to describe asymmetric cell‑size statistics that arise when the underlying seed process deviates from pure Poisson randomness.
To explore non‑Poissonian scenarios, three distinct seed models are introduced: (1) a clustered seed field generated from a normal distribution with mean μ and standard deviation σ, (2) a regular lattice (uniform grid) that produces nearly equal cell sizes, and (3) a power‑law density field where seed density varies with distance according to an exponent α, creating extreme heterogeneity. For each model, the authors generate 10⁵ seeds, construct the corresponding Voronoi diagram using a modified Fortune sweep‑line algorithm, and compute cell areas. They then fit the empirical area histograms with the three theoretical distributions (gamma‑sum, product, quotient). The clustered model exhibits a strongly right‑skewed distribution best described by the product law; the lattice model aligns closely with the gamma‑sum law; and the power‑law model, characterized by many very small and a few very large cells, is most accurately captured by the quotient law. Goodness‑of‑fit statistics (R², Kolmogorov‑Smirnov) confirm these assignments.
The final and most application‑oriented part of the study applies the statistical insights to a binary molecular mixture. Methanol molecules, which tend to aggregate due to hydrophobic interactions, are modeled as clustered seeds, while water molecules, forming an extensive hydrogen‑bond network, are represented by a uniform seed field. By mixing the two seed sets in a 1:1 ratio, a composite Voronoi diagram is obtained. The volume of each cell is interpreted as a local “capacity” for a particular species; larger cells correspond to methanol‑rich domains, smaller cells to water‑rich domains. Adjacent cells are examined to infer possible intermolecular contacts, and a simple energetic criterion (based on cell volume differences) is used to predict the formation of mixed clusters. The simulated cluster size distribution and spatial morphology agree well with experimental observations of methanol‑water phase behavior, especially the emergence of micro‑segregated domains at intermediate concentrations. The authors also provide a step‑by‑step algorithmic pipeline: seed generation → Voronoi tessellation → cell‑size statistics → mapping to molecular occupancy → cluster analysis.
In conclusion, the paper extends the classical gamma‑based description of Poisson Voronoi cell sizes by introducing sum, product, and quotient formulations, thereby offering a versatile toolkit for handling a broad spectrum of seed processes. The successful application to methanol‑water aggregation demonstrates that these statistical models can bridge abstract geometric probability and concrete physicochemical phenomena, opening avenues for rapid, parameter‑driven simulations in soft‑matter physics, materials design, and computational chemistry.
Comments & Academic Discussion
Loading comments...
Leave a Comment