Hitting Streaks Dont Obey Your Rules: Evidence That Hitting Streaks Arent Just By-Products of Random Variations
There have been more hitting streaks in Major League Baseball than we would expect. All batting lines of MLB hitters from 1957-2006 were randomly permuted 10,000 times and the number of hitting streaks of each length from 2 to 100 was measured. The a…
Authors: ** Trent McCotter (University of North Carolina, Chapel Hill) **
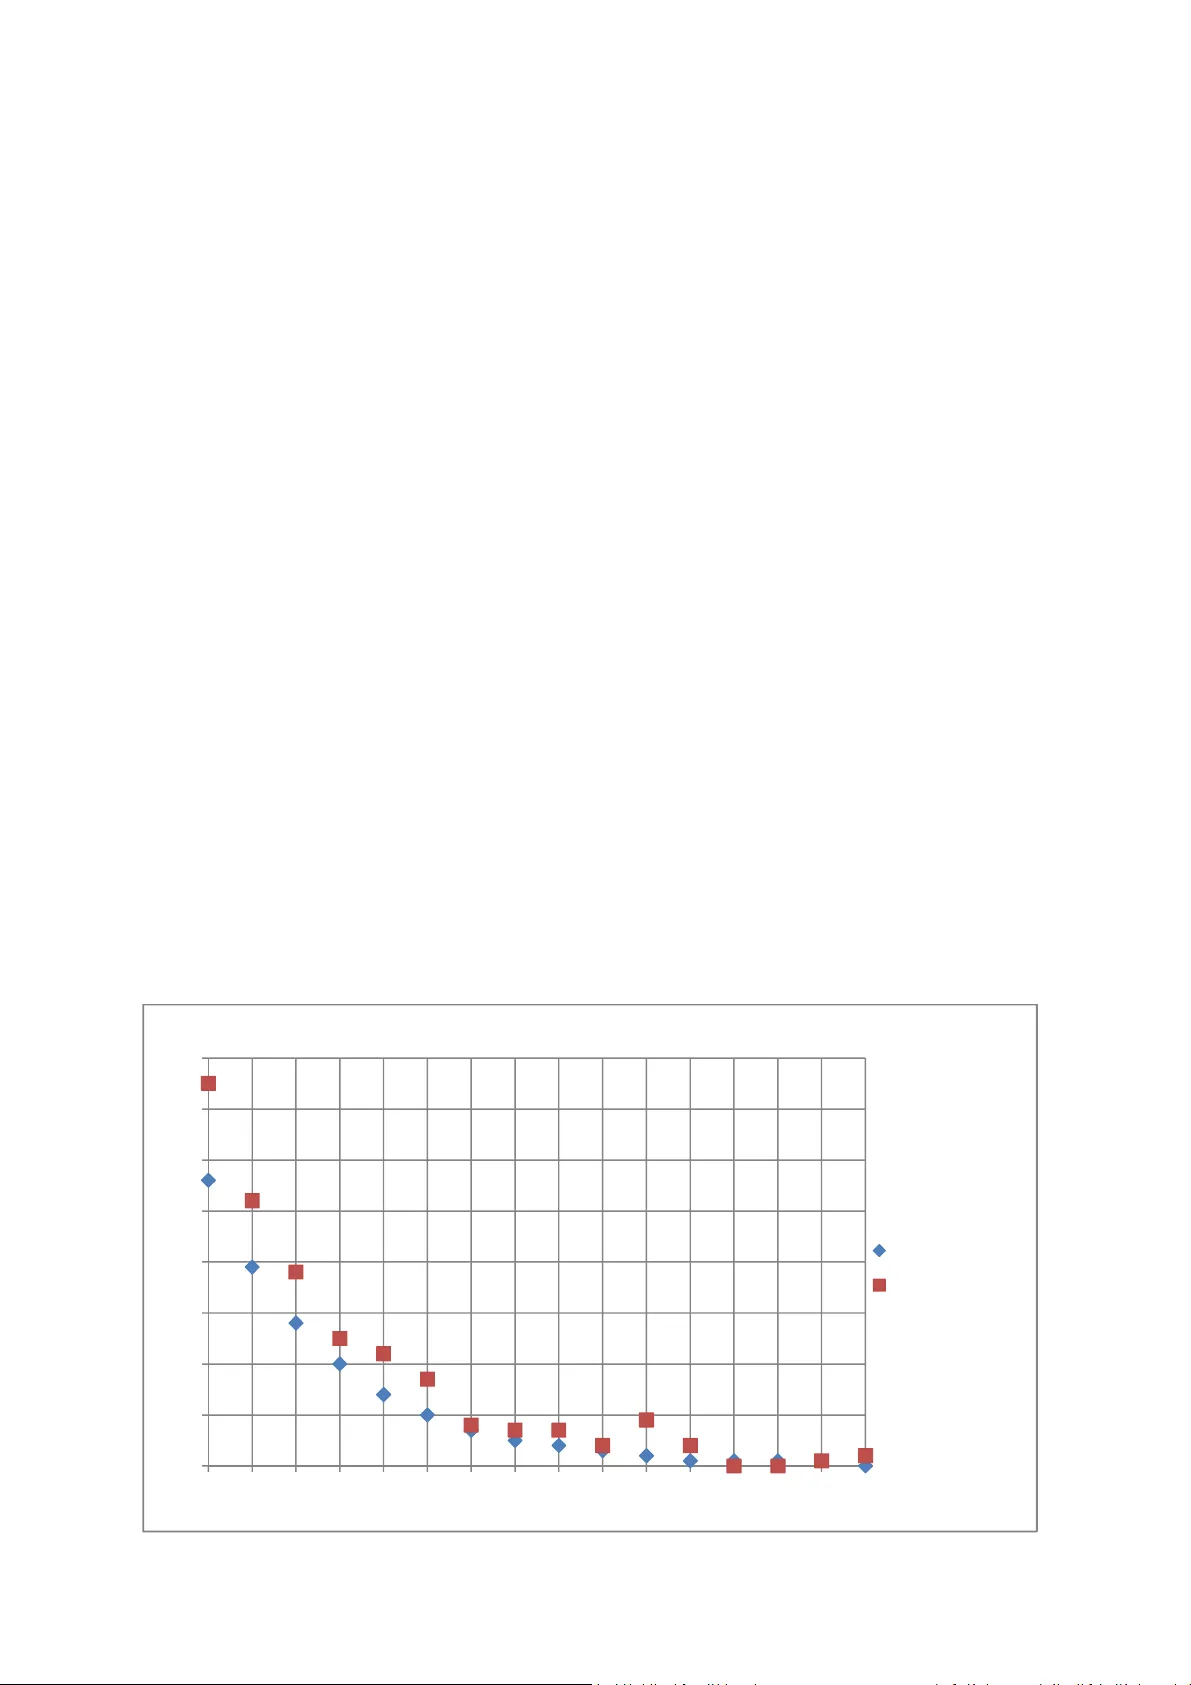
Hitting Streaks Don’t Obey Your Rules Evidence That hitt ing Streaks Aren’t Just By-products of Random Variations Trent McCotter, UNC Chapel Hill, Jan 2009, co ntact: trentm@ema il.unc.edu . Professiona l athletes naturally exper ience hot and co ld streaks. However, there’ s been a debate go ing on for some tim e now as to whether pro fession al athletes experience st reaks more freq uently than we would expect given th e players’ season statistics. This is als o known as having “the hot han d.” For example, if a pla yer is a 75 perc ent free-throw shooter this s eason and he’s m ade his last 10 free throws in a row, does he sti ll have just a 75 perc ent chance of ma king the 11thfree throw? The answer from most statis ticians would be a resounding Yes , bu t many casua l observers believ e that the player is mor e likely to make th e 11th attempt beca use he’s been “hot ” lately and th at his success should cont inue at a higher rate than expected. Two co mmon explanat ions for why a player may be “hot” are that his co nfidence is boosted b y his recent su ccess or that his musc le memory is better than usua l, producing more consis tency in his sho t or swing. As it relates to ba seball The question is th is: Does a pla yer’s performance in on e game (a ‘”trial,” if yo u will) have any pr edictive power for how he will do in the nex t game (the ne xt trial)? If a baseba ll player usual ly has a 75 percent chanc e of getting at l east one base hit in any g iven game and he’s gotten a hit in 10 str aight games, does he sti ll have a 75 percent chance of getting a hit in the 11th gam e? This is essent ially asking, “Are batters’ gam es independent from one another?” As with the free -throw example, most stat isticians wi ll say that the batter in f act does sti ll have a 75 percent of getting a hit in the n ext game, regard less of what he d id in the last 10. In fact, th is assumption has been the basis fo r several Baseball Resea rch Journa l articles in which the au thors have att empted to calculate the prob abilities of lon g hitting streaks, usua lly Joe DiMagg io’s major-league r ecord 56-game streak in 1941. It was th is assumption ab out independence tha t I wanted to test, esp ecially in thos e rare cases wher e a player has a long hitting streak (20 consecutive ga mes or more). These ar e the cases where the p layers are usua lly aware that the y’ve got a lo ng streak going. If it’s true that batt ers who are in th e midst of a long h itting streak will tend to be more l ikely to continue the streak than they norma lly would (they’re on a “hot streak”), then we wou ld expect more 20-game h itting streaks t o have actually happened than we would theoret ically expect to have happened . That is, if players realize they’ve g ot a long streak going, the y may change the ir behavior (mayb e by taking fewer walks or go ing for more sing les as opposed to doubles) to try to ex tend their streaks; o r maybe they really are in an abn ormal ‘hot streak.’ But how do we determ ine what the theoret ical number of twenty-game h itting streaks sho uld be? In the standard me thod, we start by figur ing out the o dds of a batter going h itless in a part icular game, and then we subtract that valu e from 1; that w ill yield a player’s the oretical probab ility of getting at least one hit in any g iven game: 1-((1-(AVG))^(AB/ G)) For a fabricated playe r named John Dice who hit .300 in 100 gam es with 40 0 at- bats, th is number would be: 1-((1-(.300))^(400/ 100)) = .7599 = 76 pe rcent chance of at least one hit in an y given game With the help of Retr oSheet’s Tom Ruane, I did a study over the 1 957–2006 seasons to see how well that for mula can predict the nu mber of games in wh ich a player w ill get a base hit. For exa mple, in the scenario above, w e would expect John D ice to get a hit in about 76 of his games; it tur ns out the formula above is indeed very accurate at predicting a p layer’s number of games with a t least one hit. Thus, if games r eally are independent f rom one anoth er and don’t have pr edictive power when it comes to lon g hitting streaks, this m eans that Joh n Dice’s 100-game season can be seen as a ser ies of 100 tosses o f a weighted coin that will come up head s 76 p ercent of the time; long strea ks of heads will rep resent long streak s of getting a hit in each game. This method for calculating the od ds of hitting streaks was used by Micha el Freiman in his art icle “ 56 -Game Hitting Streaks Re visited” in BRJ 31 (2002) , and it was also used by the auth ors of a 2 008 op-ed piece in the New York Times: Think of baseba ll players’ performances at bat as being like co in tosses. H itting streaks are like runs of many heads in a ro w. Suppose a hypothet ical player na med Joe Coin had a 50–50 chance of g etting at least one hit per ga me, and suppo se that he played 15 4 games during the 1 941 season. We cou ld learn something about Co in’s chances of having a 5 6-game hitting streak in 1941 by flipping a real coin 154 times, recording th e series of heads and ta ils, and observing wha t his longest stre ak of heads happ ened to be. Our simulations d id something very much like th is, except instead of a co in, we used rando m numbers generated by a co mputer. Also, instead of assuming t hat a player has a 50 percen t chance of hitt ing successfully in each game, we used baseba ll statistics to calculate each pla yer ’s odds, as det ermined by his actual batting p erformance in a gi ven year. For example, in 1941 Joe DiMaggio had an 81 percent chan ce of getting at least one hit in each game . . . we simulated a mock version of his 19 41 season, using the computer equivalent of a trick coin that comes up heads 81 percent of the tim e. —Samuel Arbesman and Steven Strogatz, New York Times , 30 March 2 008 But I wondered wheth er this method h as a fundamental prob lem as it relates to looking at long hitt ing streaks, because it uses a p layer’s overall season stats to make inference s about what h is season must have looked like on a game-by-game bas is. Think of the exa mple of flipping a coin . That’s about as rando m as you can get, an d we wouldn’t rea lly consider the outcome of you r last flip to affect the outco me of your next flip . That means that we can rearrange those he ads and tails in any random fashion and the only variation in streaks of heads would be du e entirely to rand om chance. If this were true in the baseba ll example , it means that we could randoml y rearrange a playe r’s season game log ( listing his bat ting line for each game) and the only variat ion in the number of long streaks that w e would find wou ld be due en tirely to random chance. The Number-Crunching To see who’s right abou t this, we need to solve the pro blem of how to calculate th e theoretica l number of hitting strea ks we would expect to f ind. It turns out that the ans wer actually isn’ t too complicated. I took the batting lines o f all players for 1957 throug h 2006 and subtracted out the 0 -for-0 batting lines, whi ch neither extend nor break a hitting streak . I ended up with about 2 million batt ing lines. Then, with the i mpressive assistance of Dr. Peter Much a of the Mathemati cs Department at the University of North Carolina, I took each p layer’s game log for each season of their career and sor ted the game-by-game stats in a completely random f ashion. So this means that , for instance, I’m still looking at Jo hn Dice’s .300 average, 100 games, and 400 at-bats—but the order of the game s isn’t chron ological anymore. It’s co mpletely rand om. It’s exactly ana logous to taking the coin tosses and sorting the m randomly over and o ver to see what long streaks of heads w ill occur. See the example at the end of this article for a v isual version of thi s. Dr. Mucha and I ran ea ch random sort ing ten thousand separate ti mes, so we ended up so rting every pla yer-season from 1957 through 2 006 ten thousa nd separate times to see what streaks occurr ed. For each of the 1 0,000 permutation s, we counted how many h itting streaks of each length occurred . The difference bet ween this m ethod and the method that has be en employ ed in the past is that, by using the actual game-by-ga me stats (sorted ran domly for each player), we don ’t have to make theoretical gues ses about how a player’s h its are distr ibuted throughou t the season. Remember, if players’ games wer e independent from one another, this method of ran domly sortin g each player’s games sho uld—in the long run—y ield the same number of h itting strea ks of each length that happened in real life. Here are the resu lts. 1957 – 2006 Actually Happene d In the 10,000 R andom Sortings Length Number of Hitting Str eaks Average Standard Deviation 5 22,632 22,584.63 141 6 14,470 14,086.60 112 7 9,151 8,947.64 89 8 6,081 5,766.29 72 9 4,059 3,759.81 59 10 2,645 2,4 77.50 48 11 1,792 1,6 47.42 39 12 1,226 1,1 04.86 32 13 801 747.12 27 14 552 506.85 22 15 415 347.13 19 16 270 238.69 16 17 194 164.97 13 18 129 114.22 11 19 112 79.80 8.9 20 75 55.90 7.5 21 52 39.36 6.2 22 38 27.80 5.3 23 25 19.70 4.4 24 22 13.93 3.7 25 17 10.00 3.2 26 8 7.20 2.7 27 7 5.13 2.3 28 7 3.71 1.9 29 4 2.63 1.6 30 9 1.90 1.4 31 4 1.39 1.2 32 0 1.01 0.99 33 0 0.74 0.86 34 1 0.55 0.74 35+ 5 1. 48 1.21 1957 – 2006 Actually Happene d In The 10,000 Rand om Sortings Length Number of Hitting St reaks Average Standard Deviation 5+ 64,803 62,765.96 150.69 10+ 8,410 7,620.99 69.45 15+ 1,394 1,137.24 30.71 20+ 274 192.43 13.32 25+ 62 35.74 5.84 30+ 19 7.07 2.60 35+ 5 1. 48 1.21 It’s clear that, for every length of hitt ing streak of 5-plus games, ther e have been mo re streaks in rea lity than we would expect g iven players’ game-b y-game stats. To g ive those numbers so me meaning: There we re 19 single-season hitting streaks of 30 -plus games from 195 7 through 2006. The ten thousand sep arate, random sort ings of the game-by- game stats pro duced an average of 7.07 su ch streaks f or 1957 –2 006. That means that a lmost three times as many 3 0- plus-game hitting str eaks have occurred in real l ife as we would have expected . Since there were 1 0,000 trials for our pe rmutation, the nu mbers here are a ll highly significant . For instance, the average number of 5 -plus-game streaks in the permutat ions was about 62,766, with a standard de viation of abou t 151 , and there were 64, 803 such streaks in real life from 1957 through 2006 . This means that the real-life total was 13.5 deviations away from the expected mean, wh ich implies that the odd s of gett ing these numbers s imply by chan ce are about one in 150 duodec illion (150 fo llowed by 39 zer os). The number of h itti ng str eaks that have rea lly happen ed is significantly much h igher than we would expect if long hitting streaks cou ld in fact be predicted using the coin- flip model. Addit ionally, the results of the 10 ,000 trials converged, wh ich means that the first 5,000 tr ials had almost the exact same average s and stan dard deviations as did th e second 5,000 tr ials. But what does th is all mean? What it seems to indicate is that many of th e attempts to calcu late the probabilities of long hitting streaks a re actually unde restimating the true od ds that such streaks will occur. Addit ionally, if hits are not IID (independent an d identically d istributed) events, the n it may be extreme ly difficult to dev ise a way to ca lculate probabilities that do produce more ac curate numbers. So why don’t the permuta tion s match the real-life n umbers? It’s easier to begin b y debunking s everal common-sense explana tions as to why t he permutations didn’t pro duce a similar number of h itting streaks as happened in rea l life. The first one I thoug ht of was the qual ity of the oppo sing pitching. If a batter fac es a bad pitching staff, h e’d naturally be more l ikely to start or cont inue a hitting streak, re lative to his overal l season numbe rs. But the proble m with this explanation is th at it’s too short-sided; you can’t face bad p itching for too lon g without it noticeabl y increas ing your numbers, plus you can’ t play twenty ga mes in a row aga inst ba d pitch ing staffs, which is what would be req uired to put together a long stre ak. This sam e reasoning is why p laying at a hitter-friendly sta dium doesn’t see m to work either, s ince these effects don’t con tinue for the n ecessary severa l weeks in a row. In o ther wo rds, the explanat ion must be something that lasts longer than a four-game ro ad trip to Coors Fie ld or getting to face Jo se Lima twice in one mon th. The second possib le explanation—one that I really though t could explain everyth ing—was the weather . That is, it’s commonly belie ved that hitting in creases during the warm summer months, wh ich would naturally make long h itting streaks more l ikely, while th e cooler weather at th e beginning and the end of the season mak es streaks less likely. This would explain why long streaks seem to happen so much more oft en than we’d expect ; the warmest p eriod of the summer can last for months, seeming ly making it fert ile ground to start a h itting streak. The r eason this is im portant is that hitting streak s are exponen ti al. Tha t is, a player who hits . 300 for two month s will be less likely to have a hitt ing streak than a pla yer who hits .200 one month and .400 the next; the t wo players wo uld have the exact same numbers, but hitting streaks tend to highly favor batt ers who are hitting very well, even if it’s just for a short period, and even if it’s counterba lanced by a period of poor h itting. The problem with the weather explanation is that the stats don’ t bear it out. Of the 27 4 streaks of 20-plus games from 1957 through 2 006, there were just as many that began in May as began in Jun e, July, or Aug ust. If it were true that the hottest mon ths spawned h itting streaks, we would see a spike in stre aks that began in th ose mont hs. We don’t see that spike at a ll. So that eliminates th e explanations tha t would seem to b e the most likely. Re member, if all of the assumptions about independence w ere right, we wouldn’t even have these differences betwe en the expected and a ctual number of streaks in the f irst place; so it’s yet ano ther big surprise that our top explanations f or these discrepanc ies also do n’t seem to pan out. Th is leaves me with two oth er possible exp lanations, each of which may involve psychology more than mathematics. First explanation Maybe the players who have long streaks going will chang e their approach at th e plate and go f or fewer walks and more singles to keep the ir hitting strea ks going. This same id ea is covered in The Bill James Go ldmine , where Jam es discusses how pitchers w ill make an extra effor t to reach their 20th victory of a season, whi ch results in there be ing more 20-game winners in the majors than 19-game winners. T here is evidenc e of this effect, too, as seen by the fol lowing grap h, which visualizes the chart fr om earlier. . 0 10 20 30 40 50 60 70 80 20 21 22 23 24 25 26 27 28 29 30 31 32 33 34 35 Number of Streaks Streak Length R eal Lif e vs. R andom Permutat ion SIMULATION AVG REAL LIFE TOTAL Notice how the number o f streaks aro und 25 games, and especially around 30 ga mes, sp ikes up, relative to t he general decreas ing trend of longer hitt ing streaks. Th ese streaks are pr etty rare, so we’re dealing with sma ll samples, but this helps show that h itters may rea lly be paying attention to their streaks (espec ially their length ), which lends a lot o f credibility to the idea that hitters ma y change their be havior to keep their streaks going . Also lending so me credibility to this explana tion is that the spread (the differen ce between ho w many streaks real ly happened and how man y we expected to happe n) seems to increas e as the length of the strea k increases. That is, there have been about 7 perce nt more hitt ing streaks of 10 g ames than we would expe ct, but there have been 2 0 percent more streaks of 15 ga mes, and there hav e been 80 percen t more streaks of 25 ga mes. Perhaps, as a str eak gets longer, a batter wil l become more focused on it, thinking about it during eve ry at-bat, doing a nything to keep it go ing. See the following chart for a representation of how, as streak l ength increases, th ere have been mor e such streaks in real life than we averaged in the random permu tations. . The evidence for th is is that 85 percent o f the players wh o had 20-plus-game hitting stre aks from 195 7 through 2006 had more at-bats per game during their hit ting streak than they had for their seaso n as a whole. Ov erall, it worked out to an average 6 .9 percent incr ease in at-bats per gam e during their streak. Th at extra 6.9 percent of at-bats per game almost certainly accoun ts for a po rtion of the “extra” hitting strea ks that have oc curred in real l ife as opposed to ou r permutations. This increase in at-ba ts per game during a strea k makes sense, as batters are much less likely to be used as a pinch- hitter or be taken ou t of a game ear ly when they have a h itting streak going . Additionally, when a player is hitting well, his manager is more likely to keep h im in the starting l ineup or even move hi m up in the batting or der so that he gets more plate appearanc es. There may a lso be a self-fulfilling prophe cy here; as a pla yer starts hitting wel l, his team will tend to score more runs, which will g ive the batter more pla te appearances. So hitting wel l lends itself to g etting more chances to extend a hitting streak. A lso, pitchers may b e hesitant to walk batters (and batters hesitant to take walks) because the p layers want the streak to en d “legitimately, ” with the batter be ing given several oppo rtunities to extend the streak. The extra at-bats per ga me also accou nt for the slope of the previous graph, wh ich shows an expo nential trend in the number of “extra ” hitting streaks tha t have occurr ed in real life as opp osed to permutations. As streak length increases, those extra at-bats make stre aks increasingly more likely. For instance, if we tak e a .350 hitter wh o plays 150 0.00 10.00 20.00 30.00 40.00 50.00 60.00 70.00 80.00 5 6 7 8 9 10 11 12 13 14 15 16 17 18 19 20 21 22 23 24 2 5 % More in Real Life t han in Simulations Length of Hitting Streak Longer Str eaks Y ield Higher Deviations games and increase h is at-bats per game fr om 4.0 to 4.28 (about a 6.9 percent i ncrease) for an entire season , his odds of a 20-game hitting st reak increase by 34 percent, but his odd s of a 30-game streak increase by 81 percent, and his odds of a 56-game strea k increase by an am azing 244 perc ent. Keep in m ind that those increases ar e larger than we would see in our hitting-strea k data becaus e the 6.9 percent increase in at-bats per ga me applies on ly to the 20 or so games during the hitting stre ak— not the entire 1 50 games th at a batter plays during a season. It is difficult to de termine ho w many more streaks we would see if h itters’ at-bats were allow ed to increase by 6.9 percent for only select ed stretches of their season. Second explana tion Something else is going on that is sign ificantly increasi ng the chances of long streaks, includ ing possibly the idea th at hitters do exper ience a hot-hand effect wher e they become more likely to have a hitting streak becaus e they are in a period in which the y continually h it better than their o verall numbers sug gest. This hot streak may happen at almost any point during a season, so we don’t see a sp ike in streaks during certa in parts of t he year. At first glance, th e results of a ho t hand would appear very similar to the hot-wea ther effect: If you’ ve been hitting well lately, it’s likely to continue, and if you haven’t be en hitting well lately, that’s l ikely to continue as well. The difference is th is: If it’s the weather that’s the lurking variable, then you cont inue hitting we ll because you n aturally hit better during this t ime of year. If it’s a hot-hand effect, then you co ntinue hitting well because you’re on a t rue hot streak. But we have see mingly shown that th e weather doesn’ t have an effect o n hitting streaks, the reby pro viding some credibility for the hot -hand idea. We expect a pla yer to have a certain a mount of hot and cold s treaks during any se ason, but the hot-hand effect says that the player w ill have hotter hots an d cooler co lds than we’d expect. So the p layer’s overal l totals still bal ance out, but his performance is more volatile than we would expect us ing the standard coi n-flip model. There may be some ad ditional evidence for this. Over the period 1957–2006, there were about 7 percent mor e 3- and 4-hit games in r eal-life than we would expe ct given th e coin-flip model but al so about 7 percent more hitless ga mes. Over a course o f 50 years, tho se percentages reall y add up. What this me ans is that the overa ll numbers stil l balance out over the course of a se ason, but we’re g etting more “h ot games” than w e would expect, which is being bal anced by more “cold games ” than we wou ld expect. Additionally, there is evidence that ten ds to favor the hot-hand approach over the vary ing-at-bat approach . Dr. Mucha and I ran a second permutation of 10,000 trials that was the same as the first per mutation—except we eliminated al l the games where the batter did not star t the game. In our first per mutation, we imp licitly assumed that non-starts are rando mly sprinkled throu ghout the season. But that is likely not the case . Batters will tend to h ave t h eir non-starts clustered together, usual ly when they return fro m an injury and are us ed as a pinch-hitter, when they ha ve lost playing t ime and are used as a defens ive replacem ent, or when the y are used sparing ly as the season draws to a close. We expected tha t this second pe rmutation would contain more streaks tha n the first permutation, as we essentially eliminated a lot of low-at-bat games, which are mu ch more l ikely to end a hi tting streak pre maturely. The quest ion was whether this second permutation would contain ro ughly the sa me number of streaks as occurred in real life . The outcome actual ly compo rted very well with our expectat ions. In general, th ere were mor e streaks in this second permutation than in the first permutation—but stil l fewer streaks than th ere were in rea l life. For instance, in real life for 1957–2006, there wer e 274 streaks of 20 or more games ; the first permutat ion (includ ing non- starts) had a n average of a mere 192 such str eaks; an d the second permutation ( leavi ng out n on-starts) had an aver age of 25 9 such streaks. The difference between 259 and 274 may no t sound like much, bu t it is still very s ignificant when viewed over 10,00 0 permutation s, especially since we stil l aren’t quite co mparing apples to app les. There undoubtedly wi ll be streaks that fall just short of 20 gam es when looking on ly at starts but that wo uld go to 20 or more ga mes when non-star ts (e.g., successful pinch-h itting appearances) are included. As the streak leng th increases, th e difference between real life and the two per mutations widens even further. For streaks of 30 or more games, there w ere 19 in real life, with an average of only 10 in our secon d permutation wh en we look only at starts . In this paper I deal p rimarily wit h long streaks, but I will poi nt out that, for streaks less than 15 games, the pattern does not hold; the re were fewer s hort streaks in real life than in the second permutation when we look only at starts . The reason this favors th e hot-hand effect is th is: Our first exp l anation abo ve relies on the idea that players are getting significant ly more at-bats per ga me during the ir hitting streak than dur ing the season as a whole. But the reason for a large part of that difference is that pla yers are not frequent ly used as non-starters (e .g., pinch-hitters) d uring their streak, so it art ificially infla tes the number of at-bats p er game that the batt ers get during the ir streaks relative to the ir season as a whole . Pinch-hitting appearances h ave little effect o n real-life hitting streaks b ecause managers are he sitant to use a batter sol ely as a pinch-hitter if he is hitting well. So we should be able to remove the pinch-hitting app earances from our per mutations and get resu lts that closely mirror real life. But when we do that, w e s till get the r esult that there have been sign ificantly more hitt ing streaks in real life than there “should ha ve been.” This te nds to add some weight to the hot-hand effec t, since it just does not ma tch up with what we wo uld expect if the varying number of at-bats per game were the true cause. Besides the hot-hand effe ct, other cond itions that may be immeasurable cou ld be playing a part. F or instance, scorers may be more generou s to hitters who have a long streak going, hat ing to see a streak broke n because of a borderline call on a play that could reason ably have been ru led a base hit. Conclusion If you take away on ly one thing from th is article, it sho uld be this: Th is study seems to pro vide some stro ng evidence that players’ games are not independen t, identically distributed tria ls, as statistic ians have assumed a ll these years, and it may even prov ide evidence that things like hot hands are a part of baseball streaks. It will likely take e ven more study to determine wheth er it’s ho t hands, or the change in behav ior driven by the inc entive to keep a streak go ing, o r some other cause that r eally explains why batters put together more hitting streaks th an they should ha ve, given their actual game-by-game stats. Given the results, it’s highly like ly that the explanation is some combination of a ll of these factors . The idea that hitting streaks rea lly could be the by-product o f having the hot hand is intriguing. It will tend to chafe statisticians, who r ely on that key assumpt ion of indep endent, identica ll y distr ibuted trials in order to cal culate probabilities. When we remove the non-starts tha t could have thrown a wrench into our firs t permutations— but we st ill get the same resu lts —then it really does lend some evidence for th e possibility that what has happened in real life just does not match what a “random wa lk” would look like. From the overwhe lming evidence of the per mutations, it appears tha t, when the same math formulas used f or coin tosses are used for h itting streaks, the probabilities they yield ar e incorrect; th ose formulas incorrect ly assume that the games in which a batter gets a hit are d istributed rand omly throughout his season. This also means tha t maybe all those baseball purists hav e had it at least p artially right al l this time; mayb e batters really do experience periods where their hitting is above and beyond what would be statistically exp ected given the ir usual performance. In his review of Michael Seidel’s bo ok Streak , Harvard biol og ist Stephen Jay Gou ld wrote: Everybody knows abo ut hot hands. The on ly problem is that no such p henomenon ex ists. The Stanford psychologist Amos Tve rsky studied e very basket made b y the Philadelph ia 76ers for more than a sea son. He found, first of a ll, that probab ilities of making a se cond basket d id not rise fol lowing a successful shot. Moreover, the n umber of "runs," or bas kets in succe ssion, was no great er than what a standard random, or coin-to ssing, model would pred ict. Gould’s point is that h itting streaks are ana logous to t he runs of baskets by th e 76ers in that neither should show any signs of de viating from a rand om coin-tossing model. I hate to disagree with a Harvard man, but my study of long hitting streaks for 1957 throug h 2006 seems to show t hat the actual numb er of long hitting s treaks are in fact not the same as what a coin-toss ing model would prod uce, even when we try to account fo r the fact that players get varying numbers of at-bats per g ame. By using th e coin-flip mode l all of these years, w e have been unde restimating the likelihood tha t a player will put together a 20 -, 30-, or even a magical 56-game hit ting streak. But this study doesn’t just look at the statis tic side of base ball. It also reveals the psychology of it. T h is study shows that sometimes ba tters really may have a hot hand, or a t least that they adapt their a pproach to try to kee p a long hitting streak going—and baseball p layers are nothing if not adapt ers. Coin-Flip Example I flipped a co in ten times and wrote down th e result. I then had my computer g ive me a random numb er that is somewhere betwe en 0 and 1, and I assigned that number to each coin flip: Flip Number Result Random Number 1 heads 0.975 2 tails 0.823 3 tails 0.434 4 heads 0.191 5 heads 0.652 6 tails 0.239 7 heads 0.303 8 heads 0.009 9 tails 0.917 10 heads 0.541 We can consider the table above to be like John Dice’ s batting log. Each ga me with a “heads” is a game where he got a hit. Each game w ith a “tails” is one in which he went h itless. The longest s treak of heads was t wo in a row. Now, I take those resu lts above and sort th em by that r andom number instead: Flip Number Result Random Number 8 heads 0.009 4 heads 0.191 6 tails 0.239 7 heads 0.303 3 tails 0.434 10 heads 0.541 5 heads 0.652 2 tails 0.823 9 tails 0.917 1 heads 0.975 It’s still the same o utcome as befor e, except that they ’ve just been reordered co mpletely random ly. Our longest streak of heads here is two in a row, as well. It just so happens that we end u p with the same longest streak of hea ds in this random sorting as we did in the original toss ing. But no w that the results are sor ted randomly, any va riation in the streaks we find wi ll be due completel y to chance. For coin tosses, w e expect to find abou t the same number o f long streaks from one trial to the nex t. And if hitters’ results were like coin tosses, we wou ld expect to f ind about the same numbe r of long hitting str eaks from one tria l to the next. But my resu lts show that th e original order of baseball games (analogo us to the first tab le of coin flips) is significantly mo re likely to contain long hitting streaks than the r andom order o f baseball games (ana logous to the second table of co in flips). Acknowledgment s Peter Mucha of the Ma thematics Depa rtment at the Uni versity of North Caro lina deserves ma jor applause for his great willingness to rev iew my article and especially for wri ting the code tha t would rando mly permute fifty y ears’ worth of information a mind-bog gling 10,000 tim es—and then doing it aga in for our secon d permutation. Had I done th at same work using my or iginal method , it would have taken me abo ut 55 days of nonsto p number-c runch ing. Addit ionally, Dr. Mucha’s efforts on my project were sup ported in part by the Nation al Science Foundation (awa rd number DMS- 0645369). Pete Palmer also deserves a han d for his will ingness to compile fift y years of data tha t was essenti al to running my secon d permutation . I would be remiss if I didn’t thank al l of the volunteers who do work for R etroSheet, whose data made up 1 00 percent of the infor mation I used in this study; Tom Rua ne deserves cred it for us ing RetroSheet data to compile several impo rtant files that co ntained hard-to-find information that I needed for this study . I would also like to thank Chuck Roscia m for reviewing my article, Dr. Alan Reif man of Texas Te ch (who runs The Hot Hand in Sports blog at th ehothand.blogspot.com) for read ing throug h a preliminary co py of the article, and esp ecially Steve Strogatz and Sam Arbe sman of Cornell for offer ing incredible insight on this topic, fo r sharing their research with me, and for letting me borrow part of their New York Times article. The previous artic le was published in the 2008 SABR Baseba ll Research Journa l. The next article was p ublished in the 2009 Journal as a response and clarificat ion. CHARLIE PAVITT’S CRITIQUE: I am writing this is response to Trent McCotter’s piece on hitting streaks from the 2008 Baseball Research Journal. I wa nt to begin b y commend ing T rent on this fine piece of work. In sh ort, a series of Monte Carlo tests reveal ed that the number of actual hitting streaks of lengths beginning with 5 games and endin g w ith 35 ga mes or more between 1957 and 2006 was, in each case, noticeabl y grea ter than what woul d have been expected by chance. It is always good to see evidence inconsist ent with our “received wisdom.” What I have to say here in no wa y attempts to contradict his research findings. My problem is with his attempt to exp lain them. Trent proposed three “common-sense” explanations for what he found. The first was that a batter might face relatively poor pitching for a significant stretch of time, increasing the odds of a lon g streak. But, in his words (page 64), “the prob lem with this explanation is that it’s too short-sided; you can’t face bad pitchin g for too long without it noticeably increasing y our numbers, plus you can’t play twent y g ames in a row against bad pitching staffs, which is what would be required to put together a long streak.” H e then goes on (page 65) “The same reasoning is why playing at a hitter-f riendly stadium doesn’t seem to work either, since these effects don’t continue for the necessary several weeks in a row.” His thi rd “common-sense explanation” is that, as hitting overall is thought to be better during the warm months, hitting streaks ma y be more common than expected during June through August. This is because, and this i s critical (page 65), “hitting streaks are exponential…a player who hits .300 for two months will be less likely to have a hitting streak than a pla y er who hits .200 one month and .400 the next...[because]…hitting streaks tend to highly favor batters who are hitting very well, even if it’s just for a short period.” This is absolutely correct. Unlike the first two proposed explanations, in this case Trent looked for releva nt evidence, claiming that he looked for more streaks in June, July or August and found no more than in Ma y. Trent, how about April and September? Anyway, rejecting all three of these, Trent then proposed two possible psychological explanations. The firs t is that hitters aware of a streak intentionall y change their approach to go for more singles, particularly when the streak gets long; and he has evidence that longer streaks occur less randomly than shorter ones, which would occur under this assumption (players would more likely think about keepin g the ir streak going when it was long ongoing). The second is t hat hot hands rea ll y exist, and his claime d evidence is that taking games out of his random sample in which the pla y er does not start increases the number of predicted hitting streaks, bringing it more in line with the number that actually occurred. Makes sense; a hittin g streak is easier to maintain the more at bats one has in a game. He pro poses that this could reflect real life because managers would start a player proportionally more often when he was hittin g well. True, bu t we should keep in mind that the same statistical effect for starting games would occur whether there is a hit hand or not. In other words, I don’t t hink his evidence is very telling. Nonetheless, I want to say here that Trent ma y w ell be correct about either or both of these psychological explanations. But that doesn’t matter. If we are serious about sabermetrics as a science, then without some pretty strong evidence we sho uld NEVER use a psychological explanation for our data. The reason for this is th at they ca n be used to explain anything, and given our present st ore of knowledge abo ut pla yer psychology they are impossible to evaluate. L et us suppose that rather than finding more hitting streaks than chance would allow, Trent had found fewer. He could then sa y that the reason for this is that batters crumble under the stress of thin king abo ut the s treak and perform worse than they would normally. If Trent found no d ifference, he could then sa y that batters are psychologically unaffected by their circumstance. The poin t, as esteemed philosopher Karl Popper pointed out in his now-classic 1934 book The Logic of Scientific Discovery, if a proposed explanation is impossible t o disconfirm, then it is not scientific. Again, Trent’ s proposals may be correct, but we can’t judge them, so we should not be proposing them. The first three, however, can be disconfirmed, so we can take them seriously. Trent claims to have disconfirmed the third, but we need to know about Ap ril and September. But the real iss ue I ha ve is with his dis m issal of the first two, because he thought did not apply the logic in their case that he correctl y applied for his “hot weather” proposal. Let me begin with the first. A batter does not have to face a bad pitchin g staff in consecutive games for his odds of a hitting streak to increase. Let us suppose that a batter faces worse pitching than average during only 10 of 30 games in May and makes up for it by facing worse pitchin g than a verage durin g 20 of 30 games in June. W e use the same exact logic that Trent used correctly for the “hot weather” proposal; h is odds of having a batting streak, which would occur during June, would be greater than another batter that faced worse pitching than average during 15 games in Ma y a nd 15 games in June. The same ex planation go es for hitter-fri endly and -unfriendly ballparks, and is strengthened in this case because of well-supported known differences in b allpark effects. If a player’s home field was hitter-friendl y an d, durin g a stretch of time, many of his road games were in hitters’ parks, he could easily have 20 or more games in this context in a given month. I have no idea whether either of these two explanatio ns for Trent’s findings is correct. But the differen ce between these and his psychological proposals is that we could test these two and not those he favors. I would obviously like to see that happen. And I would very much like it if we dispense with psychological explanations for our findings until we are in a position to evaluate them. McCotter response to Pavitt’s review of ‘ Hitting Streaks Don’t Obey Your Rules.’ I’m glad that my article, “Hitting Strea ks Don’t Obey You r Rules,” has fostered some deba te on the topic of hitting strea ks. Charl ie Pavitt has written an exce llent review, and I have also received numero us e- mails from others who read the article and had insights and cr itiques. Below, I have tried to o utline some rebutta ls, clarifications, and co rrections conc erning the artic le. First, I want to state th at the original intent of my article was to try to d isprove the standard independence assu mption that under lies the coin-toss model tha t is used to calculate pro babilities of streaks. For a long time no w, players’ final season stat istics (like 1 50 games, 600 a t- ba ts, 200 hits) were used to extrapolate what kind s of hitting streaks were l ikely to have happene d. I t works f ine, so long as the games are essent ially randomly d istributed. By randomly per muting the games 10, 000 times for each player over 195 7-2006—and getting so many fewer streak s than we have s een in real l ife—I think there is very stro ng evidence that the independence a ssumption underlying th e coin-toss model does not work in the context of hitting streak s. Once I had shown the po or results of the indep endence test, I tried to come up with explanat ions for why we have seen so many more h itting streaks than occurred in the rando m permutations . I’ll now address seve ral of Charlie Pav itt’s arguments on that topic. He says that I’ve too-qu ickly dismissed the effec ts of facing bad opponen ts. It’ s ver y difficult to test the effect of facing bad p itching because there is no easy way to define bad p itching. One short-cut I have used i s to look at how many long hitting streaks th ere have been ag ainst particu lar teams (i.e., a batter gettin g a hit in 30 stra ight games vs. the Blue Jays, over the cou rse of his career ). Over 1957-2006, there have been 19 hitting streaks of 30 or more games vs. the leag ue as a whole , but only 5 such streaks vs. a particu lar opponent. We expect fewer strea ks, simply becau se you can’t cou nt the last 10 ga mes vs. Toronto and the first 20 games vs. Texas as a 30-game hitting str eak vs. one particular o pponent. But if facing bad teams were so conducive to hit ting streaks, it see ms like we wou ld have seen more hitting streaks aga inst bad teams—those bad teams would cont inually be boo sting their opponents’ avera ges. Pavitt also says that I too-quickly dism issed the effect o f playing at certain h itter-friendly ballparks. I went through al l 19 of the 30-game hitting stre aks over 1 957-2006. Over those streaks, 5 0.2% of the games comprising th e hitting streaks w ere played at the ba tters’ home stadiu ms, and 49.8% of th e games were p layed at road stad iums. Batters g et more at-bats when they’ re on the road (s ince their team always gets to bat in the n inth inning), but batting averag es are higher at h ome stadiums. In the end, it clear ly has balanced out. Thus, players who have had 30-game hitting streaks don’t se em to have received any advan tage either by p laying more games at home (where they have a higher batting average), or by play ing more games on the r oad (where they get more at-bats). If playing at a hitter- friendly stadium grea tly helped long h itting streaks, it seems like we’d see a h igher percentage than 50.2% of the games making up the streak to have been played at the h itter-friendly home park . In other words, long hitting str eaks over 195 7-2006 don’t seem to be cen tered around stretches whe re the player was playing more games at home or on the ro ad than they do at an y given stretch of the seaso n. Pavitt also ment ions that I didn’t include any data about hitt ing streaks beginning in Apr il or Septembe r. I exclude April becau se the season’s beg inning date freq uently changed o ver 1957- 20 06, and it often wasn’t until mid-Apr il. So t here just weren’t a s many games be ing played in April as ther e were in May, June, July, or August. I exclud e September because strea ks that begin in Sep tember have a much lower chance of actuall y making it to 20 or 30 gam es, simply because the player will run o ut of games to p lay. So comparing Apr il or September to the months of May, Jun e, July, and August wouldn’t give us a ny insight. Pavitt’s final cr itique is that several of my ‘psychologic al’ explanations for extra hitting strea ks aren’t testable. I agree that test ing these things is very difficult, simply because that’s the na ture of test ing humans, who can ad just on-the-fly. However, just bec ause something may b e difficult—or even impossible—to ver ify doesn’t mean that w e should exclude i t as a possible factor . For instance, the placebo effect with drugs is a psychologi cal explanat ion that seems very d ifficult to refute; we accept it as valid mostly becaus e we’ve el iminated other explanations. In the bas eball world, there is a co mmon thought that batters t end to take fewer wa lks as their hitting strea ks increase. This is tough to test, bu t not impossible; maybe it’s just a result of multiple effects that natu rally vary at-bats through out the season. I just don’t see the proble m with including psycho logical factors in a study that dea ls with human behavior. I also wanted to inc lude some quick answ ers to questions that repeatedly came u p: 1)I only looked at s ingle-season streaks f or the entire project, so multi-season streaks are not included . 2)I excluded all 0 -for-0 batting lines, EXC EPT where the player had a sacrifice fly . P er the MLB Ru les, an 0-for-0 with a sacr ifice fly will end the h itting streak, ev en though the batter ha d zero at-bats. And here is one correct ion to the original a rticle: the y-axis o f the chart on page 6 6 should read from 0 % to 80%, instead of 0 % to 8%. Thus, for example, we s aw an extra 40%—not 4 %—in 18-game hitt ing streaks. streak attr ition.txt If all you told me was that a play er had a 20+ g ame hitting st reak, I'd be a ble to tell you that the mo st-likely plac e it'd end wou ld be when th e player was trying to g o from game #3 0 to game #31. Using these totals I've compiled ( which may be a little off, since ther e are still hitti ng streaks out there waiti ng to be found ), moving fro m the 30th gam e to the 31st game has th e lowest succe ss rate out of all sequen ces of at leas t 20 games in a row (at leas t til you hit 45 games, w here only 50% (DiMaggio b ut not Keeler) wen t from 45 to 4 6 games). Check out t hese success r ates for conti nuing a streak from lengt h 'n' to 'n+1' : of all stre aks that hit 2 0g, 75.3% of t hem continued to at least 21g of all stre aks that hit 2 1g, 75% of the m continued to at least 2 2g "" 22 games , 77.1% contin ued to at leas t 23g 23g->24+g: 74.5% 24g->25+g: 79.8% 25g->26+g: 77.3% 26g->27+g: 75.8% 27g->28+g: 77.6% 28g->29+g: 77.8% 29g->30+g: 74.3% 30g->31+g: 64.2% (34-ou t-of-53) 31g->32+g: 70.6% (24-ou t-of-34) 32g->33+g: 91.7% 33g->34+g: 81.8% 34g->35+g: 83.3% 35g->36+g: 66.7% (10-ou t-of-15) 36g->37+g: 90% 37g->38+g: 88.9% 38g->39+g: 87.5% 39g->40+g: 85.7% 40g->41+g: 83.3% ...the long er streaks suf fer from small er sample size s (the last se quence where we have at least 20 'sa mples' is movi ng from 33 to 34 games, w here 18-out-of -22 players mad e it). But I assum e you can pick out the rea l outlier: of all streaks that hit 3 0 games, only 64.2% of th em move on to 31 games, t he lowest succ ess rate for moving from any length hitting str eak to the nex t game (except , as mentioned above, for the really l ong streaks wh ere there have been so fe w). So, given t hat Zimmerman' s streak was m ore than 20 ga mes (but less than 46 games), it was more-lik ely to fail at game #31 t han at any oth er game. Trent McCot ter Page 1 1957 -200 6 LENGTH 5 6 7 8 9 10 11 12 13 14 15 16 17 18 19 20 21 22 23 24 25 26 27 28 29 30 31 32 33 34 35+ 1957 -200 6 LENGTH PROB. 5+ 6.4 * 10 ^-42 10+ 3.4 * 10 ^-30 15+ 3.2 * 10 ^-17 20+ 4.6 * 10 ^-10 25+ 3.5 * 1 0^-6 30+ 2.2 * 1 0^-6 35+ 0.001 8 7 7 25 0.99 0.86 19 5 # OF HITT ING STRE AKS 274 62 1137 .24 192.4 3 35.74 7.07 1.48 1394 8410 6480 3 52 38 3.71 2.63 1.90 1.39 1.01 0.74 0.55 27.80 19.70 13.93 10.00 7.20 5.13 1 4 9 4 0 0 22 17 8 1226 801 552 415 270 75 194 129 112 ACTUAL LY HA PPE NED # OF HITT ING STRE AKS 2263 2 1447 0 9151 6081 4059 2645 1792 5 1.48 ACTUAL LY HA PPE NED 22 19 16 AVG STA N. DEV. IN THE 10,00 0 RANDOM SOR TINGS 55.90 39.36 2258 4.63 1408 6.60 8947 .64 5766 .29 3759 .81 2477 .50 1647 .42 1104 .86 747.1 2 506.8 5 347.1 3 141 112 89 72 59 48 39 32 27 13 11 8.9 7.5 6.2 238.6 9 164.9 7 114.2 2 79.80 1.4 1.2 5.3 4.4 3.7 0.74 3.2 2.7 2.3 1.9 1.6 13.32 5.84 2.60 1.21 1.21 IN THE 10,00 0 RANDOM SOR TINGS AVG 6276 5.96 7620 .99 STA N. DEV. 150.6 9 69.45 30.71 1957 -200 6 LENGTH 5 6 7 8 9 10 11 12 13 14 15 16 17 18 19 20 21 22 23 24 25 26 27 28 29 30 31 32 33 34 35+ 1957 -200 6 LENGTH PROB. 5+ 1.000 0 10+ 1.000 0 15+ 0.988 0 20+ 0.162 0 25+ 0.033 6 30+ 0.002 2 35+ 0.028 1 3.12 1.47 1.47 10,0 00 SORTINGS-- STARTS ONLY AVG 6710 2 9280 STA N. DEV. 151.0 0 75.50 34.40 306 213 149 105 1.62 1.40 5.97 5.18 4.35 3.68 3.14 2.64 2.25 1.92 52.2 43.3 35.8 29.8 14.5 12.2 10.0 8.54 7.20 25.1 20.5 17.2 AVG STA N. DEV. 10,0 00 SORTINGS-- STARTS ONLY 74.2 52.5 2255 7 1474 3 9721 6466 4335 2920 1979 1349 924 636 440 141 115 93.1 76.6 62.8 ACTUAL LY HA PPE NED # OF HITT ING STRE AKS 2263 2 1447 0 9151 6081 4059 2645 1792 1226 801 552 415 270 75 194 129 112 52 38 5.10 3.70 2.68 1.95 1.44 1.05 0.77 37.2 26.6 19.0 13.7 9.82 7.04 1 4 9 4 0 0 22 17 8 7 7 25 1.21 1.03 19 5 # OF HITT ING STRE AKS 274 62 1472 259.0 0 49.40 10.10 2.19 1394 8410 6480 3 5 2.19 ACTUAL LY HA PPE NED 0.87 15.20 6.88
Original Paper
Loading high-quality paper...
Comments & Academic Discussion
Loading comments...
Leave a Comment