Markov switching multinomial logit model: an application to accident injury severities
In this study, two-state Markov switching multinomial logit models are proposed for statistical modeling of accident injury severities. These models assume Markov switching in time between two unobserved states of roadway safety. The states are disti…
Authors: ** Nataliya V. Malyshkina, Fred L. Mannering (Purdue University, School of Civil Engineering) **
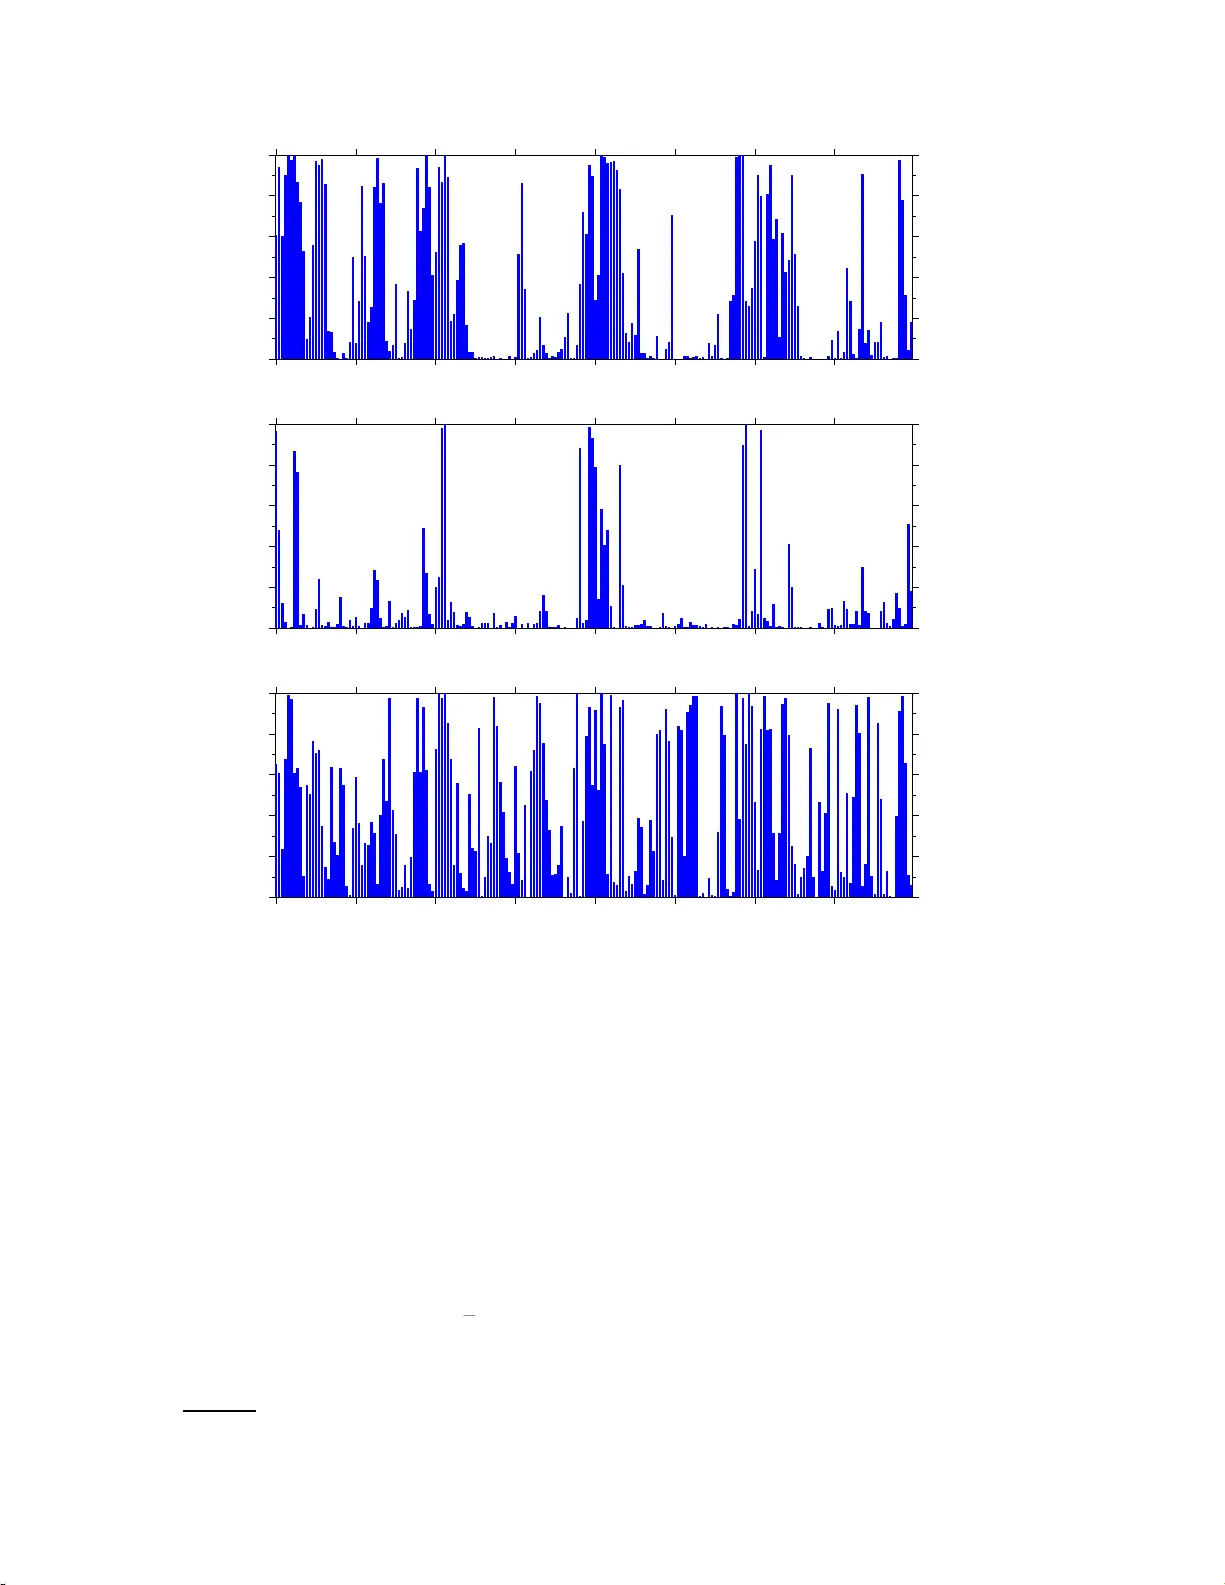
Mark o v switc hing m ultinomial logit mo del: an application to accid en t injury sev erities Natal iy a V. Maly shk ina ∗ , F red L. Mannering Scho ol of Civil Engine ering, 550 Stad iu m Mal l Drive, Pur due University, West L afayette, IN 4790 7, Unite d Sta tes Abstract In this study , tw o-state Mark ov switc hin g m ultinomial logit mo dels are prop osed for statistic al mo deling of a ccident injury sev erities. These mo d els assume Mark o v switc hing in time b et we en t wo unobserved states of roadwa y s afety . The states are distinct, in the sense that in differen t states acciden t sev erit y outcomes are generated b y separate multinomial logit pro cesses. T o demonstrate the applicabilit y of the approac h presente d h er ein, t wo -state Mark o v switc h ing multinomia l logit mo dels are estimated for seve rit y outcomes of acciden ts o ccurring on Indiana roads o ver a four-y ear time in terv al. Ba ye s ian inf er en ce metho ds and Mark ov Chain Mon te Carlo (MCMC) sim ulations are used for mo del estimation. The estimate d Marko v switc hing mo dels result in a sup erior statisti cal fit relativ e to the standard (single- state) m u ltinomial logit mo dels. It is foun d that the more fr equen t state of r oadw a y safet y is correlated with b ette r w eather conditions. The less f r equen t state is foun d to b e correlated with adv erse weather conditions. Key wor ds: Acciden t in jury sev erit y; multinomial logit; Mark ov switc h ing; Ba y esian; MCMC 1 In tr o duction V ehicle acciden ts result in prop ert y damage, injuries and loss of p eople lives . Th us, researc h efforts in predicting acciden t sev erit y ar e clearly v ery imp or- tan t. In the pa st there ha s b een a large n umber of studies that fo cused o n mo d- eling a ccide nt sev erit y outcomes. Common mo deling approac hes of acciden t ∗ Corresp onding author. Email addr esses: nmalyshk@purd ue.edu (Nataliy a V. Malyshkina), flm@ecn. purdue.edu (F red L. Mannering). Preprint su bmitted to Acciden t Analysis and Preve n tion sev erit y include multinomial logit mo dels, nested logit mo dels, mixed logit mo dels and ordered probit mo dels (O’Donnell and Connor, 1996; Shank ar and Mannering, 1996; Shank ar et al., 1996; D uncan et al., 1998; Chang and Mannering , 1999; Carson and Mannering, 2001; Khattak, 2001; Khatta k et al., 2002; Ko ck elman and Kw eon, 2002; Lee and Mannering, 2002; Ab del-A ty, 2003; Kw eon and Ko c ke lman , 2003; Ulfarsson and Mannering, 2004; Y a mamoto and Shank ar, 200 4; Khorashadi et a l., 2005; Eluru and Bhat, 2007; Sav olainen and Mannering, 2007; Milton et al., 2008). All these mo dels in v olve nonlinear r egr ession of the observ ed acciden t injury sev erit y outcomes on v arious acciden t c haracteristics and related factor s (suc h as roa dw ay and driv er c haracteristics, en vironmen tal factors, etc). In our earlier pap er, Malyshkina et al. (20 08), whic h w e will refer t o as P a - p er I, w e presen t ed t w o-state Mark ov switc hing coun t data mo dels of acciden t frequencies. In this study , whic h is a con tin uation of our w o rk on Marko v switc hing mo dels, w e presen t tw o- state Mark o v switc hing mu ltinomial logit mo dels f or predicting acciden t sev erit y outcomes. These mo dels assume t hat there are t wo unobserv ed states of roadwa y safet y , roadw a y entities (road- w ay segmen t s) can switc h b etw een these stat es o ver time, and the switc hing pro cess is Mark ovian. The t w o states in tend to a ccoun t for p ossible hetero- geneit y effects in roadw a y safet y , whic h ma y b e caused b y v arious unpre- dictable, uniden tified, unobserv able risk factors tha t influence roadwa y safet y . Because the risk factors can in teract and c hange, roadw ay entities can switc h b et w een the t wo states o ver time. Tw o-stat e Mark ov switc hing m ultinomial logit mo dels assume separate m ultino mial logit pro ces ses for acciden t sev erity data generation in the t w o states and, therefore, allo w a researc her to study the heterogeneit y effects in ro a dw a y saf ety . 2 Mo del sp ecification Mark ov switch ing mo dels are parametric and can b e fully sp ecified b y a lik e- liho o d function f ( Y | Θ , M ), whic h is the conditional probabilit y distribution of the v ector of all observ a tions Y , giv en the v ector of all parameters Θ of mo del M . First, let us consider Y . Let N t b e the n um b er of acciden ts ob- serv ed during time p erio d t , where t = 1 , 2 , . . . , T and T is the tot a l n umber of time p eriods. Let there b e I discrete outcomes observ ed for acciden t sev er- it y (for example, I = 3 and these outcomes are fat a lit y , injury and prop erty damage only). Let us in tr o duce acciden t sev erity outcome dummies δ ( i ) t,n that are equal to unity if the i th sev erit y outcome is o bserv ed in the n th acciden t that o ccurs during time p erio d t , and to zero otherwise. Here i = 1 , 2 , . . . , I , n = 1 , 2 , . . . , N t and t = 1 , 2 , . . . , T . Then, our o bserv ations a r e the a ccide n t sev erit y o utcomes, and the vec tor of all observ a tions Y = { δ ( i ) t,n } includes all outcomes observ ed in a ll acciden ts that o ccur during all time p erio ds. Sec- ond, let us consider mo del sp ecific ation v ariable M . It is M = { M , X t,n } 2 and includes the mo del’s name M (for example, M = “multinomial logit”) and the v ector X t,n of all a ccide n t c haracteristic v ariables (w eather and env i- ronmen t conditions, v ehicle and driv er c haracteristics, roadw ay and pa veme n t prop erties, and so on). T o define the lik eliho o d function, w e first in tro duce an uno bserv ed (laten t) state v ariable s t , whic h determines the state of all ro adw a y en tities during time p erio d t . At eac h t , the state v ariable s t can assume o nly t w o v alues: s t = 0 corresp onds to one state and s t = 1 corresp onds to the other state ( t = 1 , 2 , . . . , T ). The state v ariable s t is assumed to follo w a stationar y tw o- state Mark ov c hain pro cess in time, 1 whic h can b e sp ecified b y time-indep enden t transition probabilities as P ( s t +1 = 1 | s t = 0) = p 0 → 1 , P ( s t +1 = 0 | s t = 1) = p 1 → 0 . (1) Here, for example, P ( s t +1 = 1 | s t = 0) is the conditional probability of s t +1 = 1 at t ime t + 1 , give n that s t = 0 at t ime t . T ra nsition probabilities p 0 → 1 and p 1 → 0 are unkno wn parameters to b e estimated from acciden t sev erity data. The statio nary unconditional probabilities of states s t = 0 and s t = 1 are ¯ p 0 = p 1 → 0 / ( p 0 → 1 + p 1 → 0 ) and ¯ p 1 = p 0 → 1 / ( p 0 → 1 + p 1 → 0 ) resp ectiv ely . 2 Without loss of generality , w e assume that (on av erage) state s t = 0 o ccurs more or equally frequen tly than state s t = 1. Therefore, ¯ p 0 ≥ ¯ p 1 , and w e obtain restriction 3 p 0 → 1 ≤ p 1 → 0 . (2) W e refer to states s t = 0 and s t = 1 as “more frequen t” and “less frequen t” states resp ectiv ely . Next, a tw o- state Mark ov switc hing m ultinomial logit (MSML) mo del assumes m ultinomial logit (ML) data- generating pro cesse s f or acciden t sev erity in eac h of the t w o states. With this, the probabilit y of the i th sev erit y outcome ob- serv ed in the n th acciden t during time p erio d t is 1 Mark o v pr operty means that the probabilit y distribution of s t +1 dep ends only on th e v alue s t at time t , but not on th e previous history s t − 1 , s t − 2 , . . . . Stationarit y of { s t } is in the statistic al sense. 2 These can b e fou n d from stationarit y conditions ¯ p 0 = (1 − p 0 → 1 ) ¯ p 0 + p 1 → 0 ¯ p 1 , ¯ p 1 = p 0 → 1 ¯ p 0 + (1 − p 1 → 0 ) ¯ p 1 and ¯ p 0 + ¯ p 1 = 1. 3 Without any loss of generalit y , restriction (2) is introdu ced for the pu rp ose of a vo id ing the pr oblem of state lab el sw itc h ing 0 ↔ 1. This problem would otherwise arise b ecause of the symm etry of Eqs. (1)–(4) un d er the lab el switc hing. 3 P ( i ) t,n = exp( β ′ (0) ,i X t,n ) P I j =1 exp( β ′ (0) ,j X t,n ) if s t = 0 , exp( β ′ (1) ,i X t,n ) P I j =1 exp( β ′ (1) ,j X t,n ) if s t = 1 , (3) i = 1 , 2 , . . . , I , n = 1 , 2 , . . . , N t , t = 1 , 2 , . . . , T , Here prime means tra nsp ose (so β ′ (0) ,i is the transp ose of β (0) ,i ). P arameter v ectors β (0) ,i and β (1) ,i are unknown estimable parameters of the tw o standard m ultinomial log it probability mass functions (W ashington et al., 2 003) in the t wo states, s t = 0 and s t = 1 r espectiv ely . W e set the first comp onen t of X t,n to unit y , and, therefore, the first comp onen ts of v ectors β (0) ,i and β (1) ,i are the in tercepts in the tw o states. In addition, without loss of generality , we set all β -parameters for the last sev erit y outcome to zero, 4 β (0) ,I = β (1) ,I = 0 . If acciden t eve n ts are assumed to b e indep enden t, the lik eliho o d function is f ( Y | Θ , M ) = T Y t =1 N t Y n =1 I Y i =1 h P ( i ) t,n i δ ( i ) t,n . (4) Here, because the state v ariables s t,n are unobserv able, the v ector of all es- timable parameters Θ m ust include all states, in addition to mo del para meters ( β -s) and transition probabilities. Th us, Θ = [ β ′ (0) , β ′ (1) , p 0 → 1 , p 1 → 0 , S ′ ] ′ , where v ector S = [ s 1 , s 2 , ..., s T ] ′ has length T and contains a ll state v alues. Eqs. (1)- (4) define the tw o-state Mark ov switch ing multinomial lo git (MSML) mo del considered here. 3 Mo del estimation metho ds Statistical estimation of Marko v switc hing mo dels is complicated by unobserv- abilit y of the state v ariables s t . 5 As a result, the traditional maxim um lik eli- ho o d estimation ( MLE) pro cedure is of v ery limited use for Mark o v switc hing mo dels. Instead, a Ba ye sian inference approac h is used. Give n a mo del M with lik eliho o d function f ( Y | Θ , M ), t he Bay es form ula is f ( Θ | Y , M ) = f ( Y , Θ |M ) f ( Y |M ) = f ( Y | Θ , M ) π ( Θ |M ) R f ( Y , Θ |M ) d Θ . (5) 4 This can b e done b ecause X t,n are assumed to b e indep endent of the outcome i . 5 Belo w we will ha ve 208 time p erio ds ( T = 208). In this case, there are 2 208 p ossible com binations for v alue of v ector S = [ s 1 , s 2 , ..., s T ] ′ . 4 Here f ( Θ | Y , M ) is the p osterior probability distribution of mo del parameters Θ conditional on the observ ed data Y and mo del M . F unction f ( Y , Θ |M ) is the join t pro babilit y distribution o f Y and Θ giv en mo del M . F unction f ( Y |M ) is the marginal lik eliho o d function – the pro ba bilit y distribution of data Y give n mo del M . F unction π ( Θ |M ) is the prior proba bilit y distribution of parameters that reflects prior kno wledge ab out Θ . The in tuition b ehind Eq. (5) is straightforw a rd: giv en mo del M , the p osterior distribution accoun ts for b oth the observ ations Y and our prior kno wledge of Θ . In our study (and in most practical studies), the direct application of Eq. (5) is not feasible b ecause the para meter v ector Θ contains to o man y comp onen ts, making integration ov er Θ in Eq. (5) extreme ly difficult. Ho wev er, the p oste- rior distribution f ( Θ | Y , M ) in Eq. (5 ) is kno wn up to its normalization con- stan t, f ( Θ | Y , M ) ∝ f ( Y | Θ , M ) π ( Θ | M ). As a result, w e use Marko v Chain Mon te Carlo (MCMC) sim ulations, whic h pro vide a con venie nt and practi- cal computational metho dology for sampling from a probabilit y distribution kno wn up to a constan t (the p osterior distribution in o ur case). Giv en a large enough p osterior sample of para meter v ector Θ , any p osterior exp ectatio n and v ariance can b e found a nd Ba yes ia n inference can b e readily applied. A reader in terested in details is referred to our P ap er I or to Malyshkina (200 8), where w e describ e our c hoice of t he prio r distribution π ( Θ |M ) and the MCM C sim- ulation algorithm. 6 Although, in this study we estimate a t w o - state Mark ov switc hing m ultinomial logit mo del for acciden t sev erity o utcomes a nd in P a- p er I w e estimated a tw o-state Marko v switc hing negativ e binomial mo del for acciden t frequencies, this difference is not essen tial for the Ba y esian-MCMC mo del estimation metho ds. In f act, the main difference is in the like liho o d function (m ultinomial lo g it as opp osed to nega tiv e binomial). So w e used the same our own nume r ical MCMC co de, written in the MA TLAB programming language, for mo del estimation in b oth studies. W e tested our co de on arti- ficial data sets of acciden t sev erity outcomes. The t est pro cedure included a generation of artificial data with a kno wn mo del. Then these data w ere used to estimate the underlying mo del b y means of our sim ulation co de. With this pro cedure w e found that the MSML mo dels, used to generate the artificial data, w ere repro duced successfully with our estimation co de. F o r comparison of differen t mo dels we use a formal Ba y esian approac h. L et there b e t wo mo dels M 1 and M 2 with par a meter v ectors Θ 1 and Θ 2 resp ec- tiv ely . Assuming that w e ha v e equal preferences of these mo dels, their prior probabilities are π ( M 1 ) = π ( M 2 ) = 1 / 2. In this case, the ratio of the mo dels’ p osterior probabilities, P ( M 1 | Y ) and P ( M 2 | Y ), is equal to the Bay es fac- tor. The later is defined as t he ratio of the mo dels’ marginal lik eliho o ds (see Kass and Raftery, 1995). Th us, w e ha ve 6 Our priors for β -s, p 0 → 1 and p 1 → 0 are flat or nearly fl at, wh ile the prior for the states S reflects the Mark o v pro cess prop erty , sp ecified b y Eq. (1). 5 P ( M 2 | Y ) P ( M 1 | Y ) = f ( M 2 , Y ) /f ( Y ) f ( M 1 , Y ) /f ( Y ) = f ( Y |M 2 ) π ( M 2 ) f ( Y |M 1 ) π ( M 1 ) = f ( Y |M 2 ) f ( Y |M 1 ) , (6) where f ( M 1 , Y ) and f ( M 2 , Y ) are the joint distributions of the mo dels and the data, f ( Y ) is the unconditional distribution of the data . As in P ap er I, to calculate the marg inal lik eliho o ds f ( Y |M 1 ) and f ( Y |M 2 ), w e use the harmonic mean form ula f ( Y |M ) − 1 = E [ f ( Y | Θ , M ) − 1 | Y ], where E ( . . . | Y ) means p osterior exp ectation calculated b y using the p osterior distribution. If the ratio in Eq. (6) is larger than one, then mo del M 2 is fa vored, if the ratio is less than o ne, then mo del M 1 is fav ored. An adv an ta ge of the use of Ba yes factors is tha t it has an inherent p enalt y for including to o man y parameters in the mo del and guar ds ag ainst ov erfitting. T o ev aluate the p erformance of mo del {M , Θ } in fitting the observ ed data Y , w e carry out the P earson’s χ 2 go o dness-of-fit test (Maher and Summersgill , 1996; Co w an , 19 98; W o o d, 2 002; Press et al., 2 0 07). W e p erform t his t est b y Mon te Carlo sim ulations to find the distribution o f the P earson’s χ 2 quan- tit y , whic h measures the discrepancy b et w een the observ ations and the mo del predictions ( Cow an, 1 9 98). This distribution is then used t o find the g o o dnes s- of-fit p-v alue, whic h is the probabilit y that χ 2 exceeds the observ ed v alue of χ 2 under the h yp othesis that the mo del is true (the observ ed v alue of χ 2 is calculated by using the observ ed data Y ). F or additional details, please see Malyshkina (2008). 4 Empirical results The sev erit y outcome of an a cciden t is determined by the injury lev el sustained b y the most injured individual ( if any) in v olv ed into the acciden t. In this study w e consider three acciden t sev erit y outcomes: “fa talit y”, “inj ur y” and “PDO (prop ert y damage only)”, whic h w e n um b er as i = 1 , 2 , 3 respectiv ely ( I = 3). W e use data from 811 720 acciden ts that we r e observ ed in Indiana in 2003- 2 006. As in Paper I, w e use w eekly time p erio ds, t = 1 , 2 , 3 , . . . , T = 208 in total. 7 Th us, the state s t can change eve r y w eek. T o increase the predictiv e p o w er of our mo dels, we consider acciden ts separately for eac h combination of acci- den t t yp e (1-vehic le and 2-vehic le) and roadwa y class (inte rstate high wa ys, US routes, state r outes, count y roads, streets). W e do not consider a ccide n ts with more than t w o v ehicles in v olve d. 8 Th us, in total, there are ten roadwa y-class- acciden t-ty p e com binations that w e consider. F or eac h roadwa y-class-acciden t - 7 A w eek is from S unda y to Saturda y , there are 208 f ull weeks in the 2003-2006 time int er v al. 8 Among 811720 acciden ts 24101 1 (29.7%) are 1-v ehicle, 525035 (64.7%) are 2- v ehicle, and only 45674 (5.6%) are acciden ts with more than t wo v ehicles inv olv ed. 6 t yp e combination the following three types of acciden t frequency mo dels are estimated: • First, we estimate a standard multinomial logit ( ML) mo del without Mark ov switc hing b y maxim um likelihoo d estimation (MLE). 9 W e refer to this mo del as “ML-by-MLE”. • Second, w e estimate the same standard m ultinomial logit mo del by the Ba ye sian inference approac h and the MCMC simulations. W e refer to this mo del as “ML-by -MCMC”. As one exp ects, the estimated ML-by-MCM C mo del turned out to b e v ery similar to the corresp onding ML-b y-MLE mo del (estimated for the same roadw ay -class-acciden t-type com bina t ion). • Third, we estimate a tw o- state Mark ov switc hing multinomial lo git (MSML) mo del by the Ba yes ian-MCMC metho ds. In order to make comparison of ex- planatory v ariable effects in differen t mo dels straightforw ard, in the MSML mo del w e use only t ho se explanatory v ariables that en ter the corresp onding standard ML mo del. 10 T o obtain the final MSML mo del rep orted here, we also consecutiv ely construct and use 60%, 85% and 95% Bay esian credible in terv als f or ev aluation of the statistical significance of eac h β - parameter. As a result, in the final mo del some comp onen ts of β (0) and β (1) are re- stricted to zero or restricted to b e the same in the t wo states. 11 W e refer to this final mo del a s “MSML”. Note that the tw o states, and th us the MSML mo dels, do not ha v e to exist for ev ery roadw ay - class-accide n t-type com bination. F or example, they will not exist if all estimated mo del parameters turn out to b e statistically the same in the t w o states, β (0) = β (1) , (whic h suggests the t w o states are iden tical and the MSML mo dels r educe to the corresp onding standar d ML mo dels). Also, the t wo states will not exist if all estimated state v ar ia bles s t turn out to b e close to zero, resulting in p 0 → 1 ≪ p 1 → 0 [compare to Eq. (2)], then the less 9 T o obtain parsimonious s tand ard mo dels, estimated b y MLE, w e c ho ose the explanatory v ariables and their d ummies by u s ing the Ak aike Information Criterion (AIC) and th e 5% statistical significance lev el for the t wo-ta iled t-test. Minimization of AI C = 2 K − 2 LL , we r e K is the num b er of free con tinuous mo del p aramete r s and LL is the log-l ik eliho o d, ensur es an optimal c h oic e of explanatory v ariables in a mo del and a voi ds o verfitting (Tsa y , 2002; W ash ington et al., 2003). F or details on v ariable select ion, see Malyshkina (2006). 10 A formal Ba ye sian approac h to mo del v ariable selection is based on ev aluation of mo del’s marginal lik eliho o d and the Bay es fact or (6 ). Unfortunately , b ecause MCMC sim ulations are computationally exp ensive , ev aluation of marginal lik eli- ho o ds for a large num b er of trial mo dels is n ot feasible in our stud y . 11 A β -parameter is restricted to zero if it is s tatistically insignificant . A β -parameter is restricted to b e the same in the t wo states if the difference of its v alues in the t wo states is statistically insignifican t. A (1 − a ) credible interv al is chosen in such w ay that the p osterior probabilities of b eing b elow and ab o ve it are b oth equal to a/ 2 (w e use significance leve ls a = 40% , 15 % , 5%). 7 frequen t state s t = 1 is not realized and the pro cess sta ys in state s t = 0. T urning to the estimation results, the findings show that tw o states o f roadwa y safet y and the appropriate MSML mo dels exist for sev erit y outcomes of 1- v ehicle acciden ts o ccurring on all roadw ay classes (in terstate high wa ys, US routes, state routes, count y roads, streets), and for sev erity outcomes of 2 - v ehicle acciden ts o ccurring on streets. W e did not find t wo states in the cases of 2-v ehicle acciden ts o n inters t a te high w ays , US routes, state routes and coun t y roads (in these cases all estimated state v ariables s t w ere found to b e close to zero). The mo del estimation results for sev erity outcomes of 1-ve hicle a ccide n ts o ccurring on in terstate high w ay s, US routes and state routes are giv en in T ables 1 – 3. All contin uous mo del para meters ( β -s, p 0 → 1 and p 1 → 0 ) are give n together with their 95% confidence interv als (if MLE) or 9 5 % credible in t erv als (if Bay esian-MCMC), refer to the sup erscript and subsc ript n umbers adjacen t to parameter estimates in T a bles 1 – 3. 12 T able 4 giv es summary statistics of all roadw ay a ccide n t c haracteristic v ariables X t,n (except the in tercept). 12 Note that MLE assumes asymptotic normalit y of the estimates, resu lting in con- fidence in terv als b eing symmetric around the means (a 95% confidence inte r v al is ± 1 . 96 stand ard deviations around the mean). In con trast, Bay esian estimation do es not require this assumption, and p osterior distributions of parameters and Ba yesia n credible interv als are u sually non-symmetric. 8 T ab le 1 Estimation results for multinomial logit mo dels of s everit y outcomes of one-v ehicle accident s on Indiana in terstate high wa ys (the sup erscrip t and sub script num b ers to the righ t of individual parameter estimates are 95% confidence/credible interv als) MSML c V ariable ML-b y -MLE a ML-by-MCMC b state s = 0 state s = 1 fatali t y injury fata lity injury fatali t y i njury fa tality injury In tercept (constant term) − 11 . 9 − 10 . 1 − 13 . 7 − 3 . 69 − 3 . 53 − 3 . 84 − 12 . 4 − 10 . 6 − 14 . 5 − 3 . 72 − 3 . 56 − 3 . 88 − 12 . 2 − 10 . 5 − 14 . 4 − 3 . 98 − 3 . 79 − 4 . 17 − 12 . 2 − 10 . 5 − 14 . 4 − 3 . 22 − 2 . 98 − 3 . 45 Summer season (dummy) . 235 . 329 . 142 . 235 . 329 . 142 . 237 . 329 . 143 . 237 . 329 . 143 . 176 . 293 . 0551 . 176 . 293 . 0551 . 176 . 293 . 0551 . 615 . 959 . 282 Th ursday (dumm y) − . 798 − . 115 − 1 . 48 – − . 853 − . 206 − 1 . 59 – − . 872 − . 225 − 1 . 61 – − . 872 − . 225 − 1 . 61 – Construction at the acciden t lo cation (dummy ) − . 418 − . 213 − . 623 − . 418 − . 213 − . 623 − . 425 − . 224 − . 632 − . 425 − . 224 − . 632 − . 566 − . 319 − . 822 − . 566 − . 319 − . 822 − . 566 − . 319 − . 822 – Da ylight or street li gh ts are li t up if dark (dummy) − . 392 − . 0368 − . 748 . 137 . 224 . 0501 − . 387 − . 0301 − . 740 . 143 . 230 . 0568 − . 378 − . 0236 − . 729 . 139 . 226 . 0522 − . 378 − . 0236 − . 729 . 139 . 226 . 0522 Precipitation: r ain/freezing rain/snow/sleet/ hail (dumm y) − 1 . 38 − . 830 − 1 . 92 − . 361 − . 264 − . 457 − 1 . 41 − . 884 − 1 . 99 − . 363 − . 267 − . 460 − 1 . 54 − 1 . 03 − 2 . 10 − . 563 − . 404 − . 729 − 1 . 54 − 1 . 03 − 2 . 10 – Roadw ay surface is cov ered by snow/slush (dummy) − 1 . 28 − . 0917 − 2 . 46 − . 432 − . 280 − . 583 − 1 . 43 − . 328 − 2 . 84 − . 438 − . 288 − . 590 − . 0515 − . 361 − . 671 − . 0515 − . 361 − . 671 − . 0515 − . 361 − . 671 − . 0515 − . 361 − . 671 Roadw ay median i s driv able (dummy) . 571 . 929 . 213 – . 577 . 939 . 223 – . 566 . 930 . 211 – . 566 . 930 . 211 – Roadw ay is at curve (dummy) . 114 . 212 . 0165 . 114 . 212 . 0165 . 116 . 213 . 0186 . 116 . 213 . 0186 – – – – Primary cause of the acciden t i s driver-related (dumm y) 4 . 24 5 . 30 3 . 18 1 . 53 1 . 64 1 . 43 4 . 39 5 . 64 3 . 39 1 . 54 1 . 64 1 . 43 4 . 48 5 . 73 3 . 48 2 . 00 2 . 18 1 . 84 4 . 48 5 . 73 3 . 48 . 715 . 946 . 468 Help arri v ed in 20 minutes or less after the crash (dummy) . 790 . 887 . 693 . 790 . 887 . 693 . 790 . 891 . 691 . 790 . 891 . 691 . 785 . 886 . 684 . 785 . 886 . 684 . 785 . 886 . 684 . 785 . 886 . 684 The vehicle at fault is a motorcycle (dummy) 3 . 88 4 . 59 3 . 17 2 . 74 3 . 12 2 . 36 3 . 87 4 . 57 3 . 13 2 . 75 3 . 15 2 . 37 4 . 61 5 . 49 3 . 74 3 . 23 3 . 83 2 . 70 – 1 . 39 2 . 49 . 326 Age of the vehicle at f ault (in ye ars) . 0285 . 0370 . 0201 . 0285 . 0370 . 0201 . 0286 . 0370 . 0201 . 0286 . 0370 . 0201 – . 0286 . 0371 . 0200 – . 0286 . 0371 . 0200 Number of o ccupan ts in the ve hicle at fault . 366 . 463 . 269 . 123 . 159 . 0859 . 367 . 465 . 264 . 123 . 159 . 0861 . 366 . 464 . 263 . 124 . 161 . 0874 . 366 . 464 . 263 . 124 . 161 . 0874 Roadw ay trav eled by the vehicle at fault is multi-lane and divided tw o-wa y (dummy) 2 . 60 4 . 00 1 . 20 – 2 . 86 4 . 63 1 . 56 – 2 . 86 4 . 66 1 . 56 – 2 . 86 4 . 66 1 . 56 – At least one of the vehicles i n volv ed was on fire (dumm y) 1 . 24 2 . 12 − . 345 − . 0257 − . 665 1 . 18 2 . 02 . 206 − . 345 − . 0335 − . 669 1 . 66 2 . 56 . 621 − . 332 − . 0198 − . 659 – − . 332 − . 0198 − . 659 Gender of the driver at fault (dummy) – . 328 . 410 . 246 – . 331 . 413 . 248 – . 224 . 338 . 107 – . 479 . 637 . 328 9 T ab le 1 (Con tinued) MSML c V ariable ML-by-MLE a ML-by-MCMC b state s = 0 sta te s = 1 fatali t y injury fatali t y injury fata lity injury f atality injury Probability of severit y outcome [ P ( i ) t,n give n by Eq. (3)], a v eraged o ver all v alues of explanatory v ariables X t,n – – . 00724 . 176 . 0073 3 . 174 . 00672 . 192 Marko v transition probability of jump 0 → 1 ( p 0 → 1 ) – – . 151 . 254 . 0704 Marko v transition probability of jump 1 → 0 ( p 1 → 0 ) – – . 330 . 532 . 164 Unconditional probabilities of states 0 and 1 ( ¯ p 0 and ¯ p 1 ) – – . 683 . 814 . 540 and . 317 . 460 . 186 T otal n umber of fr ee model parameters ( β -s) 25 25 28 Po sterior av erage of the log-likelihoo d (LL) – − 8486 . 78 − 8480 . 82 − 8494 . 61 − 8396 . 78 − 8379 . 21 − 8416 . 57 Max( LL ): estimated max. log-likelihoo d (LL) for MLE; maximum observ ed v alue of LL for Ba ye si an-MCMC − 8465 . 79 (MLE) − 8476 . 37 (observ ed) − 8358 . 97 (observed ) Logarithm of marginal likelihoo d of data (ln[ f ( Y |M )]) – − 8498 . 46 − 8494 . 22 − 8499 . 21 − 8437 . 07 − 8424 . 77 − 8440 . 02 Goo dness-of-fit p-v alue – 0 . 255 0 . 222 Maximum of the p oten tial scale reduction factors (PSRF) d – 1 . 00302 1 . 00060 Multiv ariate p oten tial scale reduction factor (MPSRF) d – 1 . 00325 1 . 00067 Number of av ailable observ ations acciden ts = f ata lities + i njuries + PDOs: 19094 = 143 + 3369 + 15582 a Standard (conv ent ional) multinomial logit (ML) mo del estimated by maximum likelihoo d estimation (MLE). b Standard multinomial l ogit (ML) model estimated by Marko v Chain Mont e Carl o (MCMC) simulations. c Two -state Marko v switching multinomial logit (MSML) mo del estimated by Marko v Chain Monte Carlo (MCM C) simulations. d PSRF/MPSRF are calculated separately/jointly for all contin uous mo del parameters. PSRF and M PSRF are close to 1 for con verged MCMC chains. 10 T ab le 2 Estimation results for multinomial logit mo dels of s everit y outcomes of one-v ehicle accident s on Indiana US routes (the sup erscrip t and sub script num b ers to the righ t of individual parameter estimates are 95% confidence/credible interv als) MSML c V ariable ML-by-MLE a ML-by-MCMC b state s = 0 state s = 1 fatali t y injury f atality injury fatality i njury fatal it y injury In tercept (constant term) − 6 . 51 − 5 . 00 − 8 . 03 − 2 . 13 − 1 . 79 − 2 . 47 − 6 . 62 − 5 . 16 − 8 . 14 − 2 . 12 − 1 . 78 − 2 . 47 − 5 . 72 − 4 . 69 − 6 . 92 − 2 . 05 − 1 . 71 − 2 . 40 − 5 . 72 − 4 . 69 − 6 . 92 − 2 . 79 − 2 . 37 − 3 . 23 Summer season (dummy) . 514 . 894 . 134 . 200 . 305 . 0947 . 509 . 883 . 124 . 200 . 305 . 0951 . 190 . 300 . 0789 . 190 . 300 . 0789 . 190 . 300 . 0789 – Da ylight or street li gh ts are li t up if dark (dummy) − . 498 − . 142 − . 855 . 194 . 287 . 101 − . 492 − . 136 − . 848 . 203 . 296 . 110 − . 493 − . 136 − . 857 . 197 . 290 . 105 – . 19 7 . 290 . 105 Sno wi ng weather (dummy) − 1 . 17 − . 170 − 2 . 18 – − 1 . 30 − . 357 − 2 . 47 – − 1 . 10 − . 151 − 2 . 27 . 165 . 317 . 0115 − 1 . 10 − . 151 − 2 . 27 . 165 . 317 . 0115 No roadw ay j unct i on at the acciden t lo cation (dummy) . 701 1 . 25 . 149 . 217 . 335 . 0994 . 727 1 . 31 . 199 . 213 . 331 . 0968 . 787 1 . 36 . 259 . 214 . 332 . 0965 . 787 1 . 36 . 259 . 214 . 332 . 0965 Roadw ay is s tr aigh t (dumm y) − . 741 − . 383 − 1 . 10 − . 295 − . 191 − . 399 − . 739 − . 377 − 1 . 09 − . 296 − . 192 − . 399 − 7 . 37 − . 372 − 1 . 09 − . 294 − . 189 − . 398 − 7 . 37 − . 372 − 1 . 09 − . 294 − . 189 − . 398 Primary cause of the acciden t i s en vi ronmen t-related (dummy) − 3 . 45 − 2 . 72 − 4 . 18 − 1 . 89 − 1 . 78 − 1 . 99 − 3 . 51 − 2 . 81 − 4 . 32 − 1 . 89 − 1 . 79 − 2 . 00 − 3 . 59 − 2 . 89 − 4 . 40 − 2 . 09 − 1 . 96 − 2 . 24 − 3 . 59 − 2 . 89 − 4 . 40 − . 701 − . 263 − 1 . 16 Help arri v ed in 10 minutes or less after the crash (dummy) . 594 . 681 . 507 . 594 . 681 . 507 . 562 . 650 . 475 . 562 . 650 . 475 . 560 . 648 . 472 . 560 . 648 . 472 . 560 . 648 . 472 . 560 . 648 . 472 The vehicle at fault is a motorcycle (dummy) 2 . 62 3 . 47 1 . 78 3 . 20 3 . 55 2 . 86 2 . 57 3 . 38 1 . 65 3 . 21 3 . 56 2 . 87 3 . 22 3 . 58 2 . 88 3 . 22 3 . 58 2 . 88 3 . 22 3 . 58 2 . 88 3 . 22 3 . 58 2 . 88 Age of the vehicle at f ault (in ye ars) . 0363 . 0444 . 0283 . 0363 . 0444 . 0283 . 0367 . 0448 . 0287 . 0367 . 0448 . 0287 – . 0366 . 0447 . 0285 – . 0366 . 0447 . 0285 Speed li mit (used if known and the same f or all vehicles i n volv ed) . 0363 . 0631 . 00950 . 0121 . 0178 . 00640 . 0373 . 0643 . 0117 . 0118 . 0176 . 00616 . 0285 . 0495 . 0104 . 0102 . 0178 . 00635 – . 0120 . 0178 . 00635 Roadw ay trav eled by the vehicle at fault is tw o- lane and one-w ay (dummy) − . 216 . 0417 − . 391 − . 216 . 0417 − . 391 − . 223 . 0517 − . 398 − . 223 . 0517 − . 398 − . 224 . 0504 − . 401 − . 224 . 0504 − . 401 − . 224 . 0504 − . 401 − . 224 . 0504 − . 401 At least one of the vehicles i n volv ed was on fire (dumm y) 1 . 19 1 . 94 . 439 – 1 . 13 1 . 85 . 315 – 1 . 27 1 . 98 . 452 – 1 . 27 1 . 98 . 452 – Age of the driver at fault (in yea rs) . 0114 . 0213 . 00150 – . 0113 . 0211 . 00137 – . 0101 . 0200 . 000054 2 – – – W eekda y (Monda y through F r ida y) (dummy) – − . 104 . 0116 − . 196 – − . 104 . 0124 − . 196 – − . 125 . 0242 − . 227 – – Gender of the driver at fault (dummy) – . 27 2 . 362 . 183 – . 27 6 . 365 . 186 – . 280 . 369 . 190 – . 28 0 . 369 . 190 11 T ab le 2 (Con tinued) MSML c V ariable ML-by-MLE a ML-by-MCMC b state s = 0 sta te s = 1 fatali t y injury fatali t y injury fata lity injury f atality injury Probability of severit y outcome [ P ( i ) t,n give n by Eq. (3)], a v eraged o ver all v alues of explanatory v ariables X t,n – – . 00747 . 179 . 0082 3 . 183 . 0021 8 . 158 Marko v transition probability of jump 0 → 1 ( p 0 → 1 ) – – . 0767 . 157 . 0269 Marko v transition probability of jump 1 → 0 ( p 1 → 0 ) – – . 613 . 864 . 337 Unconditional probabilities of states 0 and 1 ( ¯ p 0 and ¯ p 1 ) – – . 887 . 959 . 770 and . 113 . 230 . 0409 T otal n umber of fr ee model parameters ( β -s) 24 24 25 Po sterior av erage of the log-likelihoo d (LL) – − 7406 . 39 − 7400 . 61 − 7414 . 03 − 7349 . 06 − 7335 . 46 − 7364 . 47 Max( LL ): estimated max. log-likelihoo d (LL) for MLE; maximum observ ed v alue of LL for Ba ye si an-MCMC − 7384 . 05 (MLE) − 7396 . 37 (observ ed) − 7318 . 21 (observed ) Logarithm of marginal likelihoo d of data (ln[ f ( Y |M )]) – − 7417 . 98 − 7413 . 72 − 7420 . 23 − 7377 . 49 − 7369 . 62 − 7380 . 00 Goo dness-of-fit p-v alue – 0 . 337 0 . 255 Maximum of the p oten tial scale reduction factors (PSRF) d – 1 . 00319 1 . 00073 Multiv ariate p oten tial scale reduction factor (MPSRF) d – 1 . 00376 1 . 00085 Number of av ailable observ ations acciden ts = f ata lities + i njuries + PDOs: 17797 = 138 + 3184 + 14485 a Standard (conv ent ional) multinomial logit (ML) mo del estimated by maximum likelihoo d estimation (MLE). b Standard multinomial l ogit (ML) model estimated by Marko v Chain Mont e Carl o (MCMC) simulations. c Two -state Marko v switching multinomial logit (MSML) mo del estimated by Marko v Chain Monte Carlo (MCM C) simulations. d PSRF/MPSRF are calculated separately/jointly for all contin uous mo del parameters. PSRF and M PSRF are close to 1 for con verged MCMC chains. 12 T ab le 3 Estimation results for multinomial logit mo dels of s everit y outcomes of one-v ehicle accident s on Indiana state routes (the sup erscrip t and sub script num b ers to the righ t of individual parameter estimates are 95% confidence/credible interv als) MSML c V ariable ML-by-MLE a ML-by-MCMC b state s = 0 state s = 1 fatali t y injury fatali t y injury fatali t y injury fata lity injur y In tercept (constant term) − 3 . 98 − 3 . 66 − 4 . 30 − 1 . 67 − 1 . 53 − 1 . 80 − 4 . 03 − 3 . 71 − 4 . 36 − 1 . 71 − 1 . 58 − 1 . 85 − 3 . 44 − 3 . 10 − 3 . 79 − 1 . 68 − 1 . 54 − 1 . 81 − 4 . 96 − 4 . 15 − 5 . 96 − 1 . 68 − 1 . 54 − 1 . 81 Summer season (dummy) . 232 . 307 . 156 . 232 . 307 . 156 . 232 . 307 . 157 . 232 . 307 . 157 . 238 . 314 . 163 . 238 . 314 . 163 . 238 . 314 . 163 . 238 . 314 . 163 Roadw ay t ype (dummy: 1 if urban, 0 if rural ) − . 390 − . 302 − . 478 − . 390 − . 302 − . 478 − . 395 − . 306 − . 483 − . 395 − . 306 − . 483 – − . 385 − . 296 − . 474 − 2 . 05 − . 954 − 3 . 62 − 3 . 85 − . 296 − . 474 Da ylight or street li gh ts are li t up if dark (dummy) − . 646 − . 408 − . 884 . 193 . 261 . 125 − . 641 − . 404 − . 879 . 199 . 267 . 132 − . 689 − . 448 − . 931 – − . 689 − . 448 − . 931 . 277 . 378 . 177 Precipitation: r ain/freezing rain/snow/sleet/ hail (dumm y) − . 854 . 466 − 1 . 24 – − . 868 − . 494 − 1 . 27 – − . 829 − . 448 − 1 . 24 – − . 829 − . 448 − 1 . 24 – Roadw ay median i s driv able (dummy) − . 583 − . 225 − . 940 – − . 596 − . 250 − . 964 – − . 589 − . 241 − . 960 – − . 589 − . 241 − . 960 – Roadw ay is s tr aigh t (dumm y) − . 284 − . 214 − . 353 − . 284 − . 214 − . 353 − . 283 − . 214 − . 352 − . 283 − . 214 − . 352 − . 117 − . 0184 − . 214 − . 117 − . 0184 − . 214 − . 117 − . 0184 − . 214 − . 465 − . 360 − . 573 Primary cause of the acciden t i s en vi ronmen t-related (dummy) − 4 . 23 − 3 . 59 − 4 . 86 − 1 . 83 − 1 . 76 − 1 . 91 − 4 . 28 − 3 . 67 − 4 . 97 − 1 . 84 − 1 . 76 − 1 . 91 − 4 . 40 − 3 . 79 − 5 . 10 − 2 . 30 − 2 . 16 − 2 . 44 − 4 . 40 − 3 . 79 − 5 . 10 − 1 . 41 − 1 . 26 − 1 . 55 Help arri v ed in 20 minutes or less after the crash (dummy) . 840 . 917 . 762 . 840 . 917 . 762 . 863 . 945 . 781 . 863 . 945 . 781 – . 861 . 944 . 778 1 . 64 2 . 64 . 856 . 861 . 944 . 778 The vehicle at fault is a motorcycle (dummy) 3 . 10 3 . 31 2 . 89 3 . 10 3 . 31 2 . 89 3 . 10 3 . 31 2 . 89 3 . 10 3 . 31 2 . 89 3 . 37 3 . 66 3 . 09 3 . 37 3 . 66 3 . 09 3 . 37 3 . 66 3 . 09 2 . 82 3 . 19 2 . 47 Number of o ccupan ts in the ve hicle at fault . 0557 . 0850 . 0265 . 0557 . 0850 . 0265 . 0565 . 0858 . 0276 . 0565 . 0858 . 0276 . 0942 . 138 . 0528 . 0942 . 138 . 0528 . 0942 . 138 . 0528 – At least one of the vehicles i n volv ed was on fire (dumm y) 1 . 90 2 . 45 1 . 33 . 456 . 780 . 133 1 . 87 2 . 42 1 . 28 . 447 . 768 . 124 1 . 87 2 . 43 1 . 28 . 461 . 782 . 137 1 . 87 2 . 43 1 . 28 . 461 . 782 . 137 Age of the driver at fault (in yea rs) 14 . 6 21 . 4 7 . 80 × 10 − 3 − 2 . 80 − . 800 − 4 . 70 × 10 − 3 14 . 5 21 . 3 7 . 67 × 10 − 3 − 2 . 71 − . 723 − 4 . 69 × 10 − 3 14 . 5 21 . 4 7 . 63 × 10 − 3 − 2 . 46 − . 469 − 4 . 44 × 10 − 3 14 . 5 21 . 4 7 . 63 × 10 − 3 − 2 . 46 − . 469 − 4 . 44 × 10 − 3 Gender of the driver at fault (dummy) − . 496 − . 211 − . 780 . 279 . 344 . 214 − . 505 − . 225 − . 794 . 278 . 343 . 213 − . 473 − . 192 − . 764 . 283 . 348 . 218 − . 473 − . 192 − . 764 . 283 . 348 . 218 Age of the vehicle at f ault (in ye ars) – . 0334 . 0392 . 0276 – . 0335 . 0393 . 0277 – . 0332 . 0390 . 0274 – . 0332 . 0390 . 0274 license s tate of the veh i cle at fault is a U.S. state except Indiana and its neighboring states (IL, KY, OH, MI)” indicator v ariable – − . 449 − . 217 − . 681 – − . 444 − . 217 − . 679 – − . 436 − . 208 − . 671 – − . 436 − . 208 − . 671 13 T ab le 3 (Con tinued) MSML c V ariable ML-by-MLE a ML-by-MCMC b state s = 0 sta te s = 1 fatali t y injury fatali t y injury fatali t y injury f atality injury Probability of severit y outcome [ P ( i ) t,n give n by Eq. (3)], a v eraged o ver all v alues of explanatory v ariables X t,n – – . 0089 . 179 . 00951 . 180 . 00804 . 179 Marko v transition probability of jump 0 → 1 ( p 0 → 1 ) – – . 335 . 465 . 216 Marko v transition probability of jump 1 → 0 ( p 1 → 0 ) – – . 450 . 610 . 313 Unconditional probabilities of states 0 and 1 ( ¯ p 0 and ¯ p 1 ) – – . 574 . 681 . 504 and . 426 . 496 . 319 T otal n umber of fr ee model parameters ( β -s) 22 22 28 Po sterior av erage of the log-likelihoo d (LL) – − 1 3867 . 40 − 13861 . 92 − 13874 . 73 − 13781 . 76 − 13765 . 02 − 13800 . 89 Max( LL ): estimated max. log-likelihoo d (LL) for MLE; maximum observ ed v alue of LL for Ba ye si an-MCMC − 13846 . 60 (MLE) − 13 858 . 00 (observed) − 13745 . 61 (observe d) Logarithm of marginal likelihoo d of data (ln[ f ( Y |M )]) – − 13877 . 89 − 13874 . 24 − 13880 . 38 − 13820 . 20 − 13808 . 85 − 13821 . 73 Goo dness-of-fit p-v alue – 0 . 515 0 . 445 Maximum of the p oten tial scale reduction factors (PSRF) d – 1 . 00027 1 . 00029 Multiv ariate p oten tial scale reduction factor (MPSRF) d – 1 . 00041 1 . 00045 Number of av ailable observ ations acciden ts = fatalities + i njuries + PDOs: 33528 = 302 + 6018 + 27208 a Standard (conv ent ional) multinomial logit (ML) mo del estimated by maximum likelihoo d estimation (MLE). b Standard multinomial l ogit (ML) model estimated by Marko v Chain Mont e Carl o (MCMC) simulations. c Two -state Marko v switching multinomial logit (MSML) mo del estimated by Marko v Chain Monte Carlo (MCM C) simulations. d PSRF/MPSRF are calculated separately/jointly for all contin uous mo del parameters. PSRF and M PSRF are close to 1 for con verged MCMC chains. 14 The top, middle and b ottom plots in Figure 1 sho w w eekly p osterior pro ba - bilities P ( s t = 1 | Y ) of the less frequen t state s t = 1 fo r the MSML mo dels estimated for sev erit y of 1-vehic le a ccide nts o ccurring on interstate high w ay s, US ro utes and state ro utes resp ectiv ely . 13 Because of space limitations, in this pap er w e do not rep ort estimation results for sev erity of 1 -v ehicle acciden t s on coun ty roads and streets, and fo r sev erity of 2-vehic le acciden ts. Ho we ver, b e- lo w w e discuss our findings for all roa dwa y-class-acciden t-ty p e com binations. F o r unrep orted mo del estimation results see Malyshkina (2008). W e find that in all cases when the t w o states and Mark o v switc hing m ulti- nomial logit (MSML) mo dels exist, these mo dels are strongly f a v ored by the empirical data o ver the corresponding standard m ultinomial logit (ML) mo d- els. Indeed, from lines “marginal LL ” in T ables 1 – 3 we see that the MSML mo dels provide considerable, ranging from 40 . 5 to 61 . 4 , impro veme nts of the logarithm of the marginal lik eliho o d of the data as compared to the corre- sp onding ML mo dels. 14 Th us, from Eq. (6) w e find that, g iv en the acciden t sev erit y data, the p osterior probabilities of the MSML mo dels are larger than the probabilities of the corresp onding ML mo dels b y factors ra nging from e 40 . 5 to e 61 . 4 . In the cases of 1-v ehicle acciden t s on coun ty roads, streets a nd the case of 2-ve hicle acciden ts on streets, MSML mo dels (not rep orted here) are also strongly fa vored by the empirical da t a o v er the corresp onding ML mo dels (Malyshkina, 2008). Let us no w consider the maxim um like liho o d estimation (MLE) of the standard ML mo dels and an imaginary MLE estimation of the MSML mo dels. W e find that, in this imaginary case, a classical statistics approa c h for mo del comparison, based on the MLE, w ould also fav ors the MSML mo dels ov er the standard ML mo dels. F o r example, refer to line “max( LL )” in T able 1 g iv en for the case of 1-v ehicle acciden ts on in terstate high wa ys. The MLE gav e the maximum log- lik eliho o d v alue − 8465 . 79 for the standard ML mo del. The maxim um lo g-lik eliho o d v alue o bserv ed during our MCMC simulations for the MSML mo del is equal to − 835 8 . 97. An imaginary MLE, at its conv ergence, w ould give a MSML log-lik eliho o d v a lue that would b e ev en larger than this observ ed v alue. Therefore, if estimated by the MLE, the MSML mo del w ould pro vide la r g e, at least 106 . 82 impro v ement in the maxim um log- lik eliho o d v alue ov er the corresp onding ML mo del. This impro v emen t w ould come with only mo dest increase in the num b er of free con tinuous mo del parameters ( β - s) tha t en ter the lik eliho o d function (refer to T able 1 under “# free par.” ). 13 Note that these p osterior probabilities are equal to the p osterior exp ecta tions of s t , P ( s t = 1 | Y ) = 1 × P ( s t = 1 | Y ) + 0 × P ( s t = 0 | Y ) = E ( s t | Y ). 14 W e use the harm onic m ean f orm ula to calculate the v alues and the 95% confidence in terv als of the log-marginal-lik eliho o ds giv en in lines “marginal LL ” of T ables 1–3. The confidence inte r v als are cal culated by b o otstrap sim u lations. F or details, see P ap er I or Malyshkina (2008). 15 Jan−03 Jul−03 Jan−04 Jul−04 Jan−05 Jul−05 Jan−06 Jul−06 0 0.2 0.4 0.6 0.8 1 Date P(S t =1|Y) Jan−03 Jul−03 Jan−04 Jul−04 Jan−05 Jul−05 Jan−06 Jul−06 0 0.2 0.4 0.6 0.8 1 Date P(S t =1|Y) Jan−03 Jul−03 Jan−04 Jul−04 Jan−05 Jul−05 Jan−06 Jul−06 0 0.2 0.4 0.6 0.8 1 Date P(S t =1|Y) Fig. 1. W eekly p osterior probabilities P ( s t = 1 | Y ) for the MSML mo dels estimated for seve r it y of 1-v eh icle acci d en ts on in terstate high w ays (top p lot), US routes (mid- dle plot) and state routes (b ottom plot). Similar argumen ts hold for comparison of MSML and ML mo dels estimated for other roadw ay-class-accide nt-t yp e com binations (see T ables 2 and 3). T o ev aluate the go o dness-of-fit fo r a mo del, w e use the p osterior (or MLE) estimates of all con tinu ous mo del pa r a meters ( β -s, α , p 0 → 1 , p 1 → 0 ) and generate 10 4 artificial data sets under the h yp othesis that the mo del is true. 15 W e find the distribution of χ 2 and calculate the go o dness-of-fit p-v alue fo r the observ ed v alue of χ 2 . F or details, see Malyshkina (2008). The resulting p-v alues for our mo dels are giv en in T ables 1 – 3. These p-v alues ar e around 00–100%. Therefore, all mo dels fit the data w ell. 15 Note that the state v alues S are generated by u sing p 0 → 1 and p 1 → 0 . 16 No w, refer to T able 5. The first six row s of this table list time-correlation co ef- ficien ts b et wee n p osterior probabilities P ( s t = 1 | Y ) for the six MSML mo dels that exist a nd are estimated for six roadwa y-class-acciden t-t yp e com bina t ions (1-v ehicle acciden ts on in terstate highw ays , US routes, state routes, coun t y roads, streets, a nd 2-v ehicle acciden ts on streets). 16 W e see that the states for 1-v ehicle acciden ts on all high- speed roads (in terstate highw a ys, US routes, state routes and coun t y roads) a re corr elat ed with eac h other. The v alues of the corresponding correlatio n co efficien ts are p ositiv e and range from 0 . 263 to 0 . 688 (see T able 5). This result suggests an existence of common (unobserv- able) factors that can cause switc hing b et w een states of roadw ay safety for 1-v ehicle acciden ts o n all high- sp eed roads. The remaining row s of T able 5 show correlation co efficien ts b et wee n p oste- rior probabilities P ( s t = 1 | Y ) and w eather- condition v ariables. These cor- relations w ere found b y using daily and hourly historical we a ther data in Indiana, av ailable a t the Indiana St a te Climate Office at Purdue Univ ersity (www.agry .purdue.edu/climate). F or these correlations, the precipitation and sno wfall amoun ts are daily amounts in inche s av eraged o v er the w eek and across Indiana weather observ ation stations. 17 The temp erature v ariable is the mean da ily air temp erature ( o F ) a veraged ov er the w eek and a cross the w eather stations. The wind gust v ariable is the maximal instantaneous wind sp eed (mph) measured during the 10 -min ute p erio d just prior to the obser- v ationa l time. Wind gusts are measured ev ery hour and a v erag ed o ve r the w eek and across the w eather stations. The effect of fo g/frost is captured by a dumm y v ariable that is equal to one if and o nly if t he difference b et w een air and dewpoint tempera t ures do es not exceed 5 o F (in this case frost can form if the dewp oin t is b elow the freezing p oint 32 o F , and fog can form otherwise). The fog/frost dummies are calculated for ev ery hour and are a ve ra ged o v er the we ek and across the w eather stations. Finally , visibilit y distance v ariable is the harmonic mean of hourly visibility distances, whic h are measured in miles ev ery hour and a re av erag ed ov er the w eek and across the w eather stations. 18 F r om the results give n in T able 5 w e find t ha t for 1- vehic le acciden ts o n a ll high-sp eed roads (in terstate highw ays, US routes, state routes and coun t y roads), the less frequen t state s t = 1 is p ositiv ely correlated with extreme temp eratures (low during win ter and high during summer), ra in precipitations and sno wfalls, strong wind gusts, fo gs and frosts, lo w visibility distances. It 16 Here and b elo w we calculate we ighted correlation co efficien ts. F or v ariable P ( s t = 1 | Y ) ≡ E ( s t | Y ) we use weigh ts w t in versely p rop ortional to the p osterior standard deviations of s t . That is w t ∝ min { 1 / std( s t | Y ) , median[1 / std( s t | Y )] } . 17 Sno w fall and precipitation amoun ts are w eakly related with eac h other b ecause sno w densit y ( g/cm 3 ) can v ary by more than a factor of ten. 18 The harmonic mean ¯ d of distances d n is calculated as ¯ d − 1 = (1 / N ) P N n =1 d − 1 n , assuming d n = 0 . 25 miles if d n ≤ 0 . 25 m iles. 17 is reasonable to expect that roa dwa y safet y is differen t during bad w eather as compared to b etter w eather, resulting in the tw o-state nature of roadwa y safet y . The r esults of T able 5 suggest that Mark ov switc hing for road safety on streets is v ery differen t from switc hing on all other roadw ay classes. In particular, the states of roadw a y safet y on streets exhibit lo w correlation with states on other ro ads. In addition, only streets exhibit Mark ov switc hing in the case of 2-v ehicle acciden ts. Finally , states of roadw a y safety on streets sho w little correlation with w eat her conditions. A p ossible explanation of these differences is that streets are mostly lo cated in urban areas and they hav e traffic mov ing at speeds lo wer that t ho se on other roads. Next, w e consider the estimation r esults for the stationar y unconditional prob- abilities ¯ p 0 and ¯ p 1 of states s t = 0 a nd s t = 1 fo r MSML mo dels (see Section 2). In the cases of 1-v ehicle acciden ts on in terstate highw ays , US routes and state routes these transition probabilities are listed in lines “ ¯ p 0 and ¯ p 1 ” of T ables 1– 3. In the cases of 1-v ehicle acciden ts on coun ty roads and 1- and 2- v ehicle acciden ts on streets refer to Malyshkina (2008). W e find that the ra t io ¯ p 1 / ¯ p 0 is appro ximately equal to 0 . 46, 0 . 1 3 , 0 . 74, 0 . 25, 0 . 65 a nd 0 . 36 in the cases of 1- v ehicle acciden ts on in terstate high w ay s, US routes, state routes, coun ty roads, streets, and 2- v ehicle acciden ts on streets resp ectiv ely . Th us for some roadw ay-class-accide nt-t yp e comb inations (for example, 1-ve hicle acciden ts on US routes) the less frequen t state s t = 1 is quite rare, while for other combi- nations (for example, 1-ve hicle acciden t s on state routes) state s t = 1 is only sligh tly less fr equen t than state s t = 0. Finally , w e set mo del parameters ( β - s) t o their p osterior means, calculate the probabilities of fatalit y and injury outcomes by using Eq. (3) and av erage these probabilities o ve r all v a lues of the explanatory v ariables X t,n observ ed in the data sample. W e compare these proba bilities across the t wo states of roadw ay safet y , s t = 0 and s t = 1, f or MSML mo dels [refer to lines “ h P ( i ) t,n i X ” in T ables 1 – 3 and to Malyshkina (2008)]. W e find that in man y cases these a ve raged pro ba bilities o f fatality and injury outcomes do not differ ve r y signif- ican tly across the t w o states of roadw a y safet y (the only significan t differences are for fatality probabilities in the cases of 1-v ehicle acciden ts on US routes, coun ty roads a nd streets). This means that in many cases states s t = 0 and s t = 1 are appro ximately equally dangerous as far as acciden t sev erity is con- cerned. W e discuss this result in the next section. 18 5 Conclusions In this study w e found that t wo states of roadw ay safety and Mark ov switc h- ing m ultinomial logit (MSML) mo dels exist for sev erit y of 1- v ehicle a cciden ts o ccurring on high-sp eed roads (in terstate high w ays , US rout es, state routes, coun ty roads), but not f or 2-vehic le acciden ts on high-sp eed roads. One o f p os- sible explanations of this result is that 1- and 2-v ehicle a ccide nts ma y differ in their nature. F or example , on one hand, sev erity of 1- v ehicle acciden ts may frequen tly be determined b y driver-related factors (sp eeding, falling a sleep, driving under the influence, etc). Driv ers’ b eha vior mig ht exhibit a tw o-state pattern. In particular, drivers might b e o v erconfident and/or ha ve difficulties in a djustmen ts to bad we a ther conditions. On the other ha nd, sev erit y of a 2-v ehicle acciden t migh t crucially dep end on the actual ph ysics inv olv ed in the collision b etw een the t wo cars (for example, head-o n and side impacts are more dangerous than rear-end collisions). As far as slo w-sp eed streets are con- cerned, in this case b oth 1- and 2-v ehicle acciden t s exhibit t wo-state natur e for their sev erit y . F urther studies are needed to understand these results. In this study , the imp ortant result is that in all cases when tw o states of roadw a y safet y exist, the tw o-state MSML mo dels provid e muc h sup erior statistical fit for acciden t sev erity outcomes as compared to the standard ML mo dels. W e found that in many cases states s t = 0 and s t = 1 are appro ximately equally dangerous as f ar as acciden t sev erity is concerned. This result holds despite the fact that state s t = 1 is correlated with adv erse weather conditions. A lik ely and simple explanation of this finding is that during bad weather b oth n umber of serious a ccide n ts (fatalities and injuries) and num b er of minor acciden ts (PDOs) increase, so that their relative fraction sta ys appro ximately steady . In addition, most drivers a re rational and they a r e lik ely take some precautions while driving during bad w eather. F rom the results presen ted in P ap er I w e kno w that the total num b er of a cciden ts significan t ly increases during adv erse w eather conditions. Th us, driver’s precautions are pro bably not sufficien t to av oid increases in acciden t rates during bad weather. References Ab del-A t y , M., 2003. Analysis of drive r injury sev erit y lev els at multiple lo- cations using ordered probit mo dels. Journal of Safet y Researc h 34(5 ), 597 - 603. Carson, J., Mannering, F .L ., 2001 . The effect o f ice w arning signs on ice- acciden t frequencies and sev erities. Acciden t Analysis and Prev en tion 33(1), 99-109. Chang, L.- Y., Mannering, F.L., 1999. Analysis of injury sev erit y and v ehicle 19 o ccupancy in truc k- and non-t ruc k-in v olv ed acciden ts. Accide nt Analysis and Prev ention 31(5) , 579- 592. Co w a n, G., 1998. Stat istical Data Analysis. Clarendon Press, Oxford Univ. Press, USA Duncan, C., Khatta k, A., Council, F., 19 9 8. Applying the ordered probit mo del to injury sev erity in truck-passe ng er car rear-end collisions. T ransp ortation Researc h Record 16 35, 63-71 . Eluru, N., Bhat, C., 2007. A joint econometric analysis of seat b elt use and crash-related injury sev erity . Acciden t Analysis and Prev ention 39 (5), 103 7- 1049. Kass, R.E., Raftery , A.E., 1995. Bay es F actors. Journal of t he American Sta- tistical Asso ciat io n 9 0(430), 773-795. Khattak, A., 2001. Injury sev erit y in m ulti-vehic le r ear-end crashes. T rans- p ortation R esearch R ecord 17 46, 59 -68. Khattak, A., P a wlovic h, D., Souleyrette, R., Hallmark and, S., 2002. F actors related to more sev ere older drive r traffic crash injuries. Journal o f T rans- p ortation Engineering 128(3), 243-24 9. Khorashadi, A., Niemeier, D., Shank ar V., Mannering F .L., 2005 . Differences in rural and urban driver-injury sev erities in acciden ts in volving large truc ks: an exploratory analysis. Acciden t Analysis a nd Preve ntion 37(5), 910-9 21. Ko c k elman, K., Kw eon, Y.-J., 20 02. Driv er Injury Sev erit y: An application of ordered probit mo dels. Acciden t Analysis and Prev en tio n 34( 3 ), 313 - 321. Kw eon, Y.-J., Ko ck elman, K., 2003. Ov erall injury risk to different driv ers: com bining exp osure, frequency , and sev erity mo dels. Acciden t Analysis a nd Prev en tion 35(4), 414-45 0. Lee, J., Mannering, F.L., 2002 . Impact o f ro adside features on the f r equency and sev erity o f run-o ff-roadw ay acciden ts: an empirical analysis. Acciden t Analysis and Prev en tion 34(2), 149-1 6 1. Maher M. J., Summersgill, I., 1996. A comprehensiv e metho dology for the fitting of predictiv e acciden t mo dels. Accid. Anal. Prev. 28(3), 281-296 . Malyshkina, N.V., 2006. Influence of sp eed limit on roadwa y safet y in Indiana. MS thesis, Purdue Univ ersit y . Malyshkina, N. V., 2008. Mark o v switc hing mo dels: an application of to r o ad- w ay safet y . PhD thesis, Purdue Univ ersit y . h ttp://arxiv.org/abs/080 8.1448 Malyshkina, N.V., Mannering, F.L., T arko, A.P ., 2 008. Mark ov switc hing mo d- els: an application to Mark ov switc hing negativ e binomial mo dels: an appli- cation to v ehicle acciden t frequencies . Accepted for publication in Acciden t Analysis and Prev en tion. h ttp:// a rxiv.org/abs/0811.1606 Milton, J., Shank ar, V., Mannering, F.L., 2008. High w ay acciden t sev erities and the mixed log it mo del: an explorato ry empirical analysis. Acciden t Analysis and Prev en tion 40(1), 260-2 6 6. O’Donnell, C., Connor, D., 1996. Predicting the sev erit y of moto r v ehicle ac- ciden t injuries using mo dels of ordered m ultiple choice. Acciden t Analysis and Prev ention 28(6) , 739- 753. Press, W. H., T euk olsky , S. A., V etterling, W. T., Flannery B. P ., 2007. Nu- 20 merical Recip es 3 rd Edition: The Art of Scientific Computing. Cam bridge Univ. Press, UK. Sa volainen, P ., Mannering, F.L., 2007. Probabilistic mo dels of motorcyclists’ injury sev erities in single- and m ulti-ve hicle crashes. Acciden t Analysis and Prev en tion 39(5), 955-96 3. Shank ar, V., Mannering, F.L., 199 6. An exploratory m ultinomial logit ana lysis of single-v ehicle motorcycle acciden t sev erity . Journal of Sa fet y Researc h 27(3), 183-194. Shank ar, V., Mannering, F.L., Barfield, W., 1996. Statistical analysis of ac- ciden t sev erity on rura l freew ays. Acciden t Analysis a nd Prev en t ion 28(3), 391-401 . Tsa y , R. S., 20 02. Analysis of financial time series: financial econometrics. John Wiley & Sons, Inc. Ulfarsson, G ., Mannering, F .L., 2004. Differences in male and female injury sev erities in sp ort- ut ility vehic le, miniv an, pic kup and passe ng er car acci- den ts. Acciden t Analysis and Prev en tion 36( 2 ), 135 - 147. W ashington, S.P ., Ka rlaftis, M.G., Mannering, F.L., 2003. Statistical and econometric metho ds for transp ortation data a nalysis . Chapman & Hall/CR C. W o o d, G . R., 2002. Generalised linear acciden t mo dels and go o dness of fit testing. Accid. Anal. Prev. 34, 417-427. Y amamot o, T., Shank ar, V., 2004. Biv aria te ordered-respo nse probit mo del of driv er’s and passenger’s injury sev erities in collisions with fixed ob jects. Acciden t Analysis and Prev ention 36(5), 869- 876. 21 T ab le 4 Summary statistics of roadw a y acciden t c h aracte r istic v ariables V ariable Description h P ( i ) t,n i X probability of i th sev er i t y outcome a veraged ov er al l v alues of explanatory v ariables X t,n p 0 → 1 Marko v transition probability of jump from state 0 to state 1 as time t increases to t + 1 p 1 → 0 Marko v transition probability of jump from state 1 to state 0 as time t increases to t + 1 ¯ p 0 and ¯ p 1 unconditional pr obabilities of states 0 and 1 # free par. tot al num b er of fr ee model co efficien ts ( β -s) a veraged LL posterior av erage of the log-li k eliho od (LL) max( LL ) for M LE it is the maximal v alue of LL at conv ergence; for Bay esian-MCM C estimation it is the maximal observ ed v alue of LL during the M CMC simulations marginal LL logarithm of marginal likelihoo d of data, ln[ f ( Y |M )], given mo del M max(PSRF) maximu m of the p oten tial scale reduction factors (PSRF) calculated separately for all con tinuous m odel parameters, PSRF is close to 1 for conv erged MC M C ch ains MPSRF m ultiv ariate PSRF calculated jointly f or all par ameters, close to 1 for conv erged MC M C accept. r ate a verage rate of acceptance of candidate v alues dur i ng Metrop olis-Hasting MCM C draws # observ. n umber of observ ations of acciden t severit y outcomes av ailable in the data sampl e age0 ”age of the driver at fault is < 18 yea rs” indicator v ariable (dumm y) age0o ”age of the oldest driver inv olve d into the acciden t is < 18 years” indicator v ariable cons ”const ruction at the acciden t l ocation” indicator v ariable curv e ”r oad is at curv e” indicator v ariable dark ” dar k time with no street l igh ts” indicator v ariable darklamp ”dark AN D street lights on” i ndicat or v ariable da y ”da yli gh t” indicator v ariable da yt ” da y hours: 9:00 to 17:00” indicator v ariable driv ”road median is driv able” indicator v ariable driver ”primar y cause of the acciden t is driver-related” indicator v ariable dry ”roadw ay surface is dry” indicator v ariable en v ”primary cause of the accident is en vi ronmen t-related” indicator v ariable fog ”fog OR smoke OR smog” indicator v ariable hl10 ”help arr iv ed in 10 mi n utes or less after the crash” indicator v ar iable hl20 ”help arr iv ed in 20 mi n utes or less after the crash” indicator v ar iable Ind ”license state of the ve hicle at fault is Indiana” indicator v ariable int ercept ”consta n t term (intercept )” quan titativ e v ariable jobend ”after work hours: from 16:00 to 19:00” indicator v ariable light ”da yli gh t OR street lights are l i t up if dark” indicator v ariable maxpass ”the l argest num b er of o ccupa nts in all v ehicles i n volv ed” quantita tive v ari able mm ”t wo male dri v ers are inv olved ” indicator v ariable (used only if a 2-vehicle accident ) morn ”morning hours: 5:00 to 9:00” indicator v ariable moto ”the vehicle at f ault is a motorcycle” indicator v ariable 22 T ab le 4 (Con tinued) V ariable Description nigh ”late nigh t hours: 1:00 to 5:00” indicator v ar iable nocons ”no construction at the acciden t lo cation” indicator v ariable no jun ”no road j unct i on at the acciden t lo cation” i ndicato r v ariable nonroad ”non-roadw ay crash (parking l ot, etc.)” indicator v ariable nosig ” no any traffic con tr ol device f or the ve hi cle at fault” i ndicato r v ariable olddrv ”the driver at fault is older than the other driver” indicator v ar. (if a 2-vehicle accident ) oldv age ”age (in y ears) of the oldest veh icle inv olved ” indicator v ariable othUS ”license state of the vehicle at fault is a U. S. state except Indiana and its neighboring states (IL, KY, OH, MI)” indicator v ar iable precip ”precipitation: r ain OR snow OR sl eet OR hail OR freezing rain” i ndicato r v ariable priv ”road trav eled by the vehicle at fault is a pri v ate drive” indicator v ariable r21 ”road trav eled by the vehicle at fault i s tw o-lane AND one-wa y” indicator v ariable rmd2 ”road trav eled by the ve hi cle at fault is multi-lane AND divided tw o-wa y” indicator v ar. singSUV ”one of the tw o v ehicles inv olved is a pickup OR a v an OR a sp ort utility ve hi cle” indicator v ar iable (used only i f a 2-vehicle acciden t) singTR ”one of the t wo vehicles is a truck OR a tractor” indicator v ar . (if a 2-vehicle accident ) slush ”roadwa y surface is co vered by sno w/sl ush” indicator v ariable sno w ”snowing weath er” indicator v ariable str ”road is straight” indicator v ariable sum ”summ er season” indicator v ar iable sund ”Sunda y” indicator v ariable thda y ”Thu rsday” indicator v ar i able v age ”age (in y ears ) of the ve hicle at fault” quantitativ e v ariable v eh ”primary cause of acciden t is vehicle-related” i ndicat or v ariable v oldg ”the vehicle at fault is m ore than 7 years old” indicator v ariable v oldo ”age of the ol dest vehicle inv olved is more than 7 years” indicator v ariable wa ll ”road median is a wall” indicator v ariable wa y4 ”acciden t l ocation is at a 4-wa y intersection” indicator v ariable wint ”win ter season” indicator v ar i able X 12 ”road type” indicator v ariable (1 if urban, 0 if rural) X 27 ”n umber of o ccupa nt s in the veh i cle at fault” quan titative v ariable X 29 ”speed l i mit” quan titativ e v ar. (used if known and the same for all ve hicles inv olved ) X 33 ”at least one of the vehicles i n volv ed was on fire” i ndicat or v ariable X 34 ”age (in yea rs) of the dri v er at fault” quan titative v ariable X 35 ”gender of the driver at fault” i ndicato r v ariable (1 if female, 0 if m ale) 23 T ab le 5 Correlations of the p osterior pr ob ab ilities P ( s t = 1 | Y ) with eac h other and with w eather-condition v ariables (for the MSML m o del) 1-ve hi cle, 1-vehicle, 1-vehicle, 1-v ehicle, 1- vehicle, 2-v ehicle, int erstates US r oute s state r oute s count y roads streets streets 1-ve hi cle, interstate s 1 0 . 418 0 . 293 0 . 606 − 0 . 013 − 0 . 173 1-ve hi cle, US routes 0 . 41 8 1 0 . 263 0 . 688 − 0 . 070 − 0 . 155 1-ve hi cle, state routes 0 . 293 0 . 263 1 0 . 409 − 0 . 047 − 0 . 035 1-ve hi cle, count y roads 0 . 606 0 . 688 0 . 409 1 − 0 . 022 − 0 . 051 1-ve hi cle, streets − 0 . 013 − 0 . 070 − 0 . 047 − 0 . 022 1 0 . 115 2-ve hi cle, streets − 0 . 173 − 0 . 155 − 0 . 035 − 0 . 051 0 . 115 1 All year Precipitation (inc h) − 0 . 139 − 0 . 060 0 . 096 − 0 . 037 0 . 067 0 . 146 T emp erature ( o F ) − 0 . 606 − 0 . 439 − 0 . 234 − 0 . 665 0 . 231 0 . 220 Sno wf all (inch) 0 . 479 0 . 635 0 . 31 9 0 . 723 0 . 003 − 0 . 100 > 0 . 0 (dumm y) 0 . 695 0 . 412 0 . 382 0 . 695 − 0 . 142 − 0 . 131 > 0 . 1 (dumm y) 0 . 532 0 . 585 0 . 328 0 . 847 − 0 . 046 − 0 . 161 Wind gust (mph) 0 . 108 0 . 100 0 . 087 0 . 206 0 . 164 0 . 051 F og / F rost (dumm y) 0 . 093 0 . 164 0 . 19 3 0 . 167 0 . 047 0 . 119 Visibili t y distance (mile) − 0 . 228 − 0 . 221 − 0 . 172 − 0 . 298 − 0 . 019 − 0 . 081 Win ter (Nov ember - Mar c h) Precipitation (inc h) − 0 . 134 − 0 . 037 0 . 027 − 0 . 053 0 . 065 0 . 356 T emp erature ( o F ) − 0 . 595 − 0 . 479 − 0 . 397 − 0 . 735 − 0 . 008 0 . 236 Sno wf all (inch) 0 . 439 0 . 592 0 . 37 5 0 . 645 0 . 157 − 0 . 110 > 0 . 0 (dumm y) 0 . 596 0 . 282 0 . 475 0 . 607 0 . 115 − 0 . 142 > 0 . 1 (dumm y) 0 . 445 0 . 518 0 . 370 0 . 789 0 . 112 − 0 . 210 Wind gust (mph) 0 . 302 0 . 134 0 . 122 0 . 353 0 . 237 0 . 071 F rost (dummy) 0 . 537 0 . 544 0 . 44 0 0 . 716 0 . 052 − 0 . 225 Visibili t y distance (mile) − 0 . 251 − . 304 − 0 . 249 − 0 . 380 − 0 . 155 − 0 . 109 Summer (May - September) Precipitation (inc h) 0 . 000 0 . 006 0 . 259 0 . 096 0 . 047 − 0 . 063 T emp erature ( o F ) 0 . 179 0 . 149 0 . 113 0 . 037 0 . 062 0 . 155 Sno wf all (inch) – – – – – – > 0 . 0 (dumm y) – – – – – – > 0 . 1 (dumm y) – – – – – – Wind gust (mph) − 0 . 126 − . 009 0 . 164 0 . 029 0 . 121 0 . 034 F og (dummy) 0 . 203 0 . 193 0 . 27 5 0 . 101 − 0 . 076 − 0 . 011 Visibili t y distance (mile) − 0 . 139 − 0 . 124 − 0 . 062 − 0 . 009 0 . 077 − 0 . 094 24
Original Paper
Loading high-quality paper...
Comments & Academic Discussion
Loading comments...
Leave a Comment