Approximate mechanism for measuring stability of Internet link in aggregated Internet pipe
In this article we propose a method for measuring internet connection stability which is fast and has negligible overhead for the process of its complexity. This method finds a relative value for representing the stability of internet connections and…
Authors: Vipin M, Mohamed Imran K R
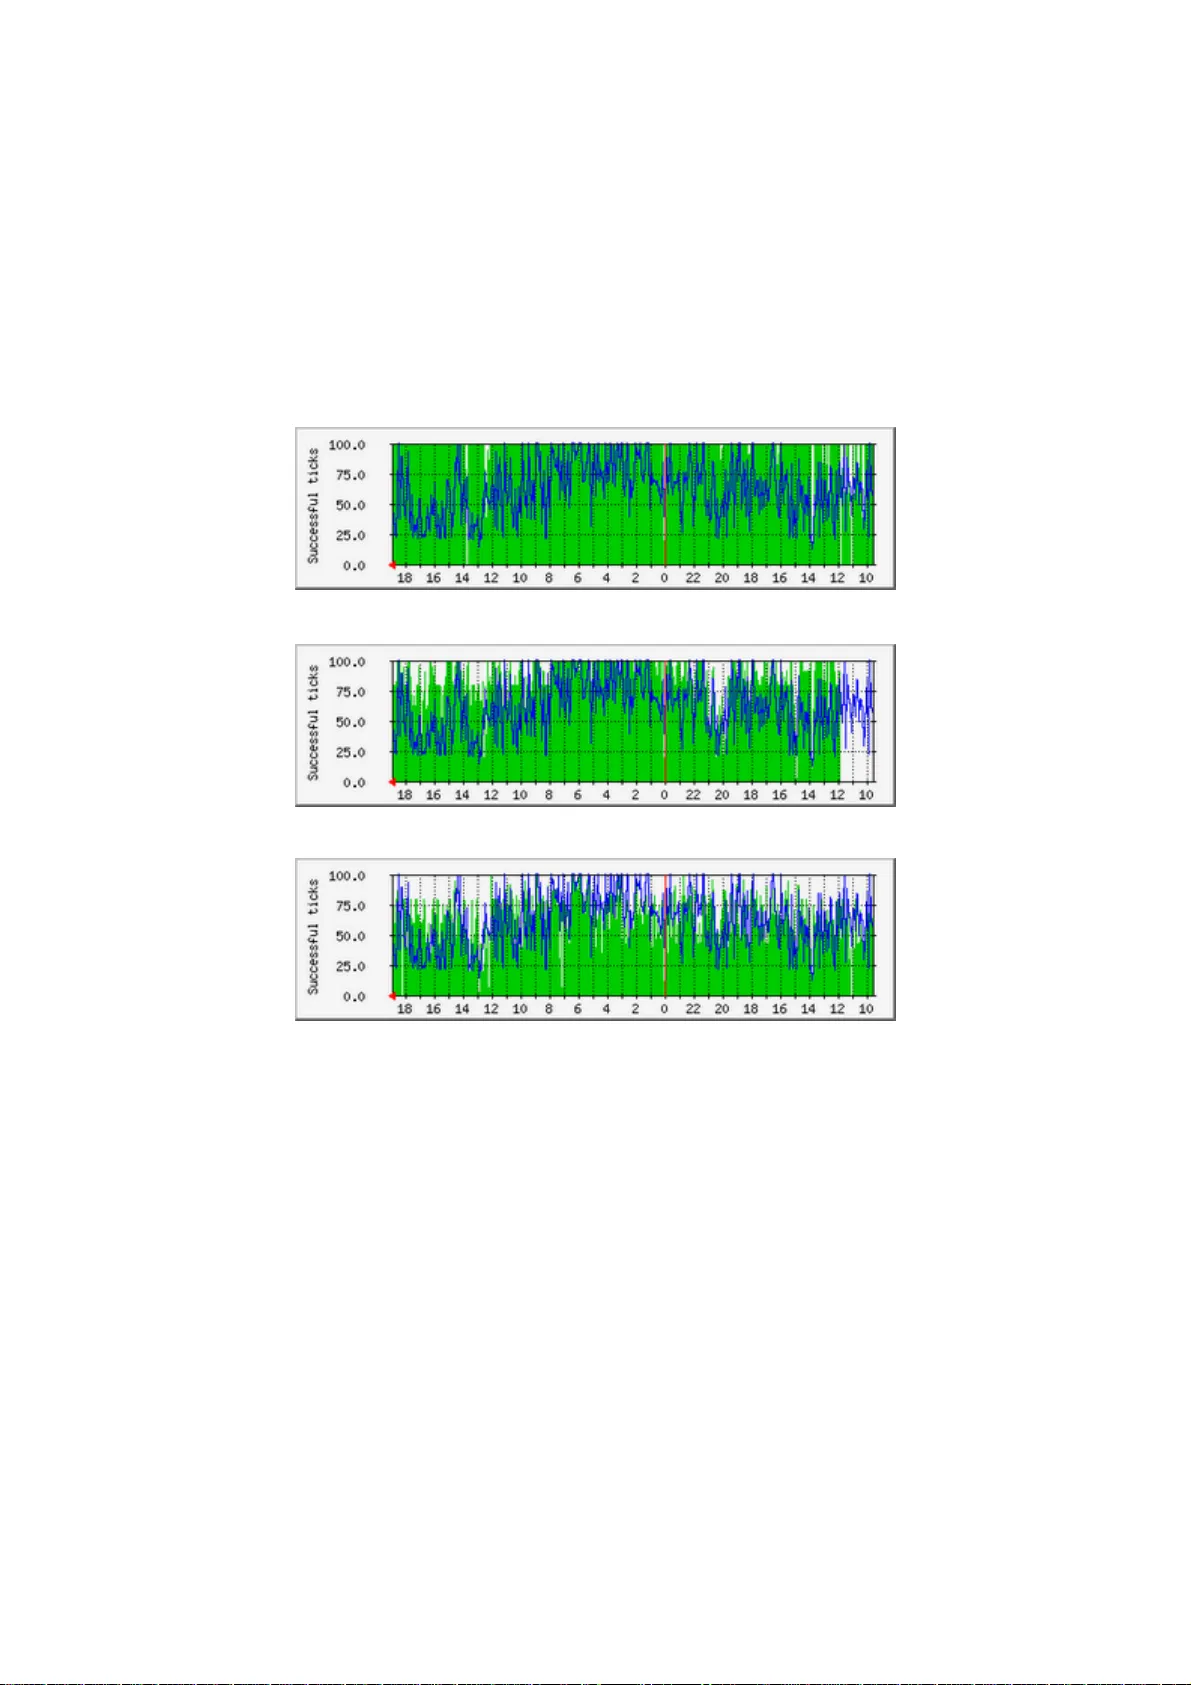
1 Approximate mechanism for measur ing Stability of Internet Link in aggregated Internet Pipe Vipin M, Mohamed Im ran K R {vipintm, moham ed.imran}@au-kbc.org AU-KBC Research Centre, MIT Campus of Anna University, Chennai, TN - INDIA Abstract In this article we propose a method for measuring internet connection stability which is fast and has negligible overhe ad for the process of its c omplexity. This method finds a relative value for repres enting the stability of internet connections and can also be extended for aggregated internet connections. The met hod is documented with help of a real tim e implementation and results are shared. This proposed m easurement schem e uses HTTP GET method for each connection(s). The normalized res ponses to identified sites like gateways of ISP’s, google.com etc are used for calculating current link stability. The novelty of the approach is that historic values are used to calculate overall link stability. In this discussion, we also document a method to use th e calculated values as a dynamic threshold metric. This is used in routing decisions and for load-balancing each of the connections in an aggregated bandwidth pipe. This scheme is a very popular practice in aggregated internet connections. Keyword: Internet measurement, routing, load balancing, failov er Introduction Measuring link stability of individual internet connections in an aggregated pipe is highly recommended in any orga nization network. In an aggr egated network, gateway handles all out-going traffic through multiple Internet connections provisions for load balancing and fail over. Figure 1 2 The out-going Internet connections can be from a single po int or from multiple points. The stability measurement can give idea about per line stability/usability for a given observation time. This value can indicate the p r obability of that particular line to be usable in the future period with by referenci ng the historic values. A simplified edge network for a typical organi zation is shown in Figure 1. The firewall or gateway router handles the connectivity to multip le internet connections. This individual line can be differentiated on bandwidth capacity, pricing and provider etc. These metrics are important in an optimized route selection algor ithm for a better user/serv ice experience. The ISP's provide service agreements on bandwidth and performance guarantees up to their edge routers. The user experience is not limited to the local s ites and local services, so m easuring and accounting performance with respect to world-wide access is required. As a result, we also consider stability and availability of indi vidual connections as important for an optimal user /service experience. The line stability information is suitable as a m e tric in routing decisions i.e. line selection for traffic and this can be achieve efficiently and easy. The measurement over a long period of time can give the complete picture of • Line cost vs. fairness • Contribution of stability from individual connections to the overall aggregated connection stability Scenario of Measurement The most common method of checking link status is by using ping (ICMP). This method provides information like link status to tal round trip time to the specific server which can be defined to be reflective of world-wide access. This method is unable to determine the absolute link details of your Inte rnet Service Provider (ISP) and the user experience as these responses from ICMP are only about layer-3 diagnostic information. Figure 2 3 To measure the user experience, the empl oyed m ethod should mimic the same activity a normal user undertakes which is typ ically a few connections to multiple servers around the globe. These tests find the parameters for each li nk to different servers. As a base for our analysis, we need to identify a list o f server s which are commonly used and have excellent stable responses like Google, Yahoo etc. The Firewall/Gateway (F/G) is con nected to the internet through m ultiple ISPs. Each ISP (ISP 1 – n) can have different r outes of connectivity (depending on their infrastructu re) to all other ISPs across world and they in turn, conne ct to different servers (Server 1 – m). For example, the average fetch time across the serv ers 1 – m for any ISP which is connected to F/G gives a measure of that I SP’s current link stat us. The conditions ar e that the servers should be selected across trans-continen tal links and differe nt ISP providers. Before going to details of measurement sy stem som e terminologi es are explained. Definitions Status: This is a on / off status of the link and is re presented as 0 or 1. If line is aliv e, it is 1 and for dead connection 0, it does not include an y measure of connectivity. This is measured using a HTTP GET request to a st able website in server 1 – m. Tick: This is a relative measuri ng of the link between two limits . This also measured usin g HTTP GET request to stable se rvers 1 – m and the values will be between 0 – m . Example if there are 5 selected servers then, the lin e is on best case 5 and out-o f connection 0, and all other are mapped between these values. Stable Servers (websites): These are the s ites which give consistent performance on all links. E.g.: google.com, yahoo.com etc. Normally m is selected as 10 so there will be 10 different stable servers. Variable Stability Index (S): The represen tative value of stability or the probability of line to be stab le and (S * 100) is the percentage of stability. Line Index or Number (i): This is a number which indicate the line in the case of multiple internet connections. Iteration Number (j): Calculating the S is continues proces s, j represent the Iteration count of the process. Number of Lines (n): This is the maxim um value of i. And i = 1 to n Number of History to consider (k): Num ber of history values to consider in the calculation of Historical Status. Line Status (L): This is 1 or 0. Ticks (T): This is a value between 0 and m. Ticks per iteration (m): This is the maximum value m ap for the Ticks. 4 No of History to calculate consistence value (z ): No of last history to use to calc ulate the constancy effect contributed because of changes in states of lines. Iteration consistence (R): Constancy effect contributed because of changes in states of all lines in j th iteration. Consistency value (C): The constancy effect contributed becau se of changes in states of all lines for last z history states. Measurement Method In this measurement m ethod the most impor tant is calculating th e Tics (T) for each link. This tick is calculated by doing HTTP GET request to 1 - m servers. On successful retrieval of page it is considers as 1 and 0 ot herwise. The status of line (L) calculated form the T as; , 00 10 ij ij ij if T L if T ≤ ⎧ = ⎨ > ⎩ (1) This Line status L i,j represent is the line i is alive or not in j th iteration. This value is used as a mask in the calculation of line stab ility. The method is developed over a long window of observatio n of different factors in multiple internet lines. These lines are diff erentiated by bandwidth, provider and type of connectivity. There are two values are to be calculated 1. Link Stability Index per line 2. Total Internet pipe stability Ind ex Link Stability Index per line The line stability for any line c an calcul ate from four factors, and they are; 1. Line current status 2. Line last known Tick 3. Historical Ticks 4. Inherited effect from other lines The line stability is given as; ,, , 1 , 2 1 ij ij ij ij j SL T H C zm − =× × × × × (2) 1) Line current status (L i,j ) This is a flag for the current sta te and used to nullify the index value to zero when curren t status is out-of-connection. 2) Line last known status (T i,j-1 ) Last known status have highest imp act on current and future status. 5 3) Historical status (H i,j ) It considers the minim um from th e history values and gives the verse state most probable to occur. ,, min jk ij i p pj HT − = ⎡ ⎤ = ⎣ ⎦ (3) 4) Inherited effect from other lines (C i,j ) This is a state wise co unt of all lines as an addictive maximum line state change. The inherited effect from other lines is calculated as the summation of iteration consis ten ce of last z histories. jz jr rj CR − = = ∑ (4) The iteration consistence or the consistence effect over all li nes is found checking the state change between the current state and last known state. ,, 1 1 0 ij ij r f or T T i R other wise − =∀ ⎧ = ⎨ ⎩ (5) The maximum possible value 2 zm × is used as factorizati on to get the probability. Total Internet pipe stability Index The Internet pipe stabilit y Index (IS) is calculated f rom the following facto rs 1. Total last known Tick All lines 2. Total of Link Historical status 3. Inherited effect from all lines And it is given as; , 2 11 1 nn ji j i j j ii I SL H C zm n == =× × × ×× ∑∑ (6) The maximum possible value 2 zm n ×× is used as factorizati on to get the probability. Implementation This is implemented using Perl and Bash sc ripting and general Linux OS utilities [1]. The implementation was tested with three links which included two broadband and a leased line. The main script runs as an infinite loop with a sleeping tim e interval. In every loop it carry out three tasks they are; 1. Determining Ticks 2. Calculating the Stability Index 3. Routing and traffic class modification 6 1. Determining Ticks There will be a list of m servers; in our implementation 10 sites are used. In every iteration j for every line i a HTTP G ET is generated using wget [2] and the return value is checked with in a time out, on success it consider as 1 and 0 otherwise. So the m value vary from 0 – 10. At the same tim e the L i,j also found as in equation (1). 2. Calculating the Stability Index This includes calculation of Internet Pipe stability index and each line stability index calculation. To do so it calculate H i,j first as in equation (3). In th e initial state all the history values are considers as m in our case 10. Then it calculate C i,j by using equation (4), (5). For these calculation we used k=z=10. And H i,j calculation is done for a ll the n lines. And the S ij IS j is calculated. 3. Routing and traffic class modification Based on the IS j and S ij we can optimize a lot of param eters for optimal performance. One of them is per link dynamic loadi ng (based on the line stability). In the initial state the weight to each line is set based on the bandwidth (Bw) factor and it is set in the weighted round robin. And bandwidth factor given as; 1 i i n i i Bw Bwf B w ↑ = ⎡ ⎤ ⎢ ⎥ ⎢ ⎥ = ⎢ ⎥ ⎢ ⎥ ⎣ ⎦ ∑ (7) In each measurement iteration the weight can updated based on the S ij of each line. The dynamic routing weight can be obtained in di fferent way; the method we followed is; 0.95 0.90 0.95 2 0.0 0.90 3 00 ii j i ij ij i ij ij Bwf if S Bwf if S Rw Bwf if S if S ≥ ⎧ ⎪ ⎪ ≤< ⎪ = ⎨ ⎪ << ⎪ ⎪ = ⎩ (8) By changing the routing weight dynamically th e averag e packet sent to each line can be optimized depending on the derived capabilities based on our observations. In case any link is performing poorly because of the ISPs external connectivity pr oblem or internal routing, delays will get affected in the S ij and thus the weight f or that line will get reduced. This modification in weight of round robin will assig n better links for more traffic and th us the user-experien ce is better. Plot of S ij with respect to time for long period give a good understand ing of the link. This plot does not represent bandwidth but represent th e stability of each line and how long or how good the user experience will vary on this line. 7 Link failover decision can be made by watching the S ij . Any time 0 ij S ≤ or the performance is not up to the minimum standard then that line can be removed from the routing path. IS j can be used to decide on critical connecti on establishm ent like VPN etc. Example: It can be used for taking decision to accept any VPN co nnection in a specific line at any given time. In the case of multiple links, th is allows us to determine which link is m ore stable based on the history, to accept a VPN like connection. Like this using the IS j and S ij in the F/G level far more dynamic optimization can be achieved. Figure 3 Figure 4 Figure 5 A three line stability percentage ( 100 ij S × ) Internet pipe stability pe rcentage is shown in the Figure 3, 4 and 5. Figure 3 is Line-1, Figure 4 is Line -2 and Figure 5 is Li ne-3. In the figures the green line is the Line Stabil ity and blue lines are Internet Stability. From the above thr ee graphs the Line-1 is stable and the instability in the total Inte rnet Pipe is contributed from the other two lines because the blue line is e nveloped to those g raphs. At this time S ij of Line-1 is 99% and the other two are less than 90%. Conclusion In this article, we presented a measuremen t method to determine the stability of the internet links. Using our implementation as a reference, we found this m ethod results in optimal usage of m ultiple internet links and results in better user expe rience. 8 Reference [1] “Firewall and Proxy Server HOWTO” (http ://tldp.org/HOWTO/Firewall-HOWTO.html ); TLDP HOW-TO. [2] “Mini HOWTO wget” (http://phoenix.calpoly.edu/~kvoe lker/cis122/Webpage/wget/index.html); by Kurt Voelker
Original Paper
Loading high-quality paper...
Comments & Academic Discussion
Loading comments...
Leave a Comment