A closed-form approximation for the median of the beta distribution
A simple closed-form approximation for the median of the beta distribution Beta(a, b) is introduced: (a-1/3)/(a+b-2/3) for (a,b) both larger than 1 has a relative error of less than 4%, rapidly decreasing to zero as both shape parameters increase.
Authors: J. R. K. R. B., M. L. Smith, A. T. Nguyen
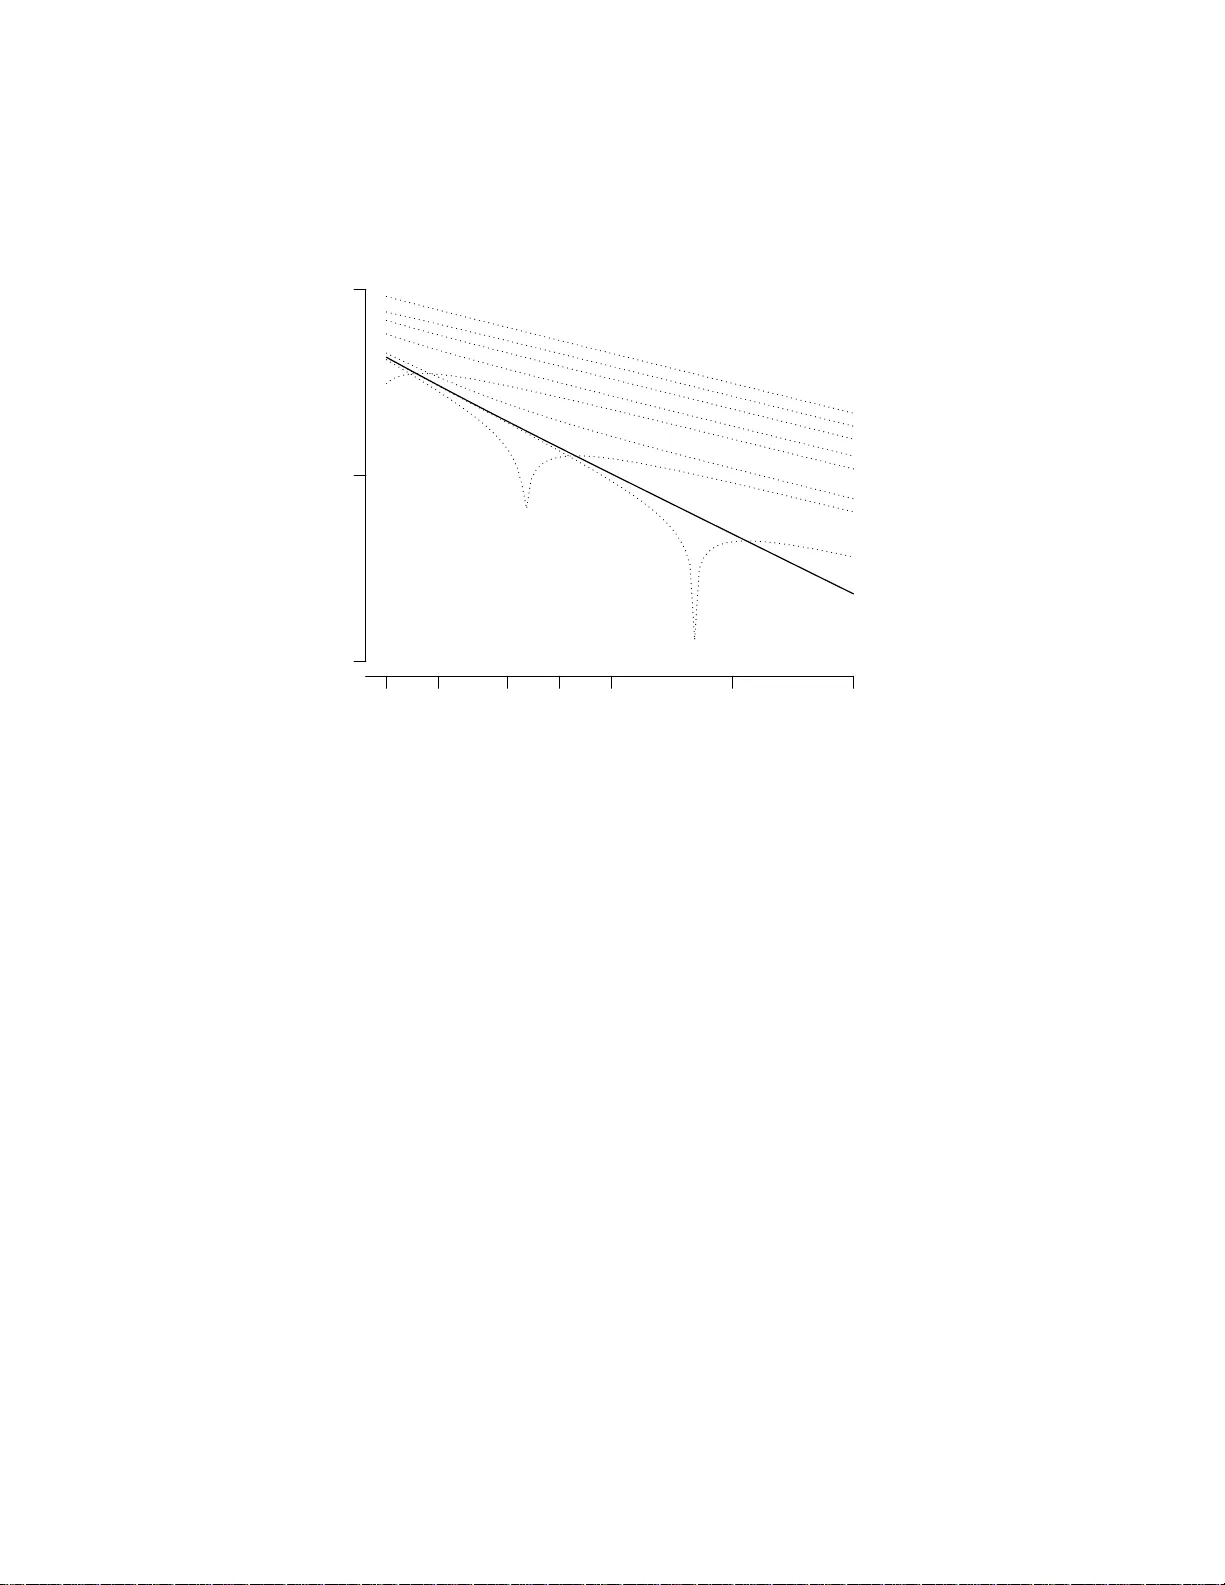
A closed- form approximation for the median of the beta distribution Jouni Ker man November 1, 2011 Abstract A simple closed-form approximation for the me dian of the beta distribu tion Beta( a, b ) is introdu ced: ( a − 1 / 3) / ( a + b − 2 / 3 ) for ( a, b ) both larger than 1 has a relativ e error of less than 4%, rapidly decreasing to zero as both sha pe parameters increase. Ke ywords: beta distribution, distribution median 1 Introd uction Consider the the beta distribution Beta( a, b ) , with the density fun ction, Γ( a + b ) Γ( a )Γ( b ) θ a − 1 (1 − θ ) b − 1 . The mean o f Beta( a, b ) is readily obtain ed by the for mula a/ ( a + b ) , but ther e is no general closed formula f or the median. The median function, here d enoted by m ( a, b ) , is the function that satisfies, Γ( a + b ) Γ( a )Γ( b ) Z m ( a,b ) 0 θ a − 1 (1 − θ ) b − 1 d θ = 1 2 . The relation ship m ( a, b ) = 1 − m ( b, a ) holds. On ly for the special cases a = 1 or b = 1 we may ob tain an exact formula: m ( a, 1) = 2 − 1 /a and m (1 , b ) = 1 − 2 − 1 /b . Moreover , when a = b , the median is exactly 1 / 2 . There h as be en muc h literature about the incom plete b eta f unction an d its inv erse (see e.g. Dutka (1981) for a re view). The focu s in literatur e h as been on fin ding accurate numerica l r esults, but a simple and practical appr oximation that is easy to compute has not been found. 2 A new closed-f orm appr oximation f or the median T ri vial boun ds for the med ian can b e derived (P ayton et al., 198 9), which are a co nse- quence of the more gener al mo de-med ian-mean ine quality (Gr oeneveld and Meeden, 1 Beta distribution shape parameter a Relative error p=0.001 p=0.499 1/3 1 2 3 4 5 10 20 −0.04 −0.03 −0.02 −0.01 0.00 Figure 1: Relativ e error s o f the approximation ( a − 1 / 3 ) / ( a + b − 2 / 3) of the median of the Beta( a, b ) distribution, compared with the num erically computed v alue for se v eral fixed p = a/ ( a + b ) < 1 / 2 . The horizontal ax is shows the shape parameter a on logarithm ic scale. Fr om left to right, p = 0 . 499 , 0.49, 0.45, 0.35, 0.25, and 0.001. 1977). In the case o f the b eta distribution with 1 < a < b , the m edian is b ound ed by the mode ( a − 1) / ( a + b − 2) and th e mean a/ ( a + b ) : a − 1 a + b − 2 ≤ m ( a, b ) ≤ a a + b . For a ≤ 1 the f ormula f or the mode d oes no t ho ld as there is no mo de. If 1 < b < a , the ord er of the ineq uality is reversed. Equality ho lds if and only if a = b ; in this case the mean, median, and mode are all equal to 1 / 2 . This inequality sho ws th at if the mean is kept fixed at some p , and one of th e shape parameters is increased, say a , then the median is sandwiched between p ( a − 1) / ( a − 2 p ) and p , hence the median tends to p . From the f ormulas for th e mode and mean, it can be conjectu red th at the me dian m ( a, b ) could be app roximated by m ( a, b ; d ) = ( a − d ) / ( a + b − 2 d ) for so me d ∈ (0 , 1) , as th is f orm w ould satisfy the above in equality while ag reeing with th e symmetry requirem ent, th at is, m ( a, b ; d ) = 1 − m ( b , a ; d ) . 2 Beta distribution mean p Relative error min(a,b)=1 min(a,b)=1.5 min(a,b)=2 min(a,b)=4 0 0.5 1 −0.04 −0.03 −0.02 −0.01 0.00 0.01 0.02 Figure 2: Relati ve errors of th e approxim ation ( a − 1 / 3) / ( a + b − 2 / 3) of the median of the B e ta ( a, b ) distribution over the who le range of possible d istribution means p = a/ ( a + b ) . The sma ller o f the sh ape par ameters is fixed, i.e. fo r p ≤ 0 . 5 , the median is computed f or Beta( a, a (1 − p ) /p ) and f or p > 0 . 5 , the median is com puted fo r Beta( bp/ (1 − p ) , b ) . Since a Beta( a, b ) variate can be expressed as th e ratio γ 1 / ( γ 1 + γ 2 ) where γ 1 ∼ Gamma( a ) and γ 2 ∼ Gamma( b ) (b oth with un it scale), it is useful to have a look a t the median of the g amma d istribution. Berg and Pedersen (2 006) studied the median function of th e unit-scale gamma distrib ution median fu nction, denoted h ere by M ( a ) , for any shap e par ameter a > 0 , and obtained M ( a ) = a − 1 / 3 + o (1) , rapidly ap- proach ing a − 1 / 3 as a increases. It can th erefore b e co njectured that the d istribution median may be approx imated b y , m ( a, b ) ≈ m ( a, b ; 1 / 3 ) = a − 1 / 3 ( a − 1 / 3) + ( b − 1 / 3 ) = a − 1 / 3 a + b − 2 / 3 . (1) Figure (1) shows that th is appr oximation ind eed appears to approa ch the n umeri- cally computed median asym ptotically for all distribution means p = a/ ( a + b ) as the (smaller) sha pe para meter a → ∞ . For a ≥ 1 , th e r elativ e error is less than 4 %, an d for a ≥ 2 this is alrea dy less than 1%. 3 Beta distribution shape parameter a Log of scaled absolute error for p=0.01 d=1/3 d=1/3 d=0.333 d=0.33 d=0.3 d=0.34 d=0.4 d=0.5 d=0 d=1 1 2 5 10 20 100 500 −20 −10 0 Figure 3: Logarithm of the scaled abso lute erro r (distance ) log( | m ( a, b ; d ) − m ( a, b ) | /p ) , comp uted for a fixed distribution m ean p = 0 . 01 and various d . The approx imate m edian of the Beta( a, b ) distribution is d efined as m ( a, b ; d ) = ( a − d ) / ( a + b − 2 d ) . Du e to s caling of the err or, the gr aph an d its scale will not essentially change e ven if th e error is comp uted for other values of p < 0 . 5 . The appro xima- tion m ( a, b ; 1 / 3 ) performs the m ost c onsistently , attaining the lowes t ab solute error ev e ntually as the precision of the distrib utio n increases. Figure (2) sho ws the relative err or over all possible distribution mea ns p = a/ ( a + b ) , as the smallest of the two shap e parameters varies from 1 to 4 . T his illustrates how the relative er ror ten ds unifo rmly to zero over all p as the shape p arameters increase. The figure also shows th at the for mula co nsistently either un derestimates or overesti- mates the median depend ing o n whether p < 0 . 5 or p > 0 . 5 . Howe ver, the fun ction m ( a, b ; d ) app roximates th e median f a irly accurately if som e other d close to 1 / 3 (say d = 0 . 3 ) is chosen. Figu re (3) displays curves of the lo ga- rithm of the abso lute difference from the numer ically co mputed median for a fixed p = 0 . 0 1 , as the sh ape parameter a increases. The a bsolute difference has been scaled by p b efore taking the lo garithm: due to this scaling, the error stays ap proxim ately constant as p decreases so the picture and its scale will n ot e ssentially chang e even if the error is computed for oth er values of p < 0 . 5 . The figure shows th at although some 4 Beta distribution mean p Pr(theta
Original Paper
Loading high-quality paper...
Comments & Academic Discussion
Loading comments...
Leave a Comment