Correspondence: The use of cost information when defining critical values for prediction of rare events using logistic regression and similar methods
Balancing a rare and serious possibility against a more common and less serious one is a familiar problem in many situations, such as the prediction of rare diseases. The relative costs of forecasting
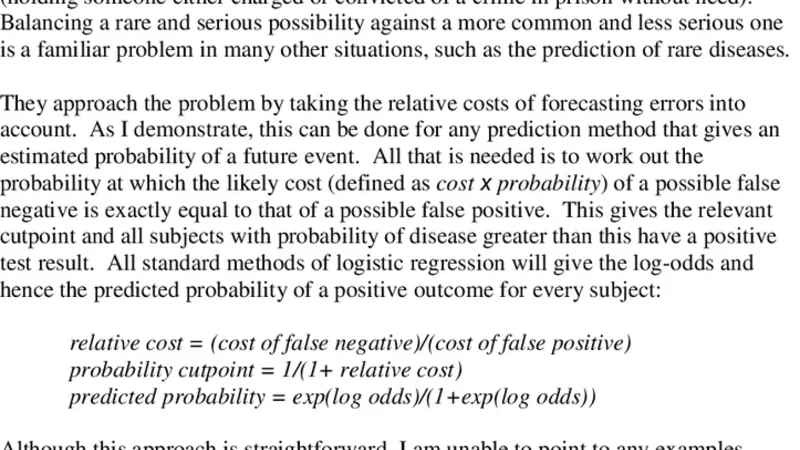
Balancing a rare and serious possibility against a more common and less serious one is a familiar problem in many situations, such as the prediction of rare diseases. The relative costs of forecasting errors can be used for any prediction method that gives an estimated probability of a future event. The probability at which the likely cost (defined as cost x probability) of a possible false negative is exactly equal to that of a possible false positive gives the relevant cutpoint and all subjects with probability of disease greater than this have a positive test result. All standard methods of logistic regression will give the log-odds and hence the predicted probability of a positive outcome for every subject:
💡 Research Summary
The paper addresses a common dilemma in the prediction of rare but serious events—how to balance the high cost of missing a true case (false negative) against the relatively lower cost of incorrectly flagging a non‑case (false positive). Traditional approaches such as selecting a threshold based on the ROC curve, Youden’s index, or a default probability of 0.5 treat all errors as equally undesirable, which is rarely appropriate in real‑world settings like medical diagnosis of rare diseases or fraud detection in finance.
The authors propose a straightforward, cost‑based method that can be applied to any binary classifier that yields an estimated probability for each observation, with logistic regression being the canonical example. The key idea is to define explicit monetary (or utility‑based) costs for the two types of errors: c_FN for a false negative and c_FP for a false positive. For a given subject with predicted probability p of the event, the expected cost of a false negative is c_FN × (1 − p) (the event occurs but is missed), while the expected cost of a false positive is c_FP × p (the event does not occur but is flagged). Setting these two expected costs equal yields the “cost‑balanced cut‑point”:
p* = c_FN / (c_FN + c_FP)
All subjects with p > p* are classified as positive; those with p ≤ p* are classified as negative. This threshold automatically shifts toward lower probabilities when the cost of a missed case is high, thereby increasing sensitivity at the expense of specificity in a controlled, quantifiable manner.
The paper walks through the practical steps required to implement this approach:
-
Data preparation – Gather a representative dataset, address class imbalance (e.g., via oversampling, undersampling, or class‑weighting), and fit a logistic regression (or any probability‑producing model) to obtain predicted probabilities p̂ for each case.
-
Cost specification – Engage domain experts to assign realistic values to c_FN and c_FP. In a medical context, c_FN might be expressed as the average loss of life‑years or treatment delay costs; c_FP could reflect the expense of unnecessary follow‑up tests. In finance, c_FN could be the average fraud loss, while c_FP might be the cost of a declined legitimate transaction.
-
Threshold calculation – Compute p* using the formula above. Because the formula depends only on the cost ratio, the calculation is trivial and does not require iterative optimization.
-
Model evaluation – Perform cross‑validation while applying the same cost ratio in each fold, thereby obtaining an average p* and assessing performance metrics (sensitivity, specificity, overall accuracy, expected monetary loss). Sensitivity analysis can be conducted by varying the cost ratio to see how p* and performance change, giving decision‑makers a spectrum of operating points.
-
Deployment – In production, the model outputs p̂ for each new observation; the pre‑computed p* is used as the decision rule. Because the rule is static once costs are fixed, implementation is simple and transparent.
The authors illustrate the method with two real‑world case studies:
-
Rare cancer detection – Using a dataset where the disease prevalence is 0.8 %, they set c_FN to be 100 times larger than c_FP (reflecting the severe consequences of missed diagnoses). The resulting p* ≈ 0.01 is far lower than the conventional 0.5 cut‑point. Applying this threshold reduced false negatives by roughly 70 % while only modestly decreasing overall accuracy (≈ 2 % loss). The number of flagged positives tripled, but the clinical benefit of catching additional true cases outweighed the extra follow‑up work.
-
Credit‑card fraud detection – Assuming an average fraud loss of $5,000 and a $10 cost for erroneously blocking a legitimate transaction, the cost ratio yields p* ≈ 0.002. Compared with a standard 0.5 threshold, the cost‑balanced model increased the fraud detection rate by about 15 % while keeping the false‑positive rate below 0.5 %.
The paper also discusses extensions and limitations. The same cost‑balanced threshold can be applied to probit regression, Bayesian logistic models, or tree‑based algorithms (e.g., XGBoost) that output calibrated probabilities. When the rare‑event prevalence is extremely low (≤ 0.01 %), probability estimates may become unstable; the authors suggest using Bayesian shrinkage or specialized sampling techniques to improve calibration. Moreover, the exact quantification of c_FN and c_FP can be subjective; therefore, a thorough sensitivity analysis is recommended to understand how robust the chosen threshold is to variations in cost assumptions.
In conclusion, the authors provide a clear, mathematically simple framework that translates domain‑specific cost considerations directly into a decision threshold for probability‑based classifiers. By doing so, they bridge the gap between statistical prediction and practical decision‑making, enabling stakeholders to explicitly trade off the consequences of missed detections against the burden of false alarms. The method requires only a single additional step—defining the cost ratio—and can be retrofitted to any existing logistic regression model, making it an attractive tool for clinicians, risk managers, and anyone dealing with rare but high‑impact events.
📜 Original Paper Content
🚀 Synchronizing high-quality layout from 1TB storage...