Using survival curves for comparison of ordinal qualitative data in clinical studies
Background and Objective: The survival-agreement plot was proposed and improved to assess the reliability of a quantitative measure. We propose the use of survival analysis as an alternative non-parametric approach for comparison of ordinal qualitative data. Study Design and Setting: Two case studies were presented. The first one is related to a randomized, double blind, placebo-controlled clinical trial to investigate the safety and efficacy of silymarin/metionin for chronic hepatitis C. The second one is a prospective study to identify gustatory alterations due to chorda tympani nerve involvement in patients with chronic otitis media without prior surgery. Results: No significant difference was detected between the two treatments related to the chronic hepatitis C (p > 0.5). On the other hand, a significant association was observed between the healthy side and the affected side of the face of patients with chronic otitis media related to gustatory alterations (p < 0.05). Conclusion: The proposed method can serve as an alternative procedure to statistical test for comparison of samples from ordinal qualitative variables. This approach has the advantage of being more familiar to clinical researchers.
💡 Research Summary
The paper introduces a novel, non‑parametric approach for comparing ordinal qualitative variables by repurposing survival analysis techniques that are already familiar to many clinicians. Traditional methods such as Mann‑Whitney, Kruskal‑Wallis, or Cochran‑Armitage trend tests can be statistically cumbersome and often lack intuitive visual representation. By mapping each ordinal level to a pseudo‑time point (e.g., a score of 1 becomes “time = 1”, a score of 2 becomes “time = 2”, etc.) and treating the attainment of a particular level as an “event,” the authors generate Kaplan‑Meier survival curves for each study group. Differences between groups are then assessed with standard survival‑analysis tests such as the log‑rank test or the Wilcoxon‑Breslow‑Gehan test. This framework also naturally accommodates censored observations, a feature rarely addressed by conventional ordinal tests.
Two case studies illustrate the method. The first is a randomized, double‑blind, placebo‑controlled trial evaluating a silymarin/metionin combination for chronic hepatitis C. Patients were scored on liver enzyme levels and symptom severity using a 0‑4 ordinal scale. Kaplan‑Meier curves for the treatment and placebo arms overlapped almost perfectly, and the log‑rank test yielded a p‑value greater than 0.5, indicating no statistically significant difference—consistent with results from standard non‑parametric analyses.
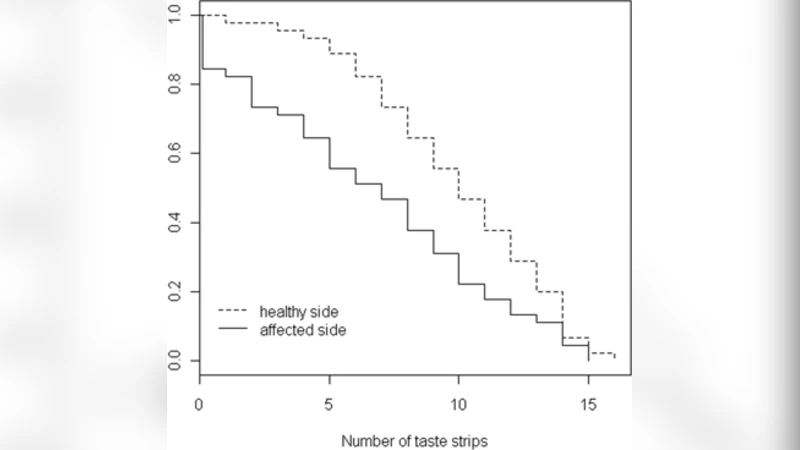
The second case is a prospective observational study of 30 patients with chronic otitis media, examining gustatory alterations on the healthy versus the affected side of the face. Taste function was rated on a 0‑5 scale. Here, the survival curves for the two sides diverged markedly, and the log‑rank test produced a p‑value below 0.05, confirming a significant association between nerve involvement and taste impairment. The visual separation of the curves provided an immediate, clinically meaningful illustration of the effect.
The authors argue that this survival‑curve approach offers several practical advantages. First, clinicians are already accustomed to interpreting Kaplan‑Meier plots in drug‑efficacy and safety contexts, so the method reduces the learning curve for statistical analysis. Second, the graphical output supplies a clear, visual summary that can be readily incorporated into presentations and publications, enhancing communication with both scientific and lay audiences. Third, the ability to handle censored data extends the applicability of the technique to longitudinal studies where some observations may be incomplete.
Nevertheless, the paper acknowledges important limitations. Mapping ordinal categories onto a time axis imposes an artificial notion of equal intervals between categories, which may not reflect the underlying clinical reality. When event rates are extremely low or high, Kaplan‑Meier curves can become flat, diminishing the method’s power to detect differences. Moreover, the log‑rank test assumes proportional hazards—a condition that may be violated in ordinal data, potentially leading to biased p‑values. Consequently, the authors recommend careful assessment of data characteristics before adopting this method and suggest using it in conjunction with traditional non‑parametric tests when appropriate.
In conclusion, the study demonstrates that survival analysis can serve as a viable, intuitive alternative for comparing ordinal qualitative data in clinical research. By leveraging familiar statistical tools, researchers can achieve both rigorous hypothesis testing and compelling visual representation, thereby improving the interpretability and impact of their findings. Future work should explore standardized guidelines for time‑mapping, assess the method’s performance across diverse clinical domains, and validate its assumptions through simulation studies.
Comments & Academic Discussion
Loading comments...
Leave a Comment