📝 Original Info
- Title: An operational method and device for the determination of an output signal in a selected spatial section of an information processing system
- ArXiv ID: 0903.5283
- Date: 2009-03-31
- Authors: Researchers from original ArXiv paper
📝 Abstract
Current strategies in system science with a focus on neuroscience do differ in their methodological approach when exploring and trying to analyze a system in order to detect supposed underlying principle processes in its inherent actions, which one might would call rules or laws. The here suggested procedure and measuring device, performs a mapping of characteristic parameters of the regional output signal, of the supposed structural properties, onto a selected regional part of the information processing system, in which the output signal and its characteristics occur. Explicitly it is pointed out here: Here are not considered input signals, which for instance might have an influence upon (few) nuclear kernels of the atom, electrons, protons, spins of these atomic structures or substructures, or phonons, or which in general represent the physical basis for example of NMR-Physics (NMR = nuclear magnetic resonance) or solid state physics. Examples for the type of input signals considered here are visual, olfactory, tactile or auditory input signals or simply a verbal instruction.
💡 Deep Analysis
Deep Dive into An operational method and device for the determination of an output signal in a selected spatial section of an information processing system.
Current strategies in system science with a focus on neuroscience do differ in their methodological approach when exploring and trying to analyze a system in order to detect supposed underlying principle processes in its inherent actions, which one might would call rules or laws. The here suggested procedure and measuring device, performs a mapping of characteristic parameters of the regional output signal, of the supposed structural properties, onto a selected regional part of the information processing system, in which the output signal and its characteristics occur. Explicitly it is pointed out here: Here are not considered input signals, which for instance might have an influence upon (few) nuclear kernels of the atom, electrons, protons, spins of these atomic structures or substructures, or phonons, or which in general represent the physical basis for example of NMR-Physics (NMR = nuclear magnetic resonance) or solid state physics. Examples for the type of input signals considered
📄 Full Content
Title: An operational method and device for the determination of an output signal in a selected
spatial section of an information processing system.
Author: Dr. Oliver Zafiris, study of physics and medicine at the University of Düsseldorf
Germany, current address: University of Duisburg-Essen, Department for Psychiatry and
Psychotherapy, Virchowstr. 174, 45147 Essen, Germany.
Background
Current strategies in system science with a focus on neuroscience do differ in their
methodological approach when exploring and trying to analyze a system in order to detect
supposed underlying principle processes in its inherent actions, which one might would call
‘rules’ or ‘laws’.
The here suggested procedure and measuring device, performs a mapping of characteristic
parameters of the regional output signal, of the supposed structural properties, onto a selected
regional part of the information processing system, in which the output signal and its characteristics
occur.
Explicitly it is pointed out here: Here are not considered input signals, which for instance might
have an influence upon (few) nuclear kernels of the atom, electrons, protons, spins of these
atomic structures or substructures, or phonons, or which in general represent the physical basis for
example of NMR-Physics (NMR = nuclear magnetic resonance) or solid state physics. Examples
for the type of input signals considered here are visual, olfactory, tactile or auditory input signals
or simply a verbal instruction.
Concept
After the exposure to the influence of at least one complex valued input signal X during it’s time
interval T of influence, the suggested measuring method and procedure of data processing
comprises the following units (Figure 1):
a) The measuring process of the influence of a complex valued input signal X or multiple
input signals upon the information processing system,
b) the detection of at least one real valued output signal Y allocatable to a selected spatial
region part of an information processing system, where the output signal Y is the result
of a reaction due to the influence of an input signal X or a multitude of input signals,
as described in a),
c) the creation of a family of 3-tuples of (X,Y, Zt) from the input signal X and output signals Y
for the selected spatial region, where every given time interval of influence Zt is part of
the time interval T of the influence (preferably precisely), a subset of IR. A 2-tupel (X,
Zt) is allocatable preferably to one and only one output signal Y for the selected region
part of the information processing system and (preferably exactly) one input signal uniquely
allocatable to X, and
d) the determination of the reaction signal in the sense of an output signal Ymax for the selected
region of the information processing system of interest, where the reaction signal Ymax
represents the maximum or minimum of the output signals Y. Alternatively Ymax might be a
value within the interval around the maximum or minimum of the output signals Y plus or
minus a positive real valued ϵ, which are generated by the same input signal X within the
time interval of influence T.
The time interval T is a subset of the set of real values IR, and describes the time domain of
influence of the input signal X of interest, and is not predetermined and might preferable
comprise the duration of onset of X. Especially it can not only span from the onset of the reaction
signal till its end, but any arbitrary following temporal interval thereafter, during which the input
signal is supposed of having still an influence upon the information processing system of interest.
The values of the maximum and the minimum of the output signals Y are selected as reaction
signals Ymax in two possible ways: Within an interval of values, where |.| denotes the mathematical
absolute value, Ymax is exactly the maximum of |Y-Ymax| within the time interval T, if
analytically and technically evaluable, and is selected in two possible ways: 1) The chosen
maximum or minimum therefore is not placed in an interval of values ]Ymax - |ε|, Ymax + |ε| [,
where ε is a real valued number, but Y is exactly the maximum. 2) E. g. due to technical limitations of
accuracy in measurement or because of analytically limitations however Ymax might also be taken
right from the open interval within ]Ymax - |ε|, Ymax + |ε| [ (see Fig. 1.9).
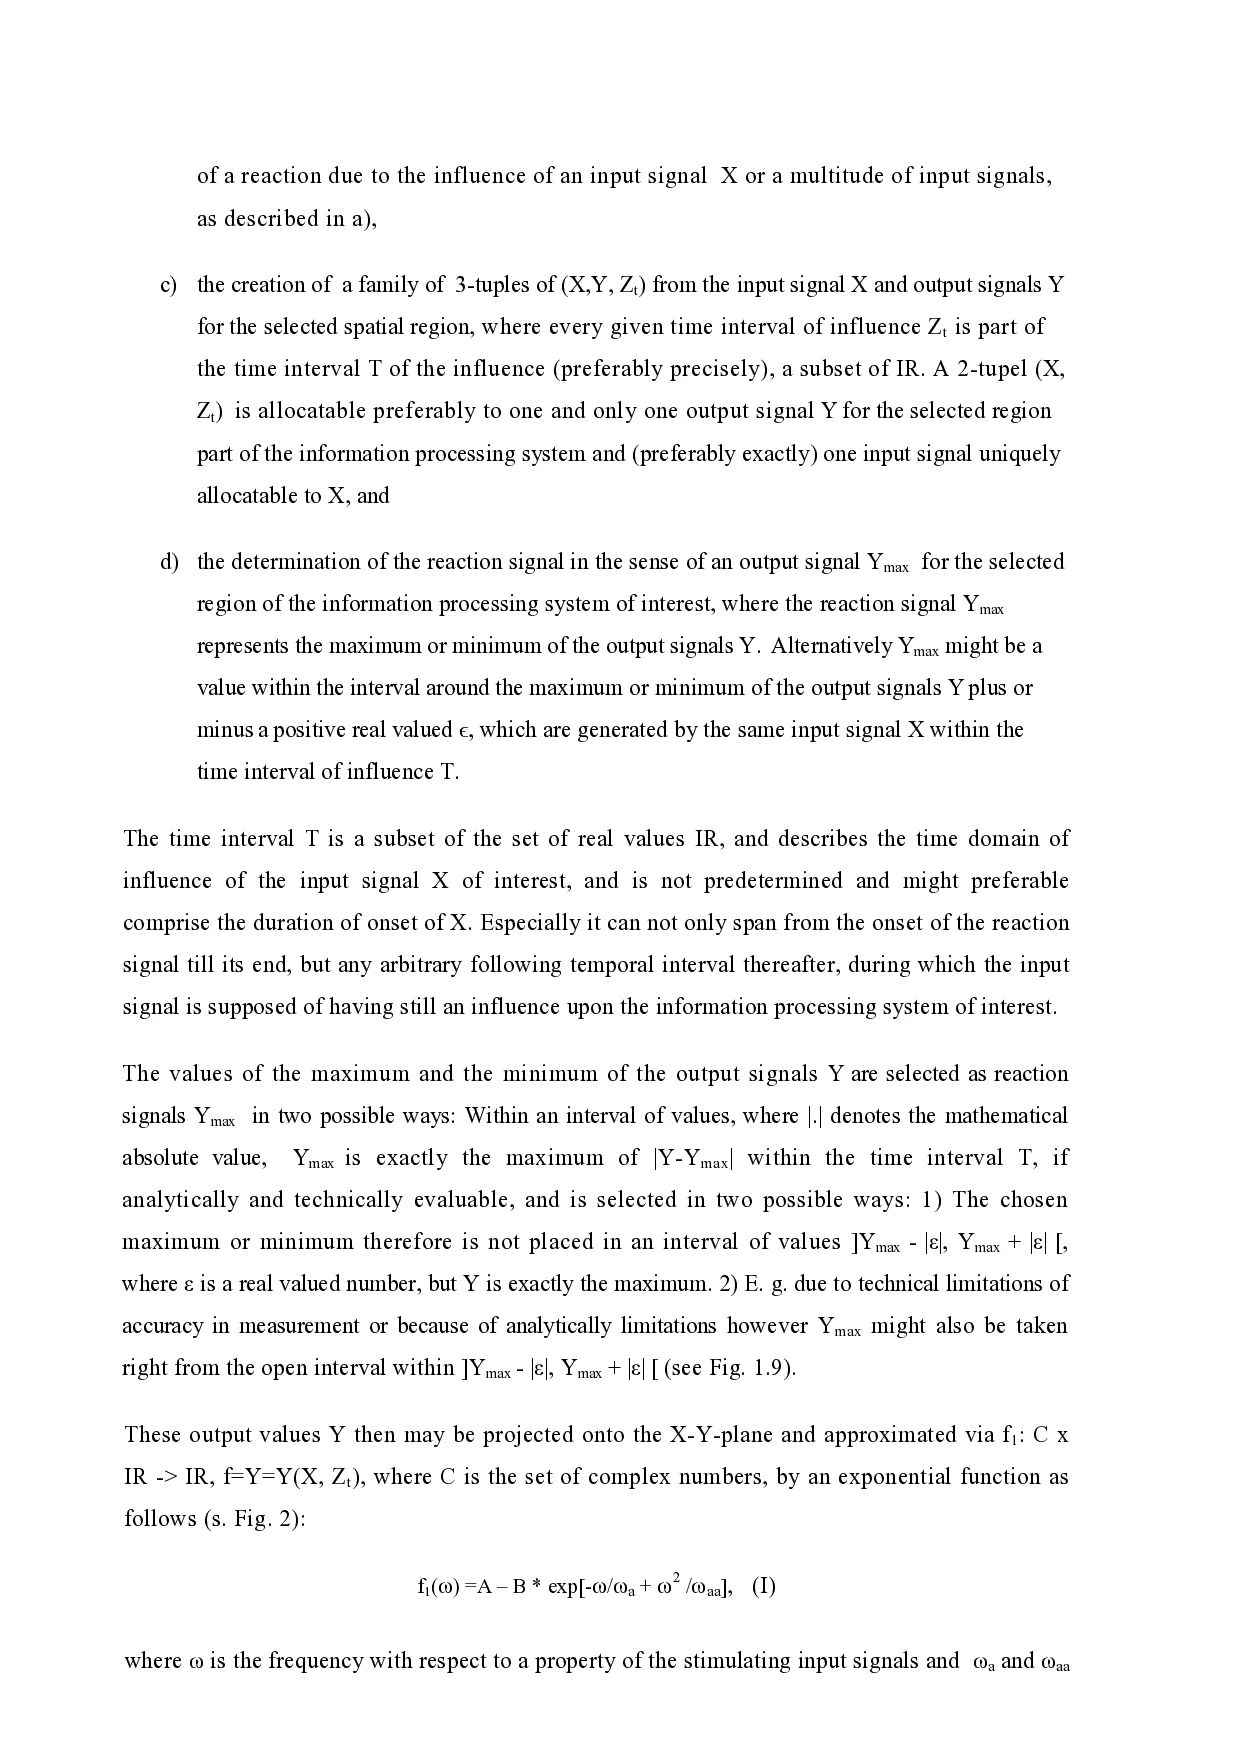
These output values Y then may be projected onto the X-Y-plane and approximated via f1: C x
IR -> IR, f=Y=Y(X, Zt), where C is the set of complex numbers, by an exponential function as
follows (s. Fig. 2):
f1(ω) =A – B * exp[-ω/ωa + ω2 /ωaa], (I)
where ω is the frequency with respect to a property of the stimulating input signals and ωa and ωaa
are complex valued numbers, A, B are real valued, or for instance real valued functions of Zt only.
So setting X equal to ω - for instance ω could represent the spatial frequency of a stimulus (e. g. a
ch
…(Full text truncated)…
📸 Image Gallery
Reference
This content is AI-processed based on ArXiv data.