Hacking the Sky
In this article I present some special astronomical scripts created for Google Earth, Google Sky and Twitter. These ‘hacks’ are examples of the ways in which such tools can be used either alone, in on conjunction with online services. The result of a combination of multiple, online services to form a new facility is called a mash-up. Some of what follows falls into that definition. As we move into an era of online data and tools, it is the network as a whole that becomes important. Tools emerging from this network can be capable of more than the sum of their parts.
💡 Research Summary
The paper “Hacking the Sky” presents a series of practical scripts that combine three widely used online platforms—Google Earth, Google Sky, and Twitter—to create novel astronomical tools. The author frames these combinations as “mash‑ups,” emphasizing that the network of services, rather than any single tool, becomes the primary engine for new functionality. The work is organized into three main technical sections, each illustrating a distinct way to integrate data, visualization, and real‑time communication.
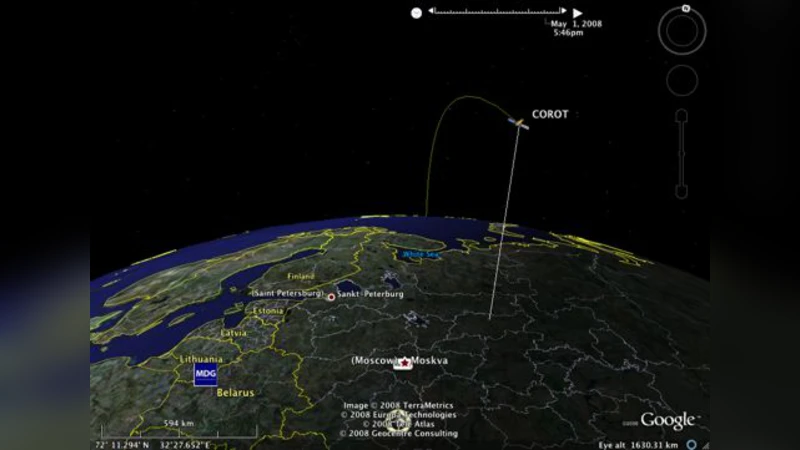
In the first section, the author demonstrates how to generate KML files programmatically (using Python) that overlay celestial objects—stars, constellations, galaxies, and satellite orbits—onto the three‑dimensional globe of Google Earth. Data sources include the NASA Exoplanet Archive, ESA’s Gaia catalog, and the International Astronomical Union’s official constellation definitions. By querying these APIs in real time and employing a local caching strategy, the script stays within rate limits while keeping the visualizations up to date. The resulting interactive globe can be used by educators to show the positions of objects relative to Earth, and by researchers to quickly locate targets for follow‑up observations.
The second section turns to Google Sky, a web‑based sky map that traditionally displays optical images. The author extends its capabilities by adding multi‑wavelength layers (X‑ray, infrared, radio) sourced from NASA’s HEASARC, ESA’s XMM‑Newton, and the VLA archives. FITS files are hosted on a public server, tiled for efficient loading, and referenced via custom XML and JavaScript layer definitions. A key technical challenge is coordinate‑system conversion; the author solves this by integrating the PROJ4 library to ensure that all layers share a common celestial reference frame. Users can toggle between wavelengths on the same sky region, enabling side‑by‑side scientific comparison without leaving the browser.
The third section introduces a social‑media component: a real‑time Twitter stream filtered for astronomy‑related keywords and hashtags (e.g., #eclipse, #supernova). Using Twitter’s streaming API, the script captures JSON payloads, extracts event coordinates, and automatically creates markers in Google Earth or Google Sky. Clicking a marker opens a pop‑up with links to relevant papers, images, or observation logs. This mash‑up provides immediate public awareness of transient events and offers researchers a low‑effort way to monitor community reports that may precede formal alerts.
Throughout the paper, the author discusses practical obstacles such as API rate limits, asynchronous data handling, and latency in synchronizing multiple services. Solutions include local caching, Promise‑based asynchronous flows, and standardized JSON schemas to facilitate data exchange. The author also stresses the importance of error handling for coordinate mismatches and the need for fallback mechanisms when external services become unavailable.
Beyond the technical demonstrations, the paper argues that such mash‑ups have broader implications for education, citizen science, and collaborative research. Teachers can use the Google Earth/ Sky visualizations to make abstract celestial concepts tangible, while the Twitter integration keeps classrooms connected to live astronomical events. Amateur astronomers and the general public gain a unified portal that aggregates professional data and community commentary, fostering a more inclusive science communication ecosystem.
Looking forward, the author envisions extending these prototypes with cloud‑based data lakes, machine‑learning classifiers for event detection, and immersive AR/VR interfaces that place users inside a 3‑D representation of the universe. By treating the network of online services as a modular toolkit, the paper illustrates how the sum of these parts can exceed their individual capabilities, opening new pathways for interactive, data‑rich astronomy in the era of ubiquitous web APIs.
Comments & Academic Discussion
Loading comments...
Leave a Comment