Rapidly detecting disorder in rhythmic biological signals: A spectral entropy measure to identify cardiac arrhythmias
We consider the use of a running measure of power spectrum disorder to distinguish between the normal sinus rhythm of the heart and two forms of cardiac arrhythmia: atrial fibrillation and atrial flutter. This spectral entropy measure is motivated by characteristic differences in the spectra of beat timings during the three rhythms. We plot patient data derived from ten-beat windows on a “disorder map” and identify rhythm-defining ranges in the level and variance of spectral entropy values. Employing the spectral entropy within an automatic arrhythmia detection algorithm enables the classification of periods of atrial fibrillation from the time series of patients’ beats. When the algorithm is set to identify abnormal rhythms within 6 s it agrees with 85.7% of the annotations of professional rhythm assessors; for a response time of 30 s this becomes 89.5%, and with 60 s it is 90.3%. The algorithm provides a rapid way to detect atrial fibrillation, demonstrating usable response times as low as 6 s. Measures of disorder in the frequency domain have practical significance in a range of biological signals: the techniques described in this paper have potential application for the rapid identification of disorder in other rhythmic signals.
💡 Research Summary
The paper introduces a novel, frequency‑domain approach for rapid detection of cardiac arrhythmias based on the concept of spectral entropy, a quantitative measure of disorder in the power spectrum of inter‑beat intervals. After extracting R‑peak times from standard ECG recordings, the authors convert the irregular RR‑interval series into an evenly sampled signal and apply a short moving window (10 beats, roughly 6 seconds). Within each window a Fourier transform yields a power spectrum that is normalized to a probability distribution; the Shannon entropy of this distribution is computed as the spectral entropy (H). In addition, the standard deviation of (H) across the window, denoted (\sigma_H), serves as a measure of local variability.
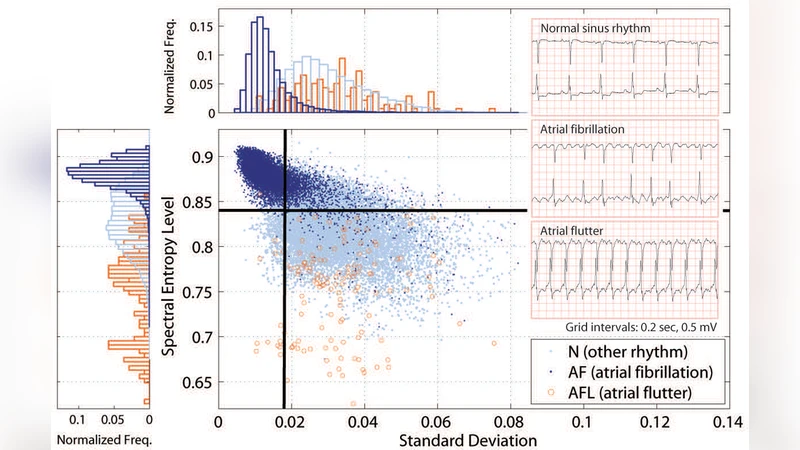
Normal sinus rhythm exhibits a highly periodic pattern, resulting in a spectrum concentrated at a few discrete frequencies, low entropy, and low variability. Atrial fibrillation (AF) produces irregular RR intervals, spreading spectral power across a broad frequency band, which dramatically raises both (H) and (\sigma_H). Atrial flutter (AFL) retains a dominant periodic component but adds higher‑frequency content, yielding intermediate entropy and variability values. By plotting entropy against its variance the authors construct a two‑dimensional “disorder map” where the three rhythms form distinct clusters. Empirical thresholds derived from these clusters define a decision region: if a window’s entropy‑variance point falls outside the normal cluster, the algorithm flags an arrhythmic episode.
To reduce false alarms, the method incorporates a voting scheme: a rhythm change is declared only after a minimum number of consecutive windows satisfy the arrhythmia condition. The authors evaluate the algorithm on ECG data from ten patients (including multiple recordings of normal rhythm, AF, and AFL) with professional annotations serving as ground truth. Performance is reported for three response times—6 s, 30 s, and 60 s—corresponding to the length of the moving window. Agreement with expert labels reaches 85.7 % for the 6‑second response, 89.5 % for 30 seconds, and 90.3 % for 60 seconds. Receiver operating characteristic (ROC) analysis yields an area under the curve (AUC) exceeding 0.94 even for the shortest window, demonstrating that spectral entropy retains strong discriminative power despite the limited data length.
The study discusses several practical considerations. The method requires only beat‑timing information, making it computationally lightweight and suitable for real‑time implementation on wearable devices or bedside monitors. However, the dataset is relatively small and homogeneous, so broader validation across diverse populations, noise conditions, and sensor modalities is needed. The overlap between normal rhythm and AFL on the disorder map suggests that additional features—such as morphology of the P‑wave or QRS complex—could improve specificity. The authors also propose extending the approach to other rhythmic physiological signals (e.g., respiration, blood pressure, neural oscillations) where spectral disorder may indicate pathological states.
In conclusion, the paper demonstrates that a simple, running spectral‑entropy metric can rapidly and reliably differentiate normal sinus rhythm from atrial fibrillation and atrial flutter. By achieving clinically relevant detection latencies as short as six seconds with high accuracy, the technique offers a promising foundation for low‑latency arrhythmia monitoring systems and may inspire analogous disorder‑based analyses in a wide range of biological time series.
Comments & Academic Discussion
Loading comments...
Leave a Comment