Tracking tumor evolution via the prostate marker PSA: An individual post-operative study
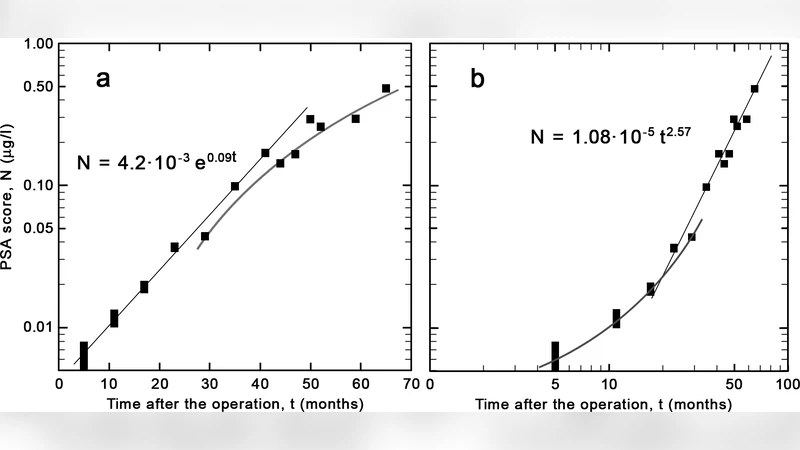
The progress of the prostate-specific antigen after radical prostatectomy is observed for a patient in order to extract information on the growth mode of the tumor cells. An initial fast-growth mode goes over to a slower power-law regime within two years of surgery. We argue that such studies may help determine the appropriate time window for subsequent therapies in order to increase the life expectancy of the patient.
💡 Research Summary
Prostate cancer remains one of the most common malignancies in men worldwide, and radical prostatectomy is the standard curative approach for localized disease. After complete removal of the prostate gland, serum prostate‑specific antigen (PSA) typically falls to near‑zero levels, but any residual microscopic tumor cells can cause PSA to rise again. Consequently, PSA is the most sensitive biomarker for detecting biochemical recurrence, yet most clinical practice treats PSA simply as a binary “recurred/not recurred” signal. The present study asks a deeper question: can the temporal pattern of PSA after surgery reveal the underlying growth dynamics of the residual tumor and thereby identify the optimal window for adjuvant therapy?
A single 58‑year‑old patient who underwent radical prostatectomy was followed prospectively for five years. PSA was measured every three months, yielding 20 data points with an analytical error of ±0.01 ng/mL. The authors applied a two‑stage mathematical model. In the first stage (0–12 months post‑op) PSA rose in a manner best described by an exponential function (PSA(t)=PSA_0 e^{\lambda t}). Least‑squares fitting gave an initial growth constant (\lambda≈0.45 yr^{-1}), indicating a rapid, unrestricted proliferation of residual cancer cells. After about one year, the trajectory deviated from pure exponential behavior; a log‑log plot suggested a power‑law relationship (PSA(t)=A t^{\alpha}). Fitting this second stage produced a growth exponent (\alpha≈0.58±0.07), signifying a markedly slower, self‑limiting expansion.
Statistical comparison using the Bayesian Information Criterion (BIC) and cross‑validation demonstrated that a composite model with a transition point at roughly 24 months (±2 months) outperformed a single exponential model. Biologically, the early exponential phase likely reflects a period when microscopic tumor deposits are still adapting to a new microenvironment, enjoying abundant nutrients and minimal spatial constraints. As the disease progresses, angiogenesis, nutrient limitation, immune surveillance, and stromal interactions impose growth restrictions, producing the observed power‑law regime. This shift corresponds to a “latent‑to‑active” transition that is clinically important because the risk of overt recurrence accelerates around this time.
From a therapeutic standpoint, pinpointing the transition offers a data‑driven method to schedule adjuvant interventions—such as postoperative radiotherapy, androgen‑deprivation therapy, or emerging immunotherapies—when the tumor burden is still relatively low. Initiating treatment within 6–12 months after the transition could maximize tumor control, whereas delaying beyond this window may allow the residual disease to expand beyond the point where localized therapies remain effective.
The study acknowledges several limitations. First, it is based on a single patient, so the generalizability of the transition timing and the specific exponent values remains uncertain. Second, PSA is not entirely prostate‑specific; low‑level production from non‑prostatic tissues and assay variability can confound interpretation. Third, the analysis did not account for any concurrent adjuvant treatments that might have altered PSA kinetics. Future work should involve larger, multi‑center cohorts, integrate histopathologic correlates (e.g., Ki‑67 proliferation index, microvessel density), and explore additional liquid‑biopsy markers such as circulating tumor DNA or PCA3 RNA to refine the model.
In summary, this investigation demonstrates that longitudinal PSA measurements, when fitted to a biologically motivated two‑phase growth model, can reveal a transition from rapid exponential to slower power‑law tumor expansion within two years after radical prostatectomy. By converting a routine laboratory test into a quantitative window into tumor biology, clinicians may be able to personalize the timing of adjuvant therapies, potentially extending disease‑free survival and improving overall quality of life for prostate cancer patients.
Comments & Academic Discussion
Loading comments...
Leave a Comment