Modeling threshold exceedance probabilities of spatially correlated time series
The Commission of the European Union, as well the United States Environmental Protection Agency, have set limit values for some pollutants in the ambient air that have been shown to have adverse effects on human and environmental health. It is theref…
Authors: ** 논문 본문에 저자 정보가 명시되지 않았습니다. (제공된 텍스트에 따르면 Draghicescu, Ghosh, Ignaccolo
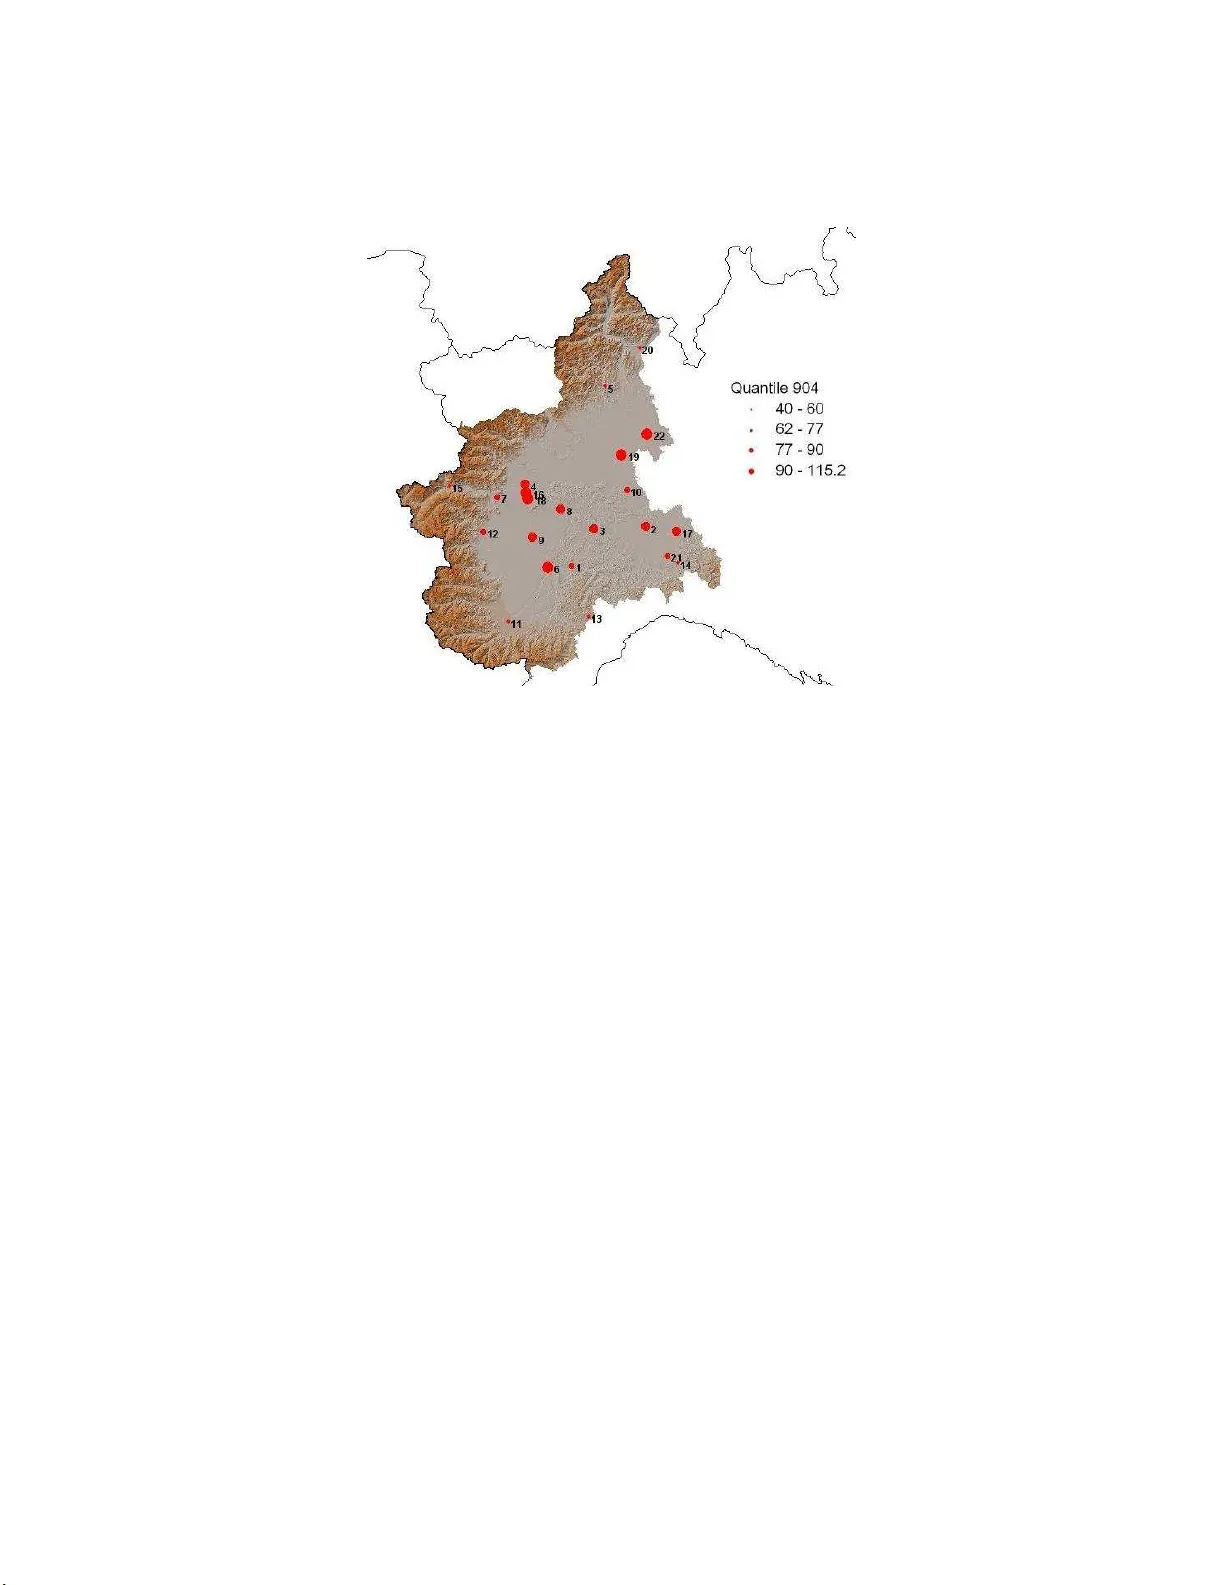
Electronic Journal of Stati stics V ol. 3 (2009) 149–164 ISSN: 1935-7524 DOI: 10.1214/ 08-EJS25 2 Mo d eling thresho ld exceedance probabilit ies of spatially corre lated time ser ies Dana Draghicescu ∗ Dep artment of Mathematics and Statistics Hunter Col le g e of the Cit y Univ e rsity of New Y ork, USA e-mail: dana.dra ghicescu @hunter. cuny.edu Rosaria Ignaccolo Dip artiment o di Statistic a e Matematic a Applic ata Universit` a de gli Studi di T orino, Italy e-mail: ignaccol o@econ.u nito.it Abstract: The Commission of th e European Union, as w ell the United States Environmen tal Protection Agency , hav e set li mit v alues for some poll utan ts in the amb ien t air that hav e b een shown to hav e adve rse effects on h uman and en vironmen tal health. It i s therefore impor tan t to identify regions where the pr obabilit y of exceeding those limi ts is high. W e propose a t w o-step procedure for estimating the probability of exceeding the legal limits that com bines smo othing in t he time domain with spatial in terpo- lation. F or i llustration, we sho w an application to particulate matter with diameter less than 10 microns (PM 10 ) in the North-Italian region Piemont e. AMS 2000 sub ject classificati ons: primary 62-09; secondary 62G99. Keywords and phrases: threshold exceedance probability , PM 10 , smo oth- ing, spatial int erpol ation, spatial time s er ies, visuali zation. Receiv ed June 2008. 1. In troductio n F or many physical pro cesses, it is impo rtant to mo del the probability o f ex- ceeding spec ific thresholds, ab ov e which ne g ative effects o n h uman health and the environmen t have b een observed. Exa mples include climatologic a l pro cesses (temper a ture, precipitation), and air pollution pro cesses (ozone, fine particles). One w ay of estimating exceedances over high thresholds is given by metho d- ology using ex treme v alue theory . A rev ie w of sta tis tica l tec hniques for analy z ing extreme v a lues can be found in Smith ( 1989 ), together with a deta iled analysis of ozone time series. Davison and Smith ( 199 0 ) ana lyze the generalized P areto distribution used for mo deling exce e da nces ov er high thresholds, and give ap- plications to river flo ws and w a ve heights. T awn ( 1992 ) uses a mo dified version of the jo int pr obabilities metho d for the analy sis of extr emes of non-s tationary ∗ Corresp onding author, phone 212-772-5748, fax 212-772-4858 149 D. D ra ghic e sc u and R. Ignac co lo/Mo deling thr eshold exc ee danc e pr ob abilities 150 sequences, with an illustration on estimation of ex tr eme sea le vels ex c eeded by the annual maximum ho ur ly sea heigh t with a prescrib ed probability . Niu ( 1997 ) discusses extremal pr op erties of non-statio nary time serie s , a nd shows an a p- plication to s tratospheric ozone in Chic a go, concer ning the exceedance o f da ily maxima ov er the nationa l standar d. Piegor sch et al. ( 1 998 ) prese nt a thoro ugh ov erview of statistical metho do logy for extreme v alues and rare even ts with fo cus on e nvironmental applications . Chav ez-Demoulin and Embrec h ts ( 2004 ) describ e smo oth no n-stationary generalize d additive models for extremes, and incorp ora te splines in a mo del for exceeda nces o v er high thres ho lds applied to finance and insur ance problems. An alterna tive, more g eneral appro ach for mo deling exc eedances, is via metho d- ology in time ser ies and spa tial statistics for pro bability distribution functions and quantiles. Also , it is o ften the case that environment al data ha ve large tem- po ral c overage (hourly or daily measurements ov er long p erio ds), and s maller spatial cov erage (a re la tively small num ber of monitoring lo cations). Such data can b e viewed as a collection of long time se ries that are spatially co rrelated. The pro ble m of interest is to map the exceeda nce pro babilities ov er a fixed threshold. Many times, the observed time s eries display different patterns a t the different monitoring sites, a nd show s ignificant departures from stationarity and Gaussianity . In this note we introduce a tw o -stage explo ratory technique tha t combines smo othing in the time domain with spatial interpo lation, to pro duce maps of ex- ceedance probabilities for the spatial domain of interest. Motiv ated by the g o o d tempo ral cov erage of the data, and in or der to provide a flexible, comprehens ive approach, we start b y smo othing the observed 0 o r 1 exceedance probabilities, then interpola te the resulting estimates by using a par a metric spatial cov ariance function. A flexible wa y to c ha racterize complex temp oral dep endence, is via a time- v ary ing transformation G ( t, Z t ) of a stationa ry pro cess Z t . The physical evo- lution of ma n y re a l-life pro cesse s makes this a plausible working a ssumption. As the unknown trans formation G is allow ed to v ary with time, the probability distribution function of the resulting pro cess may als o change, and therefore the pr o cess ma y not be stationary . Ghosh et al. ( 1997 ) studied the asymptotic prop erties o f a nonpara metric estimator of the marg ina l probability distribu- tion function in this setting, where the underlying pro ce s s Z t was a ssumed to be Gaus sian and having long memo ry . A similar estimator was analyzed in Draghicescu ( 20 03 ), Dra ghicescu and Ghosh ( 2003 ) for the ca se when the un- derlying Gaussian pro cess has short memor y (under the g eneral assumption that the corr elations are summable ). A data- dr iven pro cedure for optimal bandwidth selection for thes e kernel estimato rs was prop os ed in Ghosh and Draghice scu ( 2002 ), and discussed in detail in Draghicescu ( 2003 ). A new kernel distribution function estimator w as r ecent ly disc us sed in Swanepo el and V an Graa n ( 20 0 5 ), where a data-based choice o f bandwidth w as als o prop osed. The metho d holds for indep e nden t, identically distributed ( iid ) data, and can be extended for weakly dep enden t o bserv a tions. Bosq ( 1998 ) provides a co mprehensive o verview of nonpara metr ic metho ds for sto chastic pro cesses . How ever, there are ma n y D. D ra ghic e sc u and R. Ignac co lo/Mo deling thr eshold exc ee danc e pr ob abilities 151 op en problems r egarding spatia l mo deling of distribution functions. O ne imme- diate, albeit naive approach, is giv en by the so- called indi c ator kriging (Chil` es and Delfiner 1999 , page 383), which is an a daptation of universal krig ing (spa tial int erp olation). Rec e n tly Sho r t et al. ( 2005 ) in tro duced a fully hierarchical ap- proach for modeling distributio n functions fo r biv ariate spatial pro cesses, using a Bay esian fr a mework implemented via MCMC meth o ds. The Commission of the Europea n Union, a s well as the United States E n vi- ronmental Protection Agency , have set limit v alues for some p ollutants in the ambien t air, that were pr ov ed to hav e a nega tive impa ct o n human and e nvi- ronmental health. In particular, recent studies linked traffic-related po llutants to increased r isks of mo rbidity a nd mortality due to respir atory and c a rdiov as- cular illness (see for example Samet et al. 2000 and the references therein). It is therefore imp or tant to ident ify re g ions where the pro bability of exceeding these legal limits is high. In this paper , we fo cus o n particula te ma tter with diameter less than 10 microns (PM 10 ). Exploratory a na lyses and basic statistical models for this p ollu- tant are employ ed in McKendry ( 2000 ), Ignacco lo and Nicolis ( 2005 ), Ra jsic et al. ( 2004 ), among others. A r eview o f r ecent studies on par ticulate matter is given in Schimek ( 2 0 03 ), where a se mi- parametric mo del including weather information is used to link particula te matter to hospital a dmissions in a re g ional s tudy , controlling for po ten tial s patial dependencie s . In contrast to these studies, where P M 10 is mo deled directly , we fo cus on the pro ba bilit y of ex- ceeding the lega l limit. W e use a tw o-stage pro cedure to e s timate the spac e-time exceedance probability o v er a given thres ho ld. The pap er is or ganized as follows. The data set that motiv ated this study is describ ed in Section 2 . Section 3 is devoted to statis tica l methodolo gy , followed by Monte Carlo simulations in Sec- tion 4 , and a n application to air p o llution data in Section 5 . A brief discussion is given is Section 6 . 2. A motiv ating data set W e ana ly ze daily PM 10 concentrations (in µg / m 3 ) during 20 04 a t 22 sites in the North-Italian region Piemon te. The da ta w ere c o llected through the infor- mation s ystem AriaWeb R e gione Piemonte. A detailed descriptio n of this mon- itoring netw ork ca n b e found in Ignaccolo and Nicolis ( 2005 ). The 2 2 r ecords used in this study were selected from Low V o lume Gr avimetric (L V G) monitors , such that the a mount of missing da ta did not exceed 10%. The missing v alues were imputed by using kernel regres sion smo othing with a daptive plug - in ba nd- width ( Gasser et al. 199 1 ). The maximum allowable num b er of days to exceed 50 µg /m 3 is 35, and therefore 50 µg / m 3 is the thr eshold corresp onding to the 0.904 quantile during one year. Detailed explanatio ns of the Eur op ean norms for air po llution are giv en in v an Aalst et al. ( 1998 ). Figure 1 s hows the loc a tions of these 22 sites, together with the r esp ective 0 .904 quan tiles. It ca n be observed that the sites near the Alps hav e lo w er PM 10 v alues, whereas higher p ollution levels are detected in the v alleys, clos er to urban ar- eas. Reg arding the temp oral v ar iations of this pollutant, we found that the D. D ra ghic e sc u and R. Ignac co lo/Mo deling thr eshold exc ee danc e pr ob abilities 152 Fig 1 . L o c ations of 22 air p ol lution monitoring stations in Pie monte; sup erimp ose d 2004 annual 0.90 4 quantiles of daily PM 10 ( µg/m 3 ). behavior of PM 10 has different patterns at differe nt locatio ns , yielding different patterns in the b ehavior of the pr obability of exc eeding 50 µg / m 3 . Given the go o d temp ora l cov erage of the data, w e employ smo othing in the time domain to first mo del these exceedance probabilities in a flexible and compr ehensive wa y . F or an illustratio n, w e s how in Figure 2 the series of daily PM 10 concen- trations for year 2004 at three lo cations, the c orresp onding 0 or 1 probabilities of exceeding 50 µg/ m 3 , and the associa ted smo othed exceedance pro babilities. With resp ect to the tempo ral dep endence structure , these 22 time series display ed short-r ange dep endence, as sho wn by the boxplots of their auto cor re- lation functions in Figure 3 . The same data set is us e d in Bande, Ignacco lo and Nicolis ( 2006 ), where ad- ditional meteorologica l and geogra phical information is included in a model for the space-time PM 10 trend (mean function). With reg ard to mo deling the probability of exceeding the cutoff PM 10 legal v a lue, the preliminar y study Draghicescu and Ig naccolo ( 200 5 ) prop os e s a sequential mo deling technique for the maps of exceeda nce pro babilities in the same regio n, using da ta fro m 17 monitors for the year 20 03. This metho d will b e briefly describ ed in Section 4 , and used for comparisons in the sim ulations and applica tions. D. D ra ghic e sc u and R. Ignac co lo/Mo deling thr eshold exc ee danc e pr ob abilities 153 0 100 200 300 0 50 100 150 0 100 200 300 −0.2 0.0 0.2 0.4 0.6 0.8 1.0 1.2 0 100 200 300 −0.2 0.0 0.2 0.4 0.6 0.8 1.0 1.2 0 100 200 300 0 50 100 150 0 100 200 300 −0.2 0.0 0.2 0.4 0.6 0.8 1.0 1.2 0 100 200 300 −0.2 0.0 0.2 0.4 0.6 0.8 1.0 1.2 0 100 200 300 0 50 100 150 0 100 200 300 −0.2 0.0 0.2 0.4 0.6 0.8 1.0 1.2 0 100 200 300 −0.2 0.0 0.2 0.4 0.6 0.8 1.0 1.2 Fig 2 . Time series of daily PM 10 c onc entr ations, ye ar 2004 (left), c orr esp ond ing 0 or 1 series r epr esenting the 50 µg/m 3 exc e e danc e pr ob abilities (midd le), and smo othe d exc e e danc e pr ob abilities (right) at station 5 (top), station 19 (midd le), and station 11, (b ottom). 3. Theoretical framework Assume that at each lo cation s ∈ D (for some domain D ∈ R 2 ) we o b- serve a temp o ral pro cess of the form X s ( t ) = G s ( t, Z s ( t )) , where G s is an unknown transformation, Z s is a standa rdized stationar y Gaussian pro cess with γ s ( l ) := cov ( Z s ( t ) , Z s ( t + l )) , such that P ∞ l = −∞ | γ s ( l ) | < ∞ . This genera l class of pro cesses includes non-statio na ry and non-Gaussian situations, and is therefor e suitable to model complex environmental data sets. Also note that no paramet- ric assumptions a re made on the temp oral cov a riance s tructure of the pro cess. F or fix e d x 0 ∈ R , define the exceedance proba bility P x 0 ( t, s ) = P ( X s ( t ) ≥ x 0 ) . By using the axioms o f probability , it is immediate to see that P x 0 ( t, s ) takes v alues in [0 , 1] and is non- increasing in x 0 . The problem of interest is to predict P x 0 ( t, s ∗ ) a t lo cation s ∗ ∈ D where there are no observ ations, and at a ny time t, based on o bserv ations of the pro cess X s ( t ) at n time points t 1 , . . . , t n , and at m spatial lo cations s 1 , . . . , s m . Typically m is m uch smaller than n . F urther more, for fixed t , these exceedance pro babilities are a ssumed to b e isotropic in space, meaning that their spatial cov aria nces depend only on the Euclidean dista nce betw een the resp ective lo cations. D. D ra ghic e sc u and R. Ignac co lo/Mo deling thr eshold exc ee danc e pr ob abilities 154 0 1 2 3 4 5 6 7 8 9 10 11 12 13 14 0.0 0.2 0.4 0.6 0.8 1.0 time lag (days) temporal autocorrelations Fig 3 . Boxplots (over the 22 lo c ations) of the empiric al auto c orr elation f unct ions for the time series of daily PM 10 at these lo ca tions, ye ar 2004. The metho d we pr op ose c onsists of tw o steps. W e start by mo deling the tem- po ral e x ceedance pr obabilities for any lo ca tio n where the pro cess is o bserved. Let X s ( t 1 ) , . . . , X s ( t n ) b e the daily P M 10 observed concentrations, assumed to be r ealizations of a pro cess X s ( t ) = G s ( t, Z s ( t )) , and x 0 the PM 10 legal limit. W e stre s s again that the true exceedance probability may change with time and space. Therefore the empirical estimator P n,m ( x 0 ) := 1 nm P n i =1 P m j =1 1 { X s j ( t i ) ≥ x 0 } (analogo us to the empir ical distribution function) is to o rough, and ca nnot cap- ture such changes, making it necessar y to consider different w eights, tha t should depe nd on the lo cal b ehavior of the pro cess . As the pr oblem of interest is not to assess the mean function of the pro ce ss, but the ex ceedance pr obability ov er the given threshold x 0 , we fo cus on the indicato r pr o cess 1 { X s ( t ) ≥ x 0 } . W e assume further that the c hanges o f this indicator proces s with time a r e smooth for all s ∈ D , namely that 1 { X s ( t i ) ≥ x 0 } − P x 0 ( t i , s ) = P ∞ k =1 c k,s,x 0 ( t i ) H k ( Z s ( t i )) , where t i = i n are res caled time p oints, H k denotes the Hermite p olynomial of degree k , and the co efficients c k,s,x 0 are twice cont in uously differentiable with resp ect to t, and contin uo us with resp ect to s and x 0 . F or exa mples o f time-v arying transfor- mations of Ga ussian pro cesses and detailed explanatio ns of assumptions s imila r to the ones ab ov e, we refer to Draghicescu ( 2003 ). In the seco nd step we use spatial interpola tion to pr e dic t the exceedance proba bility over the specified threshold at any lo cation in the region of interest. D. D ra ghic e sc u and R. Ignac co lo/Mo deling thr eshold exc ee danc e pr ob abilities 155 3.1. Estimation of temp or al exc e e danc e pr ob abilities In the initial step w e mo del the tempo ral ris ks non-par ametrically , b y using the Nadaray a-W a ts o n kernel estimator ˆ P x 0 ( t, s ) = P n i =1 K t i − t b t 1 { X s ( t i ) ≥ x 0 } P n i =1 K t i − t b t , (1) where K is a kernel function. F or details on kernel s mo othing we r efer to W and and J ones ( 1995 ). Note that the tempo r al bandwidth b t should not de- pend on the threshold x 0 , in o rder for the resulting estimator to be non-increasing. In what follows, to keep notation simple, we write b instead of b t . Theorem 3. 1. In the ab ove notation, if ∂ 2 ∂ t 2 P x 0 ( t, s ) exist a.e. in [0 , 1] and if ∂ 2 ∂ t 2 V ar 1 { X s ( t ) ≥ x 0 } < ∞ , as n → ∞ , b → 0 and nb → ∞ , for al l s ∈ D and fixe d x 0 ∈ R , fo r the est imator ( 1 ) we have (a) Consistency: M S E ˆ P x 0 ( t, s ) = O max b 4 , 1 nb . (2) (b) Asymptotic n ormality: ˆ P x 0 ( t, s ) − E ˆ P x 0 ( t, s ) q V ar ˆ P x 0 ( t, s ) − → d N (0 , 1) . (3) Sk etc h of the pro of. By using T aylor ex pansions and integral approxima- tions of the sums over the kernel function, it follows that B ias ˆ P x 0 ( t, s ) = E ˆ P x 0 ( t, s ) − P x 0 ( t, s ) = B ( t, s, x 0 ) b 2 + o ( b 2 ) , where B ( t, s, x 0 ) = 1 2 ∂ 2 ∂ t 2 P x 0 ( t, s ) ∗ intu 2 K ( u ) du. Also, V ar ˆ P x 0 ( t, s ) = 1 ( nb ) 2 V ( t, s, x 0 )+ o 1 ( nb ) 2 , where V ( t, s , x 0 ) is b ounded. Sp ecifica lly , Ghosh and Dra ghicescu ( 2002 ) prove that there exist a tempo ral co v aria nce function with the lag-k cov ar iance denoted by g ( k , t, t ′ ) such that V ( t, s, x 0 ) = P n i =1 P n j =1 K t i − t b K t j − t ′ b g ( | i − j | , t, t ′ ) . Co nsistency then follows from Chebyshev’s inequality . The asymptotic norma lit y is an immediate application of res ults in Breuer and Ma jo r ( 19 83 ). Remark 3.1. Estimato r ( 1 ) has the same rate o f co n vergence as in the iid case . Remark 3.2 . An optimal bandwidth can be obtained by minimizing the mean squared error of the estimator ( 2 ). Note that, as in the ii d case, b opt ∼ C n − 1 5 . In pr actice, an optimal bandwidth (lo cal or global) can b e obtained by using plug-in estimators (approximations) of the bias a nd v a riance (see for e x ample Ghosh and Draghice scu 200 2 , Drag hic e s cu 2003 ). While loca l (time-dep endent) bandwidths hav e the adv an tage of dealing with edge effects (at the ends of the time interv a l), it is often the c a se that global (int egrated ov er time) bandwidths considerably decrease computational time, without significant change in the resulting estimator s. D. D ra ghic e sc u and R. Ignac co lo/Mo deling thr eshold exc ee danc e pr ob abilities 156 Remark 3.3. In practice V ar ˆ P x 0 ( t, s ) can be estimated by smo othing the empirical cov a riances, that provide go o d approximations for the ab ov e g ( k , t, t ′ ) , and used to pro duce confidence bands ba sed on the asy mpto tic norma lit y of ˆ P x 0 ( t, s ) . In o ur preliminary analy ses of the PM 10 data, this a ppr oach yielded very nar row ba nds . 3.2. Sp ati al interp olation In the s econd step, we use use s pa tial interpolation (universal kr ig ing) to predict the exceedanc e probabilit y field at a lo cation s ∗ ∈ D where there are no obser- v ations, under the a ssumption of space-time sepa rability . W e mo del the spa tial cov a riances C t ( || s i − s j || ) := C ov ˆ P ( t, s i ) , ˆ P ( t, s j ) parametrica lly , by us ing the Mat` ern stationary cov ariance mo del C t ( || s i − s j || ) = σ t 2 ν t − 1 Γ( ν t ) 2 √ ν t || s i − s j || ρ t ν t K ν t 2 √ ν t || s i − s j || ρ t (4) for fixed t. Our analy ses did not detect ma jor vio lations o f s pa tial iso tr opy (that is , the spatial co rrelations only depend o n dis ta nce, and not on direc- tion). The thres hold x 0 is also fix ed. T o keep notation simple, we omitted it in expression ( 4 ). Γ( · ) is the usual gamma function and K ν t ( · ) is the mo dified Bessel function of the third kind of order ν t ( Abramowitz and Stegun 197 2 ). The parameter ν t > 0 characteriz es the smo othness of the pro cess , σ t denotes the v aria nce of the transformed rando m fie ld, a nd ρ t measures how quickly the correla tions of this field decay with distance. These parameters a re estima ted by maxim um likelihoo d. Then, the b e st linear unbiased predictor (BL UP ) o f the exceeda nce pro bability field a t s 0 ∈ D , is given by a linear co m bination ˆ P ∗ ( t, s 0 ) = P m i =1 λ i ˆ P ( t, s i ) , where the weigh ts λ i , 1 ≤ i ≤ m a re completely determined by the cov aria nce parameters ν t , ρ t , and σ t . The standard error of ˆ P ∗ ( t, s 0 ) can b e also expr essed in terms of the interpo lation pa r ameters λ i . This pro cedure is known as universal kriging ( Stein 199 9 ), and implemen ted in many soft w are pack a ges. In pr actice, the cov ariance para meters are es tima ted from the same data. T o account for their uncer taint y , the standard erro rs of ˆ P ∗ ( t, s 0 ) need to b e adjusted. This can b e done by using co nditional s im ulation techn iques ( Stein 1 999 , Chapter 6), or resampling sc hemes ( Lahiri 200 3 ). Remark 3.4. Linear interp olation do es no t guar antee that the resulting ex- ceedance probability estimator /predictor ta kes v alues in the int erv a l [0 , 1] . A 1 : 1 tr ansformation (suc h a s x ↔ e x 1+ e x ) can b e used first, then p erfor m in ter- po lation on the transformed field, and finally in vert to obtain the desired ex- ceedance proba bilities. How ev er, this t echnical detail did not pro vide impr ov ed maps for the pr esent s tudy . 4. Numerical simulations In this section w e present a sim ulation study that was carr ied out in order to ana ly ze the p erforma nce of the exceedance proba bilit y estimator ˆ P ∗ x 0 ( t, s 0 ) D. D ra ghic e sc u and R. Ignac co lo/Mo deling thr eshold exc ee danc e pr ob abilities 157 0 5 10 15 20 0 5 10 15 20 X time 0 50 100 150 200 −4 −2 0 2 4 Fig 4 . One r e alization of the simulate d sp atial field at fixe d time p oint t = 10 0 (left ), su- p erimp ose d lo c ations of 2 5 r andomly chosen sites; one r e alization of t he pr o c ess at lo c ation marke d “X” (right). int ro duced in Section 3 . W e s im ulated sta tionary isotro pic s pace-time proces ses on a 20 × 20 grid and 200 time p oints. W e considered a separ able cov ar iance mo del factoriz ed as a Whittle-Mat` ern spatial cov a riance by a stable tempor al cov a riance, C ( u, h ) = C T ( u ) C S ( h ) = σ 2 T exp( − u α ) ∗ σ 2 S 2 1 − γ Γ( γ ) h γ K γ ( h ) , where u = | t l − t k | is the time lag and h = || s i − s j || is the spatial distance betw een t wo sites, Γ( · ) is the usual g amma function, and K γ ( · ) is the mo dified Be s sel function o f the third kind of order γ . The computations were done in R, using the function Gauss RF in the libr a ry RandomFields. W e used σ 2 T = 0 . 7 , σ 2 S = 1 . 3 , α = 0 . 2 , and γ = 0 . 5. O ne realization o f the pro cess is sho wn in Figure 4 . In order to as sess the perfor ma nce o f the mapping pro cedure described in Sec- tion 3 , we used the follo wing three metho ds. They a r e all se q uen tial, the second step b eing the same in all three cases (universal kriging with Mat ` er n c ov a r iance function). Firs t metho d is indicator k r iging, that is spatial interpola tion of the empirical exceedance pro babilities. It will b e r eferred to as IND. The nex t ap- proaches r equire a preliminary smo othing step in the temp o ral domain. Thus, the s econd metho d, referr ed to as EDF , is the tw o -step pro c e dure introduced in Draghicescu and Ig naccolo ( 2005 ). F or every time p oint t i , a w eight is assigned D. D ra ghic e sc u and R. Ignac co lo/Mo deling thr eshold exc ee danc e pr ob abilities 158 T a b le 1 Me ans and standar d deviations over 100 simulations of r o ot me an squar e d err ors q P 200 i =1 ( ˆ P ∗ x 0 ( t i ,s 0 ) − P ∗ x 0 ( t i ,s 0 )) 2 200 at lo c ation marke d “X” in Figur e 4 , b ase d on data at the r andomly sele cte d sites (m=24), and on data on the whole grid (m=40 0). Metho d IND : sp atial interp olation of the observe d 0 and 1 e x c ee danc e pr ob abilities; metho d EDF : sp atial interp ol ation of smo othe d exc e e danc e pr ob abilities with weights pr op ortional to the e mpiric al distribution function; metho d K ER : sp atial i nt erp olation of estimate d exc e e danc e pr ob abilities obtaine d by kernel smo othing x 0 = 0 x 0 = 2 m = 24 m = 400 m = 24 m = 400 IND 0.772 (0.0698) 0.0154 (0.1320) 0.1001 (0.0759) 0.078 (0.0521) EDF 0.0095 (0.0983) 0.0098 (0.7095) 0.0542 (0.0930) 0.0327 (0.0198) KER 0.0083 (0.0572) 0.0071 (0.03 52) 0.0493 (0.0087) 0.0278 (0.0065) to the o bserved excee dance probability 0 or 1, cor resp onding to the o r der of the quantile of the PM 10 observ ation for that time p oint (i.e. th e empirical distri- bution function EDF). F or example, if the observed v alue is 80, and 75% o f the data are less than 80 , the resp ective w eight will be 0.75, that is EDF(80). Then the exceedance probabilit y is es timated b y a weigh ted average of the observed exceedances o n a time window centered at t i . In the simulations, applications and v alidation study in next s ection, the w indow width w as fixed and equal to 7 time p oints. The third metho d, called KER is based on kernel s mo othing, as describ ed in detail in Section 3 . T able 1 shows the mea ns and standar d deviatio ns over 100 simulations of the ro ot mean squar ed error s q P 200 i =1 ( ˆ P ∗ x 0 ( t i ,s 0 ) − P ∗ x 0 ( t i ,s 0 )) 2 200 at lo cation marked “X” in Figure 4 , fo r tw o thres ho lds, x 0 = 0 (co rresp onding to the median), and x 0 = 2 (corr esp onding to the 0.9 qua nt ile). F or each time p oint t i , the pr edictor ˆ P ∗ x 0 ( t i , s 0 ) was computed based on da ta at the randomly selected sites (m=24 ), as well as on da ta on the whole g rid (m=400 ). It ca n b e seen that fo r b oth thresholds these ro ot mea n squared er rors a re low est for KER and lar gest for IND. 5. Maps of exceedance probabilitie s for PM 10 in Piemonte W e applied the three methods prev iously des c rib ed to the Piemonte PM 10 data. W e es timated the 50 µg / m 3 exceedance probabilities for ea ch da y of the year 2004. Figure 5 displays these exceeda nce probabilities on F ebruar y 18, 20 04 (left), and F ebrua ry 19, 2004 (right), bas ed on the aforementioned methods. On F ebru- ary 18 the ma xim um v alue of PM 10 for 200 4 was observed a t all sites, with a large decrease the f ollowing day . In this ca se IND do es not seem to w ork well, the maps are very rough, a nd there is an abr upt change from a day to the next. The unshaded region on the F ebruary 19 map is due to negativ e v alues of the predicted exce e dance pro babilities, that, for the a pplied goa l of t his study , can be v iewed as zeros. EDF yields maps with high v alues on almost all the region, while KER shows hig her v alues ar ound the T o rino a rea. As o bs erv atio ns outside D. D ra ghic e sc u and R. Ignac co lo/Mo deling thr eshold exc ee danc e pr ob abilities 159 Fig 5 . Estimate d 50 µg /m 3 exc e e danc e pr ob abilities on F e bruary 18, 2004 (left) and F ebruary 19, 2004 (right); IND (top), EDF (middle), KER (b ottom). D. D ra ghic e sc u and R. Ignac co lo/Mo deling thr eshold exc ee danc e pr ob abilities 160 Fig 6 . Estimate d 50 µg /m 3 exc e e danc e pr ob abiliti es avera ge d over summer (left) and winter (right); IND (top), EDF (midd le), K ER (b ottom). D. D ra ghic e sc u and R. Ignac co lo/Mo deling thr eshold exc ee danc e pr ob abilities 161 1 2 3 0.2 0.3 0.4 0.5 Fig 7 . Boxplots (over t he 22 lo c ations) of the r o ot me an squaer d pr e diction err ors for 50 µg/m 3 exc e e ding pr ob abilities: IND (left), EDF (midd le), KER (right). Piemonte were not av ailable, the estimated ex ceedance pro ba bilities near the bo undaries tend to ha v e la rger erro rs. While these methods provide maps of point e s timates, a nd could g ive a goo d understanding of the pr o cess (by using animatio n tec hniques for example), it is often the case that transformations of p o int es timates are also of in terest. F or instance, sea sonal av erages are very informative summaries for b oth s cient ists and p olicy makers. Figure 6 shows estimated exceedance pr obabilities ov er 50 µg /m 3 av eraged ov er s ummer (left) a nd winter (right), obtained through the three methods. Summer is considered the p erio d b etw een April 1 a nd Septem ber 30. F r om a geo g raphical pr osp ective these methods yield maps that a r e not very different. How ever, from a sta tis tica l point of vie w , EDF or KER hav e the adv antage of making use of all the information in the da ta . As exp ected, in b oth seasons the highest risk s are around the T orino area, with la rger v a lues during the winter. T o assess the p erfor ma nce of these methods, we carr ied out a cross - v alidatio n study . W e used the leave-one-out principle and estimated the daily 5 0 µg /m 3 exceedance pr obabilities at each site, based on o bserv a tions at the remaining 21 sites for eac h da y . The boxplots in Figure 7 display the ro o t mean squared prediction error s obta ined by leaving o ut that site, computed a s the square ro o t of the av erages (ov er the 3 6 6 days o f the year 200 4) of the differences in sq uared D. D ra ghic e sc u and R. Ignac co lo/Mo deling thr eshold exc ee danc e pr ob abilities 162 exceedance probabilities (“observed” - predicted). Here, the “observed” v a lues are 0 or 1 for IND, and the corresp onding smoo thed v a lues (after first step) for EDF and KER, resp ectively . As exp ected, IND p erforms the worst, while KER yields the smalle st error s . 6. Discussion The metho dology propo sed in this paper provides a go o d des criptive a nd visual to ol for modeling threshold exceedance probabilities based on space-time data with la rge temp oral and r elatively small spatial cov erage. It is statistically accu- rate, computatio nally fast, and flexible eno ugh to be suitable for proces ses with complex space -time dep endencies in many applied fields, such as environmental science and manag emen t, a tmospheric sciences, ec ology , epidemiolo gy , finance, medicine. The metho d KER, involving kernel smo o thing in time, follow ed by spatial interpola tion, w as prov ed to provide the mos t accurate and infor mative maps of exc eedance probabilities. Ac kno wle dgements The authors k indly thank Gior gio Arduino, who pr ovided useful info rmation and access to data, and Stefano Ba nde, who helped with the geo co ding for the air po llution maps. W e a r e also gra teful to the Editor, Asso ciate Editor, a nd t w o reviewers for their sugg estions that helped improv e the present ation of this work. The w ork of R. Ignaccolo w as partially supported by the PRIN pro ject n.20061 31039 a nd the Regione P iemonte CIP E pro ject 2004. References v an Aal st, R., Edw ards, L., P u lles, T., De Saeger, E., Tombr ou, M. , and Tonnesen, D. (1998 ). Guidance rep ort on pr eliminary ass essment under EC air qualit y directiv es. T e chnic al r ep ort no. 11, Eur op e an Envir onment A gency. Abramowitz, M. , and Stegun, I. A. (1972). H andb o ok of Mathematic al F u nc- tions With F ormulas, Gr aphs, and Mathematic al T ables . New Y o r k, Dov er. MR02087 97 Bande, S., Ignaccolo, R. , and Nicolis, O. (2006). Spatio -tempo ral mo d- elling for PM 10 in Piemonte. A tti del la XLIII Riunione Scientific a d el la SIS. CLEUP , 8 7–90. Bosq, D. (1998). Nonp ar ametric statistics for sto cha stic pr o c esses. E stimation and pr e diction (seco nd edition). Spr inger. MR16406 91 Breuer, P. , and Major, P . (19 83). Central limit theo rems for non-linea r functionals of Gauss ia n fields. Journal of Multivariate A nalysis , 13 , 425–4 41. MR07169 33 Cha vez-Demoulin, V. , and Embrechts, P. (2 0 04). Smo oth extremal mo dels in finance and insurance. The Journal of R isk and Ins ur anc e, 71(2) , 183–19 9. D. D ra ghic e sc u and R. Ignac co lo/Mo deling thr eshold exc ee danc e pr ob abilities 163 Chil ` es, J.-P. , a nd Delfiner, P. (1999 ). Ge ostatistics: mo deling sp atia l un- c ertainty. John Wiley & Sons. MR16795 57 Da vison, A . C. , and Smith, R.L. (1 990). Mo dels for exce e dances ov er high tres holds. Journal of the R oyal Statistic al So ciety B , 52(3) , 3 93–44 2. MR10867 95 Draghice scu, D. , and I gna ccolo, R. (2005). Spatio-tempora l ma ps o f risk for P M 10 in P iemonte. Contribute d p ap ers for the Italian Statist ic al So ciety Me eting “Statistics and Envir onment”. CLEUP , 275– 278. Draghice scu, D. (20 03). O ptimal ba ndwidth selectio n for kernel es tima to rs of time-v arying quantiles. T e chnic al r ep ort no. 2. C ISE S, The University of Chicago. Draghice scu, D. , a nd Ghosh, S. (20 03). Smo oth nonpara metric quant iles. Pr o c e e dings, MENP-2 , Geometry Balk an Press, 45–52 . MR20823 49 Gasser, T., Kneip, A. , and Koehler, W. (1991 ). A flexible a nd fas t metho d for automatic smo othing. J ou rn al of the Americ an Statistic al As s o ciation , 86 , 643–6 52. MR11470 88 Ghosh, S., Beran, J. , a nd Innes, J. (1997). Nonparametric conditiona l quan- tile estimation in the presence of long-memo ry . Student , 2 , 109–1 17. Ghosh, S. , a nd D raghicescu, D. (20 02). An algorithm for o ptimal band- width selectio n for smo oth nonpar ametric quantile estimation. Statistic al Data Analy sis Base d on the L1-Norm and R elate d Metho ds. Birkh¨ auser, 161–168. MR20013 12 Ignaccolo, R. , and Nicol is, O. (200 5). Analisi Statistica Pr eliminare della Dinamica Spa zio-T emp or ale dei PM 10 in Piemo n te. T e chnic al R ep ort DIGI Dep artment MS Series, 8 . Lahiri, S. N. (2003 ). R esampl ing Metho ds for Dep endent Data . Springer. MR20014 47 McKendr y , I. G. (2000). P M 10 levels in the low er F raser V alley , British Columbia, Canada: An overview of spatiotemp ora l v ariations and meteor o - logical co nt rols. Journal of the Air & Waste Management Asso ciatio n , 50 , 443–4 52. Nadara y a, E. (19 64). On estimating regr ession. The ory of Pr ob ability and Its Applic ations, 9 , 141–142 . Niu, X. F. (199 7). Extr eme v a lue theory for a class of no nstationary time series with a pplica tions. The Annals of Applie d Pr ob abili ty , 7(2) , 50 8–52 2 . MR14423 24 Piegorsch, W. W. , Smith, E. P., Edw ards, D. , and Smith, R. L. (1998). Statistical adv a nce s in environmen tal science. St atistic al Scienc e , 13(2) , 186– 208. Rajsic, S., T asic, M. , Nov akovic, V . , and Tomasevic, M. (200 4 ). Fir st Assessment of the P M1 0 and PM2.5 Particulate Lev el in the Am bien t Air of Belgrade City . Envir onmental Scienc e and Pol lution R ese ar ch , 3 , 158–1 64. Samet, J. M., D o minici, F., Curriero, F. C., Coursac, I. , and Zeger, S. L. (20 00). Fine P articulate Air Pollution and Mortalit y in 20 U.S. Cities, 1987– 1994. The New England Journ al o f Me dicine , 343 , 1742 –1749 . Schimek, M. G. (2003). Con trolling spatial dep endence betw een a PM study D. D ra ghic e sc u and R. Ignac co lo/Mo deling thr eshold exc ee danc e pr ob abilities 164 region and its ba ckground in a semiparametric mo del. Pr o c e e di ngs, The ISI International Confer enc e on Envir onment al St atistics and He alth. Universi- dade de Santiago de Comp ostela Publica cions, 111 – 119. Shor t, M., Carlin, B. P . , and Gelf an d , A. (200 5 ). Biv ariate s pa tial pro cess mo deling for co nstructing indica tor o r in tensit y weigh ted s patial CDFs. J our- nal of A gricultu r al, Biolo gic al, and Envir onmental S t atistics , 10(3) , 25 9–275 . Smith, R. L. (1989). Extreme v alue analysis of en vironmental time series: an application to trend detection in ground- le vel o z o ne. Statistic al Scienc e , 4(4) , 367–3 93. MR10417 63 Stein, M. L. (1999). In terp olation for sp atial data: some the ory of krigi ng. Springer, New Y ork. MR169 7409 Sw anepoel, J. W . H. , and V an Graan, F. C. (2 0 05). A new k ernel distri- bution function estimator based on a no n-parametric tr ansformation of the data. Sc andinav ian Journal of Statistics , 32 , 551–562 . MR22323 42 T a wn, J. A. (1992). E stimating pr obabilities o f ex tr eme sea- levels. Applie d Statistics , 41(1) , 7 7–93. W and, M. P. , and Jones, M. C. (1995). Kernel smo othing. Chapman & Hall. MR13198 18 W a tson, G. (1964). Smooth regr ession analysis. S ankhya, Series A, 26 , 359 – 372. MR0185 765
Original Paper
Loading high-quality paper...
Comments & Academic Discussion
Loading comments...
Leave a Comment