Parameter estimation for computationally intensive nonlinear regression with an application to climate modeling
Nonlinear regression is a useful statistical tool, relating observed data and a nonlinear function of unknown parameters. When the parameter-dependent nonlinear function is computationally intensive, a straightforward regression analysis by maximum l…
Authors: ** - Dorin Drignei (Oakl, University) - Chris E. Forest (Massachusetts Institute of Technology) - Doug Nychka (Pennsylvania State University, National Center for Atmospheric Research) **
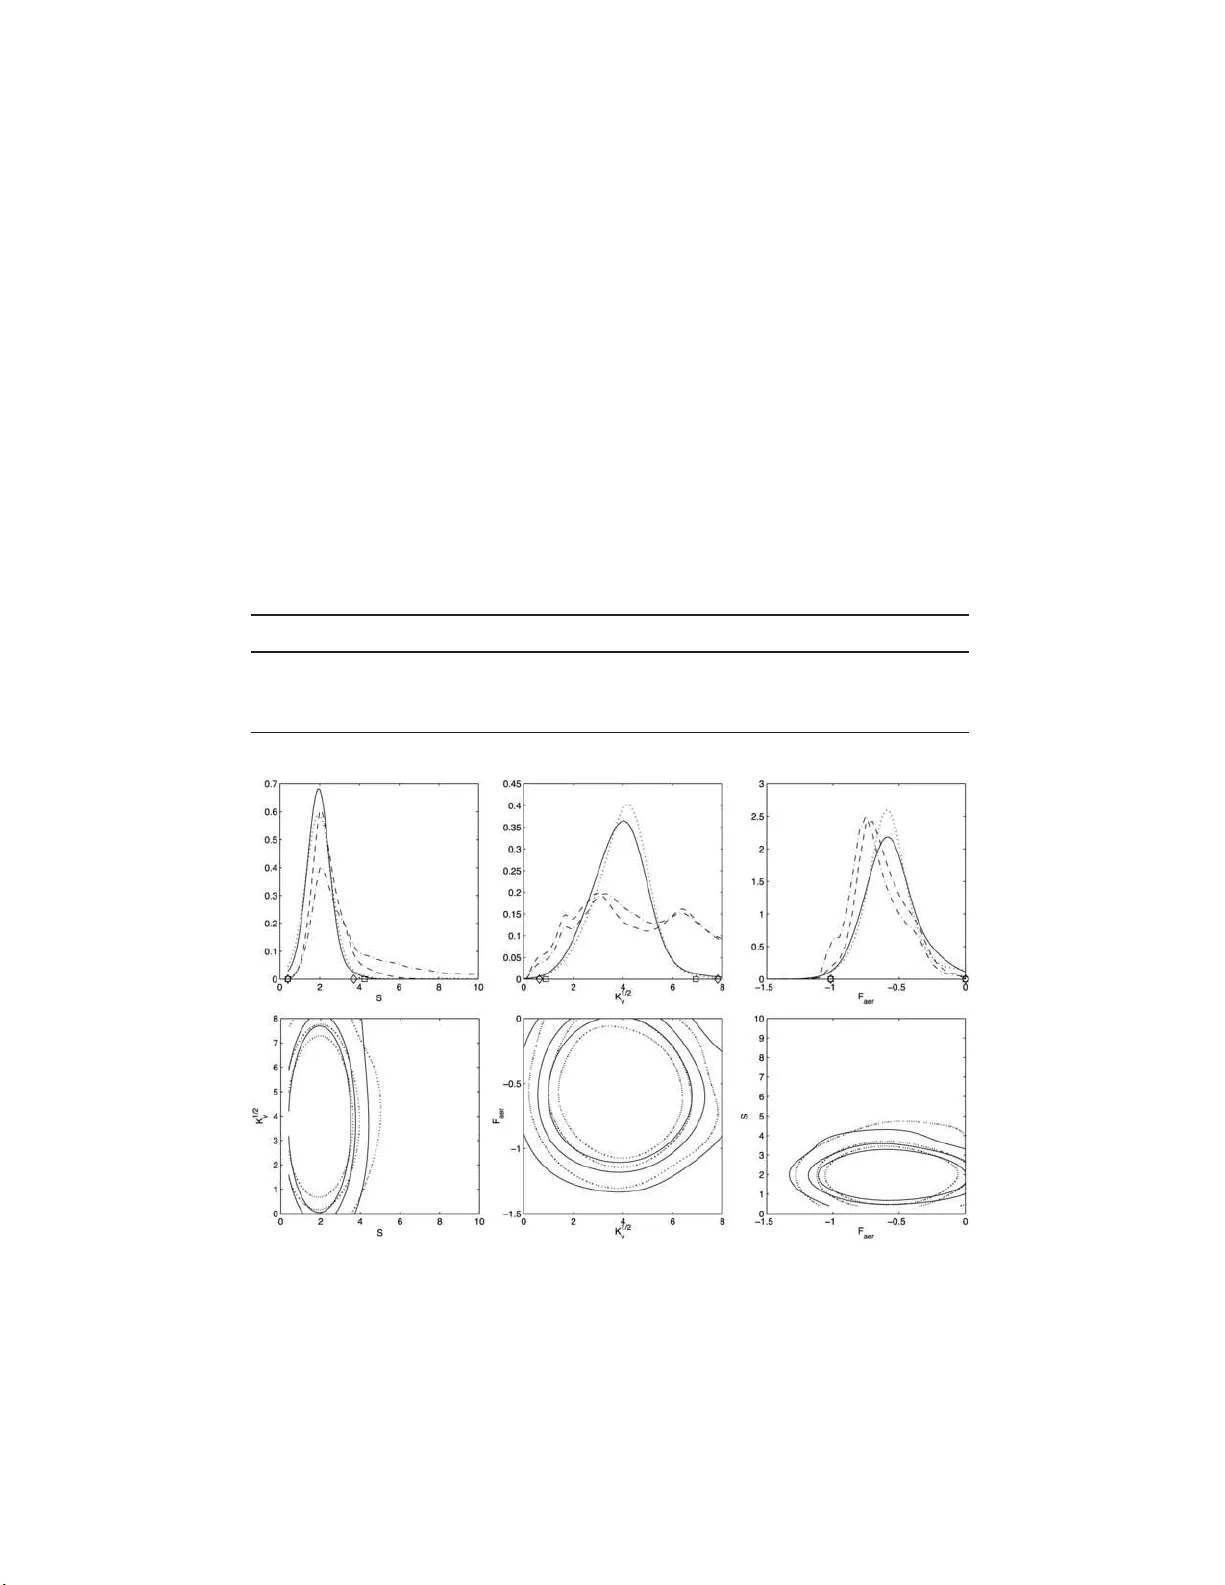
The Annals of Applie d Statistics 2008, V ol. 2, No. 4, 1217–123 0 DOI: 10.1214 /08-A OAS210 c Institute of Mathematical Statistics , 2 008 P ARAMETER ESTIMA TION FOR COMPUT A TIONALL Y INTENSIVE NONLINEAR RE GRESSION WITH AN APPLICA TION TO CLIMA TE MODELING By Dorin Drignei, 1 Chris E. F o rest 2 and Doug Nychka 1 Oakland University, Massachusetts Institute of T e chnolo gy and Pennsylvania State University, and National Center for Atmos pheric R ese ar ch Nonlinear regression is a useful statistical to ol, relating observed data and a n onlinear function of unknown parameters. When the parameter-dep endent n on linear function is computationally inten- sive , a straightforw ard regression analysis by maxim um likeli ho od is not feasible. The metho d presented in th is pap er prop oses to con- struct a faster running surrogate for such a computationally inten- sive nonlinear function, and to use it in a related nonlinear statis- tical mo del that accounts for the u n certaint y asso ciated with t h is surrogate. A pivotal qu antit y in the Earth’s climate system is the climate sensitivit y: the change in global temp erature d u e to doub ling of atmospheric CO 2 concentrati ons. This, along with other climate parameters, are estimated by applying the statistical method devel- oped in this p ap er, where th e computationally in tensive n onlinear function is t he MIT 2D climate mo del. 1. In tro d uction. A fund amen tal question in un derstanding the Earth’s climate system is quantifying the w arm ing of the atmosphere due to in- creased greenh ouse gases. Th is relationship is formalized by the climate sensitivit y , a paramet er defined as the increase in glo b al mean surface t em- p erature d ue to a doubling of CO 2 in th e atmosphere. Although climate sensitivit y an d other climate p arameters are informed by observ ations, their impact can on ly b e ev aluated b y simulations of climate with a n u merical computer mo d el. Such a mo del usually includes atmosphere, o cean, land an d ice comp on ents and is called an atmosphere o cean general circulation mo del Received December 2007; revised September 2008. 1 Supp orted by NSF Grant DMS- 03-55474. 2 Supp orted in p art by t h e NSF-CMG Grant DMS-04-26845. Key wor ds and phr ases. Equilibrium climate sensitivit y, observed and modeled climate, space–time mo deling, statistical surrogate, temp erature d ata. This is an elec tr onic reprint o f the original ar ticle published by the Institute of Ma thema tical Statistics in The Annals of Applie d Statistics , 2008, V ol. 2, No. 4, 1 217– 1230 . This repr int differs from the o riginal in pag ina tion and typogra phic detail. 1 2 D. DRI GNEI, C. E. FOREST AND D. N YCHKA (A OGCM). Because climate is defin ed as a long term a verage of weather, an A OGCM is usually run (in tegrated) o v er man y years in order to establish its mean b ehavio r. T h us, numerical exp eriments with these mo dels requ ire extensiv e computational resources and the num b er of ru n s (also term ed in - tegrations) is often limited. F or example, the Comm unit y Climate System Mo del (CCSM) r equires months of time on a sup ercomputer to sim u late a few h un dred mo del ye ars. Typica lly an A OGCM dep end s on unk n o wn parameters w hic h need to b e estimated and th e statistical c hallenge is to estimate these p arameters along with companion measures of un certain t y using a limited set of climate mo del exp erimen ts. The general statistical problem addressed here is parameter estimation in a nonlinear regression m o del [e.g., Seb er and Wild ( 1989 )], where the nonlinear regression f unction is computationally intensiv e to ev aluate, such as an A O GC M. In particular, the example d iscussed h ere inv olv es observ ed climate data and the MIT 2D climate m o del [Soko lo v and Stone ( 1988 )] as a n onlinear f unction of three uncertain p arameters collec tiv ely denoted b y θ : the equilibrium climate sensitivity S , the diffu s ion of heat anomalies in to the deep o cean K v and the net aerosol f orcing F aer . Here we tak e a maxim um likelihoo d approac h and p a y particular attenti on to the correla- tion structure and its effects on the uncertain ty measures of the resulting estimates. The stand ard nonlin ear regression ap p roac h for this particular estimation problem assum es the follo wing statistical mo del for the observ ed climate data: Y = f θ + ε, (1) where the errors are assumed n ormal w ith zero mean vecto r and co v ariance matrix W . Th e estimated p arameters of th is statistical mod el, includ ing θ , are then obtained b y maximizing the likeli ho o d 1 √ 2 π N 1 √ det W exp − 1 2 ( Y − f θ ) ′ W − 1 ( Y − f θ ) . (2) This is usu ally ac hiev ed by using an iterativ e algorithm. Notice, h o wev er, that this requir es computing f θ for many v alues of θ , or, equiv alen tly , run - ning the climate mo del for a p ossibly large num b er of θ v alues. Su c h an approac h is n ot feasible for applications w here f θ is an A OGCM or even the simplified MIT 2D climate m o del. T o o vercome this computational difficu lty , w e will s ubstitute a statistical surrogate f or f θ , d enoted ˜ f θ , w h ic h will resu lt in a m uch faster estimati on algorithm f or the unknown p arameters θ . T he statistica l mo del for the observed data is no w Y = ˜ f θ + E θ + ε, (3) where E θ is the error in app ro ximating f θ b y ˜ f θ and ε is observ ation error. More precisely , we use analysis of computer exp eriments metho dology [e.g., P A RAMETER ESTIMA TION FOR NONLI NEAR REGRESSIO N 3 San tner et al. ( 2003 )] to analyze climate mo del outp u t data at a s amp le of ‘inp ut’ parameter v ectors and build a statistical sur rogate to pr edict the climate mo d el output at new, untried parameter v alues. Th is analysis is empirical Ba y esian in its nature [as describ ed in Curr in et al. ( 1991 ) for scalar ou tp ut and in Drignei ( 2006 ) for multi ple ou tp uts], in the sense that a Gaussian pr o cess serves as a prior distribu tion for the m ultiple outputs and the p osterior distribution is u sed to pr edict the output at new p arameters. W e tak e ˜ f θ to b e th e p osterior mean, bu t also use the un certain t y ab out this mean to adj u st the like liho o d of observ ations. T o our kn o wledge, the empirical Ba yesian analysis of multi ple outp ut computer exp eriments, used in the con text of p h ysical mo del calibration through maxim um likelihoo d metho ds, is new. The statistical mo del we devel op also accoun ts for different t yp es of uncertain ty (e.g., climate mo del internal v ariabilit y), it includ es correlation with resp ect to v arious dimensions (e.g., sp ace–time correlation) and a new feature of our w ork is to include the u ncertain ty of the surr ogate mo del as part of the estimated parameter uncertain t y . The calibration of computationally in tensiv e computer mo d els has b een recen tly done mostly through fully Ba yesian mo dels, for example, Kenn edy and O’Hagan ( 2001 ), Craig et al. ( 2001 ), Ba y arri et al. ( 2007 ), Higdon et al. ( 2008 ) and the last t wo references dealing w ith multidimensional computer mo del outputs. W e mak e use of the d ata s ets fr om F orest et al. ( 2002 ) w h o imp lemen ted a Ba y esian mo del for the same pr oblem and hav e sh own results from flat and exp ert p riors (see top ro w of Figure 2 ). A notable feature from a climatolog- ical p oin t of view in their w ork is the skewness of the climate sensitivit y S , whic h app ears to b e more p ronounced for fl at priors. App endix A present s a geoph ysical argument in supp ort of this sk ewn ess. F orest et al. ( 2003 ), F or- est, Stone and Soko lo v ( 2006 ) and Sanso et al. ( 2008 ) revisited and r efi ned the Bay esian approac h . Sev eral other studies estimated a probabilit y d ensit y function for climate sensitivit y [Andron ov a and Sc hlesinger ( 2001 ), Gregory et al. ( 2002 ), Knutti et al. ( 2002 , 2003 )]. All su c h stu dies are based on es- timating the degree to wh ic h a climate m o del can repro du ce th e historical climate record. More recen tly , th is same tec hniqu e has also b een applied to the climate record for the past 600 yea r s [Hegerl et al. ( 2006 )]. Last Glacial Maxim um (LGM) climate c hange can also b e used as an additional line of evidence to estimate the p robabilit y densit y fu n ction of the climate sensitiv- it y and such results ha ve b een com bined by Annan and Hargrea v es ( 2006 ) to pro v id e a more complete pictur e of a v ailable constrain ts for placing b ounds on climate sensitivit y . This p ap er is organized as follo ws. Section 2 discus s es the climat e ob- serv ations, the climate mo del and the output data sets. Section 3 develo p s the statistical surrogate for the climate mo d el, while Section 4 shows ho w this surrogate can b e u sed to construct a computationally efficient statistical mo del for the climate observ ations. Th e results are presented in Section 5 and the pap er end s with some conclusions in S ection 6 . 4 D. DRI GNEI, C. E. FOREST AND D. N YCHKA 2. Observ ed an d mo deled climate. 2.1. Climate observations. In this analysis w e use thr ee separate sets of observ ations representi ng th e o cean heat conte n t, surface temp eratures and upp er air temp eratures. The o ceans pla y an imp ortan t role in the planet’s climate system b ecause they can store and transp ort large amoun ts of heat. The su bsurface o cean temp erature records are s p arse and con tain the most u n certain ty due pri- marily to the difficult y in obtaining suc h temp erature data sets. T h e data used in this pap er originate in the Levitus et al. ( 2000 ) o cean temp erature data set from th e surf ace thr ough 3000-mete r dep th, sho w ing a net warming o ve r the last h alf of the t w entieth cen tur y . The upp er-air temp erature d ata set used in this pap er originate s in th e impro v ed upp er-air temp erature data r ecorded by r adiosondes and describ ed in Park er et al. ( 1997 ). T h e later data are considered somewh at more re- liable than satellite-based Microw a ve Soun ding Units (MSU) data b ecause they p ro vide a longer record and a b etter ve r tical resolution. Nev erth eless, the MSU data ha v e prov ed to b e u s eful in removing time-v arying biases of radiosonde temp erature data caused, for example, by c h anges of instru men- tation or op erating pro cedures. P ark er et al. ( 1997 ) describ e some interp ola- tion, bias- an d error-r emoving metho d s for the original sparse and ir regular radiosonde upp er-air temp erature d ata sets. Among all the temp erature records, the sur face temp eratures are the longest, most spatially complete and d o cument ed. This is due p rimarily to the existence of m eteorological stations throughout the w orld for a relativ ely long time. The d ata sets used in this p ap er originate in the extended and in terp olated d ata sets of Jones ( 1994 ). Summary statistics for eac h observ ational dataset are used to mak e the appropriate comparison with the climate mo del (as discussed later). Th e a ve raging metho d s for eac h diagnostic are d iscu ssed in F orest et al. ( 2002 ) and serv e to remo ve the short time-scale v ariabilit y that is n ot asso ciated with the long time-scales c hanges in climate. These a verag es result in th e patterns sum marizing the c hanges in mean temp eratur es for eac h source as discussed in Section 2.3 . 2.2. The MIT 2D climate mo del and the unk nown p ar ameters. A O GC Ms are the pr imary to ols for p redicting c hanges in global climate patterns on planetary scales and at decadal or longer time scales. Mathematica lly , these mo dels are systems of partial different ial equations derive d fr om th e la ws of fluid dynamics and thermo dyn amics for th e atmosphere, o cean, ice and land systems, in three sp atial dimensions (3D) and a temp oral dimen sion. S ince these mo dels are nonlinear, they are u sually solv ed n umerically o ver a space– time grid. These numerical metho d s, h o wev er, require large computational P A RAMETER ESTIMA TION FOR NONLI NEAR REGRESSIO N 5 resources and , therefore, ha ve limited fl exibilit y for exploring parametric (or stru ctural) u ncertain ty . Most often, for a given AOGCM, ind ividual pa- rameters are set according to p erformance of individu al comp on ents (e.g., cloud parameterizatio ns or o cean sub-grid scale mixing parameterizatio ns) and then held fixed or mo difi ed in a h euristic fashion wh en the fu lly coupled A OGCM is assembled and tested. F or a more statistical approac h to deter- mine parameters, we require a flexible climate m o del designed to explore uncertain ty in the large-scale resp onse (e.g., global or hemispheric a ve rage temp erature c hanges) in the fu lly coupled system. The MIT 2D climate mo del [Sok olo v an d Stone ( 1988 )] is one s uc h mo d el designed for these pur- p oses and was used in this r esearc h. Some tec hn ical asp ects of the MIT 2D climate mo del are giv en in App endix B . The MIT 2D mo del has t wo parameters that determine the decadal to cen tury resp onse to external factors that d riv e the climate. Th ese are the equilibrium climate sensitivit y S (measur ed in degrees K ) to a d oubling of CO 2 concen trations and the global- mean v ertical thermal diffusivity K v (measured in cm 2 /s) for the mixing of thermal anomalies into the deep o cean. Sokol o v and Stone ( 1988 ) h a ve sho wn th at the large-scale resp onse of AOGCMs can b e d uplicated by the MIT 2D mo del w ith an app ropriate c hoice of these t wo p arameters. Th is corresp on d ence supp orts the stud y of the climate system using the simpler MIT mo del b ecause it can app ro ximate more complex an d realistic three dim en sional mo d els. Th e third p arameter considered in this pap er is the net aerosol forcing strength F aer (measured in W/m 2 ) and con trols the amoun t of co oling of the atmosphere to increased amoun ts of particles. The compu tational time requ ired to simulate 50 y ears with th e MIT 2D climate mo del is ab out 4 hour s on a 3 GHz P entium 4 Lin ux w orks tation and it is sev eral orders of magnitude faster than sim u lation with a state-of-the-art 3D A O GCM. Given its flexibilit y to du plicate A OGCM resp onses and its computational efficiency , the MIT 2D climate mo del is a to ol w ell suited for answering questions wh ich wo uld b e impractical to explore with 3D A O GCMs. 2.3. Sp e cific data sets and mo del output. Due to the sparsity and the large uncertainti es in the deep-o cean temp erature data, only the linear trend in the observed temp erature record is retained for analysis so that the o cean observ ed d ata is just a scalar. The upp er-air temp er atur e observ ations are the difference in the 1986 –1995 and 1961–19 80 mean temp eratures, recorded at eac h 5 ◦ latitude and at 8 pressur e lev els (850 hP a through 50 hPa ). In order to simplify the analysis, 10 latitude co ordinates con taining mostly missing data ha v e b een discarded, so th at the final up p er-air temp eratur e c hange observ ed data set is a 26 × 8 matrix. Th e su rface temp erature data set has b een av eraged so that th e final su rface temp erature change data set is a 4 × 5 matrix, corresp onding to 4 latitude bands by 5 decades. 6 D. DRI GNEI, C. E. FOREST AND D. N YCHKA Fig. 1. The sample d i nputs. Let θ = [ S, K 1 / 2 v , F aer ] b e the p arameter v ector. W e considered D = 306 parameters θ i as in F orest et al. ( 2002 ), sampled in a p arameter space (see Figure 1 ) to co ver a range of parameters w ell b ey ond the domain corresp ond - ing to cur ren t A O GC Ms. In F orest et al. ( 2002 ), an initial, appro ximately factorial design ov er the domain has b een selected an d then a second, higher densit y sampling h as b een added in the region of highest lik eliho o d to b etter estimate their entire distrib ution. F or eac h parameter v ector in this param- eter sp ace, the relativ ely large mo del output data set is trans f ormed so that its format matc hes that of the observ ed data sets: the deep-o cean temp er- ature trend (scalar), the up p er-air temp erature c h anges (26 latitudes and 8 lev els) and the su rface temp erature c hanges (4 latitude zones and the last 5 decades of the last cen tur y). There are four replicates for eac h of these data sets, calle d ensemble member s , obtained b y changing the initial conditions in the climate mo d el. In this pap er we work with a verag es across en sem- ble m em b ers, although the ensemble v ariabilit y will b e accoun ted for in our statistica l mo del. 3. Statistical s urrogate f or the climate mo del. The statistical mo del for observ ations dev elop ed in this pap er has t wo comp on ents. The fir st comp o- nen t is a surrogate of the climate mo d el output o ve r the r egion of mo del P A RAMETER ESTIMA TION FOR NONLI NEAR REGRESSIO N 7 parameters and the second comp onen t connects the surrogate w ith th e ob- serv ed d ata. Eac h of these comp onents will b e d iscussed next. 3.1. Statistic al mo del for climate mo del output. All three observ ational data sets h a ve a similar s tatistica l mo del, so w e will only pr esent the mo del for sur face temp erature c hanges in detail. The climate mo d el surface tem- p erature c hange can b e con venien tly organized as an array o ve r time, sp ace and climate p arameters, with dimension N T × N Z × D . (F or our d ata s ets, N T = 5, N Z = 4, D = 306.) T o b etter describ e the statistical mo del, this three-dimensional data set is stac ked as a v ector and simply denoted b y f . Climatology argumen ts suggest that the numerica l climate mo del b e decom- p osed in to t wo random comp onents: f = f s + f n corresp ondin g to a climate signal f s and n oise pro cess f n ascrib ed to climate mo del inte rnal v ariabilit y . The correlation matrix for th e signal f s can b e w r itten, und er the compu- tationally conv enien t assumption of separabilit y , as a Kronec ker p ro du ct of smaller correlation matrices C Θ ⊗ C Z ⊗ C T reflecting the v arious dimensions of the problem. T he p o we r exp onentia l [S acks et al. ( 1989 )] was c h osen as a simple bu t fl exible mo d el to describ e the correlations among eac h dimension of climate signal. T he matrix C Θ is defin ed as C Θ ( θ , θ ′ ) = exp − 3 X i =1 η i | θ i − θ ′ i | p i ! . (4) The correlations among zonal bands and across time are also assum ed to follo w the p o we r exp onen tial family , although analysis based on the Mat ´ ern family [e.g., Stein ( 1999 ), page 31] has also b een carried out. The correlation matrix for the noise f n will b e I ⊗ Γ , with a consistent empirical estimator of the space–time co v ariance Γ obtained b y assuming the same space–time structure across the D sampled p arameters and 4 ensem b le mem b ers (after subtracting the ensemble m ean at eac h of the D sampled parameters). A simple m etho d b ased on wa v elet b asis fun ctions [Nyc hk a et al. ( 2002 )] w as used to estimate a nonstationary form that tak es adv an tage of the assump- tion that Γ do es not d ep end on θ and can b e th ou ght of as a regularization of the sample co v ariance matrix. Th e space time fields are expanded in a W- transform multi resolution b asis, with W b eing the matrix of wa v elet basis functions that relate co efficient s to the mo d el field and D b eing the sam- ple co v ariance matrix for the co efficien ts. D is decomp osed as D = H 2 and the elemen ts of H are thresholded by setting 90% of the elemen ts to zero, resulting in a regularized matrix ˜ H . W e use the estimate Γ = W ˜ H 2 W ′ . Then Σ Θ = σ 2 ( C Θ ⊗ C Z ⊗ C T ) + ω 2 ( I ⊗ Γ) is th e o verall co v ariance matrix, so that f ∼ N ( µ 1 , Σ Θ ). The output data analyzed here are temp erature c hanges and a verag es, therefore, w e assume 8 D. DRI GNEI, C. E. FOREST AND D. N YCHKA that an y large scale trends h a ve b een eliminated, ju stifying the c hoice of a statistica l mo del with constant m ean. An u nbiased estimate of the parame- ter ω 2 is obtained b y p o oling the ensemble sample v ariances across inputs, space and time. Th e r emaining statistical parameters are estimated by the maxim um lik eliho o d metho d and all parameters are fixed at their estimated v alues throughou t the rest of the statistical analysis. 3.2. The statistic al surr o gate and its err or. The statistical mo del de- scrib ed ab o v e is u sed to construct a surrogate for the climate mo d el at an arbitrary parameter vec tor θ in the parameter sp ace. T o define the surr ogate for f θ and its error, we consider th e conditional distribution of the climate signal f s θ on the climate m o del outpu t data f , which is multiv ariate n ormal of mean v ector ˜ f θ = µ 1 + ˜ Σ θ Θ Σ − 1 Θ ( f − µ 1 ) and co v ariance matrix V θ = σ 2 ( C Z ⊗ C T ) + ω 2 Γ − ˜ Σ θ Θ Σ − 1 Θ ˜ Σ ′ θ Θ , where ˜ Σ θ Θ = σ 2 ( C θ Θ ⊗ C Z ⊗ C T ) and C θ Θ is defined as in ( 4 ). The surr ogate is ˜ f θ and its error E has a multiv ariate normal distribution N ( 0 , V θ ). The surrogate mo del for the upp er air temp erature is defin ed similarly . The su r- rogate mo del for the deep o cean temp er atur e trend is muc h simp ler b ecause it is based on a univ ariate resp onse. 4. Lik eliho o d fu nction for the observe d data. 4.1. Likeliho o d function for a single data se t. Here w e d ev elop the mo del for the obs erv ed surface temp eratures, w hereas Section 4.2 presents the com- plete statistical mo del for all three d ata sets. The statistical su r rogate dev elop ed ab ov e will not predict p erfectly th e climate mo d el output at new parameters, nor d o w e exp ect it to matc h p erfectly the observed data. Therefore, if Y denotes generically the observed data set in vect or format, then the corresp onding statistical mo d el is Y = ˜ f θ + E θ + ε, where ε is observ ation error with multiv ariate normal d istribution N ( 0 , τ 2 R Z ⊗ R T ) and the elemen ts of the matrices R Z and R T are p o w er exp onen tial cor- relations with parameter vect or ξ . Here E and ε are assumed indep enden t. An imp ortan t statistic al p oint is that the discrepancy b et w een f θ and ˜ f θ is P A RAMETER ESTIMA TION FOR NONLI NEAR REGRESSIO N 9 mo deled exp licitly through the analysis of the computer exp eriments’ ap- proac h in the previous section. The likeli ho o d of the m o del for Y is L ( Y | θ , τ , ξ ) = 1 √ 2 π N Y 1 p det( V θ + τ 2 R Z ⊗ R T ) (5) × exp − 1 2 ( Y − ˜ f θ ) ′ ( V θ + τ 2 R Z ⊗ R T ) − 1 ( Y − ˜ f θ ) . Whereas the computationally intrac table lik eliho o d ( 2 ) con tains the n on- linear climate mo del f θ and the co v ariance matrix W of the observ ation error, the more computationall y efficient likelihoo d ( 5 ) dep end s on the surrogate ˜ f θ of the climate mo del and a co v ariance matrix based on tw o comp onent s: surrogate error and observ ation error. 4.2. F u l l likeliho o d. Let Y s , Y o , Y u denote the observ ed surface temp er- ature c h ange, the observed deep o cean temp erature trend and the obs erv ed upp er air temp erature c hange r esp ectiv ely . These three data sets are as- sumed in dep end en t conditioned on the true climate signal at θ s o that the o ve rall like liho o d to b e optimized is a pro d uct of the lik eliho o d functions dev elop ed in the p revious su b section, for the three sp ecific data sets: L ( Y s , Y o , Y u | θ , τ s , τ o , τ u , ξ s , ξ u ) = L ( Y s | θ , τ s , ξ s ) L ( Y o | θ , τ o ) L ( Y u | θ , τ u , ξ u ) . (Notice that th e observ ation error for the ocean temp erature trend is uni- v ariate norm al.) This lik eliho o d tak es ab ou t 5 seconds to b e ev aluated in Matlab on a computer with d ual 2.6 GHz Xeon pr o cessors and 4 GB RAM. There are geoph ysics argu m en ts in supp ort of a righ t ske w ed d istribution for the climate sensitivit y parameter (see App endix A ) and the literature on the estimation of this parameter rep orts v arious degrees of skewness. This, in turn, mak es it difficult to agree on an upp er confidence b ound for this imp or- tan t parameter: how large will the global m ean su rface temp erature b e when the CO 2 amoun t is doubled? Here we w ould lik e to in vest igate this asp ect through the finite sample distribution of the m axim um likeli ho o d estimators. An established metho d for such pu r p ose is the parametric b o otstrap [Efron and Tibshir an i ( 1993 )], where syntheti c data ¯ Y s , ¯ Y o , ¯ Y u will b e generated from the multiv ariat e normal of lik eliho o d L ( Y s , Y o , Y u | ˆ θ , ˆ τ s , ˆ τ o , ˆ τ u , ˆ ξ s , ˆ ξ u ) , with the maximum lik eliho o d estimates tak en as “tru e” v alues of the p aram- eters. Th e new lik eliho o d of the simulat ed d ata will b e maximized and the p oint estimate ( ¯ θ , ¯ τ , ¯ ξ ) will b e obtained. This pro cess is rep eated B times and, therefore, B indep enden t sim ulated v alues ( ¯ θ , ¯ τ , ¯ ξ ) will b e obtained, whic h will furth er b e u sed to su mmarize the distrib ution of ( ˆ θ , ˆ τ , ˆ ξ ), for ex- ample, through confidence regions. A direct s earc h metho d in Matlab has b een u sed to optimize the lik eliho o d fun ctions throughout th is pap er. 10 D. DRI GNEI, C. E. FOREST AND D. N YCHKA 5. Results. The statistical mo del d escrib ed in Section 3.1 h as b een fitted to th e outpu t d ata and the parameter estimates for the p o we r exp onen tial correlations giv en in T able 1 . An im p ortan t comp onent of the statistical mo del is th e c hoice of co v ariance f amily for the statistical su rrogate. T o determine the sens itivit y to the p o w er exp onential correlation, the Mat ´ ern family wa s also consid ered and we p r esen t how the inference on the climate parameters is effected b y this alternativ e mo del for correlations. T able 1 T able 1 Estimates of p ar ameters in the statistic al mo del f or output data (the p ower exp onential mo del): surfac e temp er atur e (upp er r ow), upp er ai r (midd le r ow) and de ep o c e an (lower r ow) µ η 1 p 1 η 2 p 2 η 3 p 3 η t p t η s p s σ 2 ω 2 0.217 1.365 0.425 1.189 0.273 2.283 0.903 1.22 7 1.147 1.255 1.501 0.024 0.016 − 0.047 1.206 0.302 1.031 0.185 1.274 0.390 14.476 1.849 4.382 1.431 0.007 0.004 0.001 3.430 1.999 21.636 1.999 1.545 1.927 — — — — 2 × 10 − 6 7 × 10 − 9 Fig. 2. Upp er r ow: estimate d univariate mar ginal densities b ase d on p ower exp onential c orr elations (solid) wi th 99% c onfidenc e intervals (diamond), and on the Mat´ ern c orr ela- tions (dot) with 99% c onfidenc e intervals (squar e), and the p osterior pd fs fr om F or est et al. ( 2002 ): exp ert prior for climate sensitivity (dash) and flat priors (dash–dot); L ower r ow: estimate d bivariate densities with c ontours r epr esenting 99%, 95% and 90% c onfidenc e r e gions (soli d lines: p ower exp onential; dotte d lines: Mat´ ern). P A RAMETER ESTIMA TION FOR NONLI NEAR REGRESSIO N 11 T able 2 Estimates of p ar ameters in the statistic al mo del f or output data (the Mat´ ern mo del): surfac e temp er atur e (upp er r ow), upp er air (lower r ow). The de ep o c e an estimates and ω 2 ar e the same as in T able 1 µ η 1 p 1 η 2 p 2 η 3 p 3 α t α s σ 2 0.211 1.399 0.426 1.239 0.267 2.287 0.908 3.9 87 2.682 0.022 − 0.021 1.142 0.323 0.963 0.193 1.171 0.376 6.87 3 12.244 0.006 indicates smo othn ess in the latitude–time dimensions for surf ace temp era- tures and latitude–pressu r e dimensions for upp er-air temp eratures. There- fore, Mat ´ ern correlations generating one-time mean square d ifferen tiable re- alizati ons (i.e., with th e smo othness parameter ν set to 1.5) hav e also b een fitted in th ose dimensions, with th e correlation parameter estimates sho wn in T able 2 . More sp ecifically , the statistical mo del for the outpu t data based on the Mat ´ ern correlations is iden tical to the mo d el presente d in Section 3 , except that the elemen ts of the matrices C Z and C T are no w Mat ´ ern instead of p o w er exp onential correlations, with temp oral and latitude range param- eters d en oted by α t and α s , resp ectiv ely . The p ow er exp onen tial maximized loglik eliho o d minus the Mat ´ ern m aximized loglik eliho o d is 97 for the surface temp erature and 1555 for th e u p p er air output d ata sets, r esp ectiv ely . The mo dels w ith these correlations ha v e b een fur ther used to b uild the surro- gates and the asso ciated er r ors as describ ed in Section 3.2 . These ha ve b een used in the like liho o d of the observ ed d ata (Section 4 ). B = 300 b o otstrap sim u lations were obtained, wh ic h ha v e b een further used to obtain nonpara- metric k ernel marginal density estimates and confid ence in terv als/regions. The results are summarized in Figure 2 . The upp er ro w con tains the univ ari- ate marginal density estimates with 99% confidence inte rv als for b oth p o wer exp onenti al (solid) and Mat ´ ern (dot) mo d els, as well as p osterior p dfs from F orest et al. ( 2002 ); it app ears that a mild righ t sk ewness of the estimated densities for the climate sensitivit y S is pr esen t. T he lo wer ro w con tains the k ern el densit y estimates of the biv ariate m arginal densities un der the p ow er exp onenti al (solid) and Mat ´ ern (dot) mo dels. The con tours corresp ond to 90%, 95% and 99% lev els confi dence regions. The results from these t wo cor- relation mo dels (p o w er exp onentia l and Mat ´ ern) do not app ear to b e largely differen t. The inclusion of correlations was helpful in b etter constraining the climate system parameters than in the statistical mo del considered in F orest et al. ( 2002 ), wh ic h did not include suc h correlations. 6. Conclusion. This pap er has p resen ted a computationally efficient sta- tistical m o del as an alternativ e to a naive n onlinear regression mo d el in- v olving a computationally in tensive n onlinear function. O ur approac h is to construct a statistical mo del th at includes a faster r unnin g su rrogate for the 12 D. DRI GNEI, C. E. FOREST AND D. N YCHKA computationally in tensive nonlinear function and it is underlin ed by some general p rinciples. T he statistical mo d el offers a comprehensiv e framewo r k to accommodate v arious sources of uncertaint y . F or example, we incorp orated an err or term to represent climate int ernal v ariabilit y and a comp onent for uncertain ty in the surrogate, as we ll as an observ ation err or term. The co- v ariance matrices are full rank and estimated from the av ailable forced mo d el output data. The statistical mo d el pr op osed acco unts f or correlation in all dimensions of the problem (e.g., it includes s patio-temp oral correlation). This strategy wa s helpfu l to b etter constrain the un kno w n climate mo del parameters through tighte r confid ence interv als and regions, esp ecially f or the climate sensitivit y S and o cean diffus ivity K v parameters. APPENDIX A: CL I MA TE SENS I TIVITY An imp ortant c h aracteristic in the Earth’s climate system is the climate sensitivit y S : the c h ange in global temp eratur e d ue to doub ling of atmo- spheric CO 2 concen trations. In complex climate mo dels deriv ed f rom the fundamental equations of physics, the ind ividual pro cesses interact and th e feedbac ks b et w een the key pr o cesses lead to the ov erall amplification of the temp erature c h ange. A t the b asic lev el, the additional greenhous e gases (e.g., carb on dio xid e, methane and nitrous o xide) ha ve a d irect impact on the out- going longw a ve radiation in the atmosphere and in the absence of feedbacks (i.e., the n on temp erature atmospheric state v ariables r emains unc hanged), this c hange to th e system will even tually lead to a giv en amount of tem- p erature c hange. But, when the temp erature c hanges, this will inevitably lead to additional c hanges in the temp er atur e and h u midit y profiles, cloud distributions, sno w and ice co ve r, and other state v ariables. T hese additional c hanges are the climate sys tem feedb ac ks th at can amplify or redu ce the di- rect impact of the greenh ou s e gases on the r adiativ e forcing. If we let ∆ T o b e the temp erature c han ge due to the direct impact on the radiativ e transfer, w e note that ∆ T o includes one f eedbac k, the dir ect impact of temp erature c hange on th e inf rared sp ectrum b y c hanging greenhouse gas concen trations, but do es not include add itional feedbac ks f rom other comp onents of the cli- mate system. It is customary to let th e total c h ange in global mean su rface temp erature ab o v e the equilibrium v alue b e written as ∆ T 2 x = ∆ T o (1 − φ ) [e.g., see Hansen et al. ( 1984 ) or Schlesinge r and Mitc hell ( 1987 )]. Thus, we ha ve a one-to-one corresp ondence b et we en the feedbac k and the climate s en sitivit y (∆ T 2 x and the uncertain ties in eac h can b e related). This relation b et we en climate sensitivit y and feedbac ks has b een kn o wn since the early days of climate researc h and w as describ ed in th e Charney Rep ort [NR C ( 1979 )], form alized in Hansen et al. ( 1984 ) and in cluded in textb o oks as early as Hend erson-Sellers and McGuffie ( 1987 ). Hence, we P A RAMETER ESTIMA TION FOR NONLI NEAR REGRESSIO N 13 no w h a ve a simple expression to relate the un certain t y in these three v ari- ables and fr om first p rinciples, ∆ T o and φ are the t wo v ariables whic h can b e quan tified in dividually using climate m o dels and com b ined to yield ∆ T 2 x . Sc h lesinger and Mitc hell ( 1987 ) qu an tified the uncertain ties in feedbac ks and recognized th at the uncertain ties in individual pro cesses will com bine to pro- vide an estimate of the total un certain t y . Giv en the num b er of pr o cesses in the sys tem, it is t ypical to consider the net f eedbac k to hav e a normal dis- tribution. How ev er, we also need to consid er ∆ T o as an additional un certain v ariable with its o wn normal distrib ution, although this is a small con tri- bution compared to φ . By com bining these t wo distribu tions f or ∆ T o and φ , the resulting distribution for climate s en sitivit y is exp ected to b e righ t sk ewed, although one cannot clearly infer only from these argument s ho w long the right tail will b e. APPENDIX B: TEC HNICAL ASPEC TS O F THE MIT 2D CLIMA TE MODEL The MIT 2D climate mo d el consists of a zonally a verag ed atmospheric mo del coupled to a mixed-la y er Q-flux o cean mo del, with h eat anomalies diffused b elo w th e mixed-la y er. The mo del details can b e found in Sok olo v and Stone ( 1988 ). The atmospheric mo del is a zonally a ve raged v ersion of the Go dd ard Institute for Space Studies (GISS ) Mo del I I general circulation mo del [Hansen et al. ( 1983 )] with p arameterizatio n s of th e eddy transp orts of momen tum , h eat and moistur e b y baro clinic edd ies [Stone and Y ao ( 1987 , 1990 )]. Th e mo del version we use has 24 latitude bands an d 11 v ertical lay ers with 4 la yers ab o v e the trop opause. The mo del also emp lo ys a Q-flux o cean m ixed la ye r mo del with diffusion of h eat anomalies int o the deep-o cean b elo w th e climatologi cal mixed lay er. This m o del of the o cean comp onent of the climate sys tem is fu lly describ ed b y Hansen et al. ( 1983 ) and only increased computations by a few p ercen t. The mo del u ses the GISS radiativ e transfer co de wh ic h cont ains all radia- tiv ely imp ortan t trace gases, as well as aerosols and their effect on radiativ e transfer. The sur f ace area of eac h latitude band is divided in to a p ercent- age of land, o cean, land -ice, and sea-ice with the surface fluxes computed separately for eac h surf ace t yp e. This allo w s for appropriate treatmen t of ra- diativ e forcings dep endent on underlying surf ace t yp e suc h as ant hrop ogenic aerosols. The atmospheric comp onen t of the mo del, th erefore, pro vid es most imp ortant nonlinear interact ions b et w een comp onen ts of the atmospheric system. Ac kn o wledgment . Th is researc h w as dev elop ed while Dorin Drignei wa s a visiting scien tist at the National Center for At mospheric Researc h. 14 D. DRI GNEI, C. E. FOREST AND D. N YCHKA REFERENCES Androno v a , N. G. and Schlesinger, M. E. (2001). Ob jectiv e estimation of th e proba- bilit y d en sit y function for climate sensitivity . J. Ge ophys. R es. 106 22,605–22,61 2. Annan, J. D. and Har grea v es, J. C. (2006). Using multiple observ ationally-based constrain ts to estimate cl imate sensitivit y . Ge ophys. R es. L et. 33 L06704. DOI: 10.1029 /2005GL0 25259. Ba y arri, M. J. , W alsh, D. , Berger, J. O. , Cafeo, J. , Garcia-Dona to, G. , Li u, F. , P alomo, J. , P ar thasara thy, R. J. , P aulo, R. and Sacks, J. (2007). Computer mod el va lidation with funct ional output. Ann. Statist. 35 1874–1 906. MR2363956 Craig, P. S. , Goldstein , M. , Rougier, J. C. and Seheul t, A. H . ( 2001). Bay esian forecasting for complex systems using computer sim ulators. J. Amer. Statist. Asso c. 96 717–729 . MR1946437 Currin, C. , Mitchell, T. , Morris, M. and Y l visaker, D. (1991). Ba yesian prediction of deterministic functions, with applications to the design and analysis of computer exp eriments. J. Amer . Statist. Asso c. 86 953–963. MR1146343 Drignei, D. (2006). Empirical Bay esian analysis for high-dimensional compu t er output. T e chnomet rics 48 230–24 0. MR2277677 Efr on, B. and Tibshirani, R. J. (1993). An I ntr o duction to the Bo otstr ap . Chapm an and H all, N ew Y ork. MR1270903 F orest, C. E. , Stone, P. H. , Sokolo v, A. P. , Allen, M . R. and Webster, M. D. (2002). Qu antif ying u ncertainties in climate system prop erties with the use of recent climate observ ations. Scienc e 295 113–117 . F orest, C. E. , Nychka, D. , Sanso, B. and Te baldi, C. (2003). T o wards a rigorous MCMC estimation of PDFs of Climate System Prop erties. Eos T r ans. A GU F all Meet- ing Sup pl. 84 Abstract GC31B-019 6. F orest, C. E. , Stone, P. H. and S ok olov, A. P. (2006). Estimated PDFs of climate system prop erties inclu d ing natural and anthropogenic forcings. Ge ophys. R es. L et. 33 L01705. DOI : 10.1029 /2005GL0 23977. Gregor y, J. M. , Stouffer, R. J. , Raper, S. C. B. , S tott, P. A. and Ra yner, N. A. (2002). A n observa tionally based estimate of th e climate sensitivity . J. Cli m ate 15 3117–31 21. Hansen, J. , Russell, G. , Rin d, D. , Stone, P. , Lacis, A . , Le bedeff, S . , Ruedy, R. and Tra vis, L. (1983). Efficient three-dimensional global mo dels for climate studies: Models I and I I. Mon. W e ath. R ev. 111 609–662. Hansen, J. , Lacis, A. , Rind, D. , Russell , G. , Stone, P. , Fung, I. , Rued y , R. and Lerner, J. (1984). Climate sensitivity: A nalysis of feedbac k mechanisms. Climate pro- cesses and climate sensitivity . In Ge ophysic al Mono gr aph (J. E. Hansen and T. T aka - hashi, eds.) 29 130–163. American Geophysical Union, W ashington, DC. Hegerl, G. C. , Cro wley, T. J. , H yde, W. T. and Frame, D. J. (2006). Climate sensitivit y constrained by temp erature reconstructions o ver the past seven centuries. Natur e 440 . D O I: 10.1038/ nature04679. Henderson-Sellers, A. and McG uffie, K. (1987). A C limate Mo del ling Pri m er , 1st ed. Wiley , Chic hester. Higdon, D. , G a ttiker, J. , Wi lliams, B. and R ightley, M. (2008). Computer mo del calibration using high dimensional outputs. J. Amer. Statist. Asso c. 103 570–583. Jones, P. D. (1994). Hemispheric surface air temp erature v ariations: A reanalysis and an up date to 1993. J. Cli mate 7 1794–18 02. Kennedy, M . C. and O’Hagan, A. (2001). Ba yesian calibration of computer mo dels. J. R oy. Statist. So c. Ser. B 63 425–450. MR1858398 P A RAMETER ESTIMA TION FOR NONLI NEAR REGRESSIO N 15 Knutti, R. , Stocker, T. F. , Joos , F. and Pla ttner, G.-K. (2002). Constraints on radiativ e forcing and futu re climate change from observ ations and climate m o del en- sem bles. Natur e 416 719–7 23. Knutti, R. , Stocker, T. F. , Joos, F. and Pla ttner, G.-K. (2003). Probabilistic climate change pro jections using neu ral netw orks. Cl i m. Dyn. 21 257–272. Levitus, S. , An tono v, J. , Boyer, T. P. and Stephens, C. (2000). W arming of the W orl d Ocean. Scienc e 287 2225–2229. Na tional R esearch Council ( NRC) (1979). Carb on Dioxide and Cli mate: A Scientific Assessment . N ational Academy Press, W ashington, DC. Nychka, D. , Wikle, C. and Ro y le, J. A. (2002). Multiresol ution mo dels for nonsta- tionary spatial co v ariance functions. Statist. Mo del ling 2 315–332. MR1951588 P arker, D. E. , Gordon, M. , Cullum, D. P. N. , Sexton, D. M. H. , Fol land, C. K. and Ra yne r, N. (1997). A new global gridded radiosonde temp erature data base and recent t emp erature trends. Ge ophys. R es. L ett. 24 1499–1502. Sacks , J. , Welch, W. J. , Mi tchell, T. J. and Wynn, H. P. (1989). Design and analysis of computer ex p eriments. Statist. Sci. 4 409–423 . MR1041765 Santner, T. J. , William s, B. J. and Notz, W. I. (2003). T he Design and Analysis of Computer Exp eriments . Springer, N ew Y ork. MR216070 8 Sanso, B. , Forest, C. E. and Zan tedeschi, D. (2008). In ferring climate system prop- erties using a computer mo del. Bayesian Anal. 3 1–38. Schlesinger, M. E. and Mi tchell, J. F. B. ( 1987). Climate mod el simula tions of the equilibrium climatic resp onse to increased carb on dioxide. Re v. Ge ophys. 25 760–798. Seber, G. A. F. and Wild, C. J. (1989). N onl ine ar R e gr ession . Wiley , New Y ork. MR0986070 Sok olov, A. P. and Stone, P. H. (1998). A fl exible climate mo del for use in integrated assessmen ts. Cl im. Dyn. 14 291–303. Stein, M. L. (1999). I nterp olation of Sp atial Data: Some The ory for Kriging . Sprin ger, New Y ork. MR1697409 Stone, P. H. and Y ao, M. S. (1987). Developmen t of a tw o-d imensional zonally a ver- aged statistical–dynamical mo del. I I : The role of ed d y momentum fluxes in the general circulation and t heir parametrization. J. Atmos. Sci. 44 3769–3786. Stone, P. H. and Y ao, M. S. (1990). Developmen t of a tw o-d imensional zonally a ver- aged statistical–dynamical mod el. I I I : Parametrizati on of the eddy fluxes of heat and moisture. J. Cl imate 3 726–740. D. Drignei Dep ar tment of Ma thema tics and St a tistics Oakland Un iversity R ochester, Michig an 48309 USA E-mail: drignei@oakland.edu C. E. Fores t Dep ar tment of Ear th, A tmospheric and Planet ar y Sciences Massachusetts Institute of Technology Cambridge, Massachusetts 02139 and Dep ar tment of Meteorology Pennsyl v ania St at e Un iversity University P ark, Pennsyl v ania 16802 USA E-mail: ceforest@mit.edu ceforest@meteo.psu.edu D. Nychka Na tional Center for A tmospheric Research Boulder, Colorado 80307 USA E-mail: n yc hk a@ucar.edu
Original Paper
Loading high-quality paper...
Comments & Academic Discussion
Loading comments...
Leave a Comment