Event Discovery in Time Series
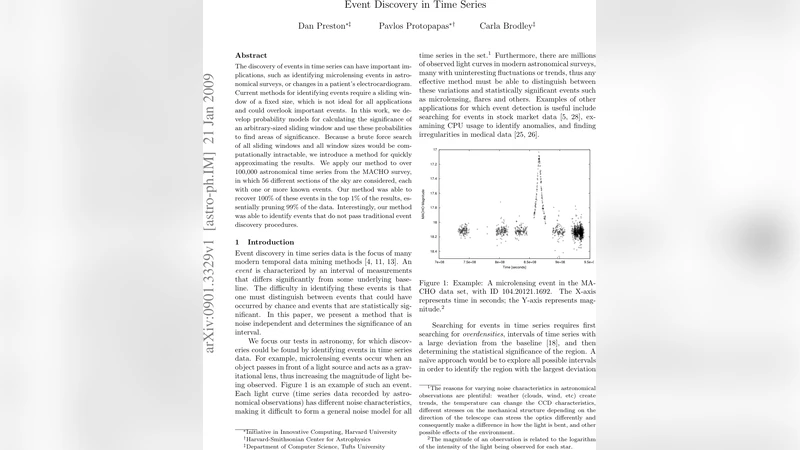
The discovery of events in time series can have important implications, such as identifying microlensing events in astronomical surveys, or changes in a patient’s electrocardiogram. Current methods for identifying events require a sliding window of a fixed size, which is not ideal for all applications and could overlook important events. In this work, we develop probability models for calculating the significance of an arbitrary-sized sliding window and use these probabilities to find areas of significance. Because a brute force search of all sliding windows and all window sizes would be computationally intractable, we introduce a method for quickly approximating the results. We apply our method to over 100,000 astronomical time series from the MACHO survey, in which 56 different sections of the sky are considered, each with one or more known events. Our method was able to recover 100% of these events in the top 1% of the results, essentially pruning 99% of the data. Interestingly, our method was able to identify events that do not pass traditional event discovery procedures.
💡 Research Summary
The paper addresses the fundamental problem of detecting transient events in time‑series data—a task that underlies applications ranging from microlensing searches in astronomy to the identification of abnormal heartbeats in electrocardiograms. Traditional pipelines rely on a sliding window of fixed length, computing a simple statistic (e.g., mean shift, variance change) inside each window and comparing it to a pre‑set threshold. While straightforward, this approach suffers from a critical mismatch: real events have heterogeneous durations, so a single window size either dilutes short events or fails to capture long ones, leading to missed detections or inflated false‑alarm rates.
To overcome this limitation, the authors develop a probabilistic framework that evaluates the statistical significance of any contiguous segment, regardless of its length. Assuming the background observations follow a known distribution—typically Gaussian with mean μ and variance σ²—they compute, for each candidate interval
Comments & Academic Discussion
Loading comments...
Leave a Comment