As outflow activity in low mass protostars is strongly connected to ac- cretion it is reasonable to expect accreting brown dwarfs to also be driving out- flows. In the last three years we have searched for brown dwarf outflows using high quality optical spectra obtained with UVES on the VLT and the technique of spectro-astrometry. To date five brown dwarf outflows have been discovered. Here the method is discussed and the results to date outlined.
Deep Dive into Searching for Brown Dwarf Outflows.
As outflow activity in low mass protostars is strongly connected to ac- cretion it is reasonable to expect accreting brown dwarfs to also be driving out- flows. In the last three years we have searched for brown dwarf outflows using high quality optical spectra obtained with UVES on the VLT and the technique of spectro-astrometry. To date five brown dwarf outflows have been discovered. Here the method is discussed and the results to date outlined.
It is now apparent that protostellar-like outflows commonly accompany the formation and evolution of brown dwarfs (BDs; 12,16,18). The overall motivation of this project is to investigate the validity of the accretion/ejection models for the formation of solar-mass stars at the lowest masses, through the study of BD outflows. Ultimately, results will be used to form a better understanding of the outflow mechanism in general. Much of what is known about low mass star formation and in particular the connection between magntospheric accretion and outflow activity comes from studying the classical T Tauri stars (CTTS). Forbidden emission lines (FELs) have proved to be effective tracers of outflow activity in CTTSs and to date they have been used to explore the kinematics, morphology and physical conditions of jets, at high angular resolution (13). The so-called traditional tracers of CTT jets, i.e. [OI]λ λ 6300,6363, [SII]λ λ 6716,6731, [NII]λ 6583 lines, are found in the spectra of BDs. This finding was the first indication that BDs launch outflows.
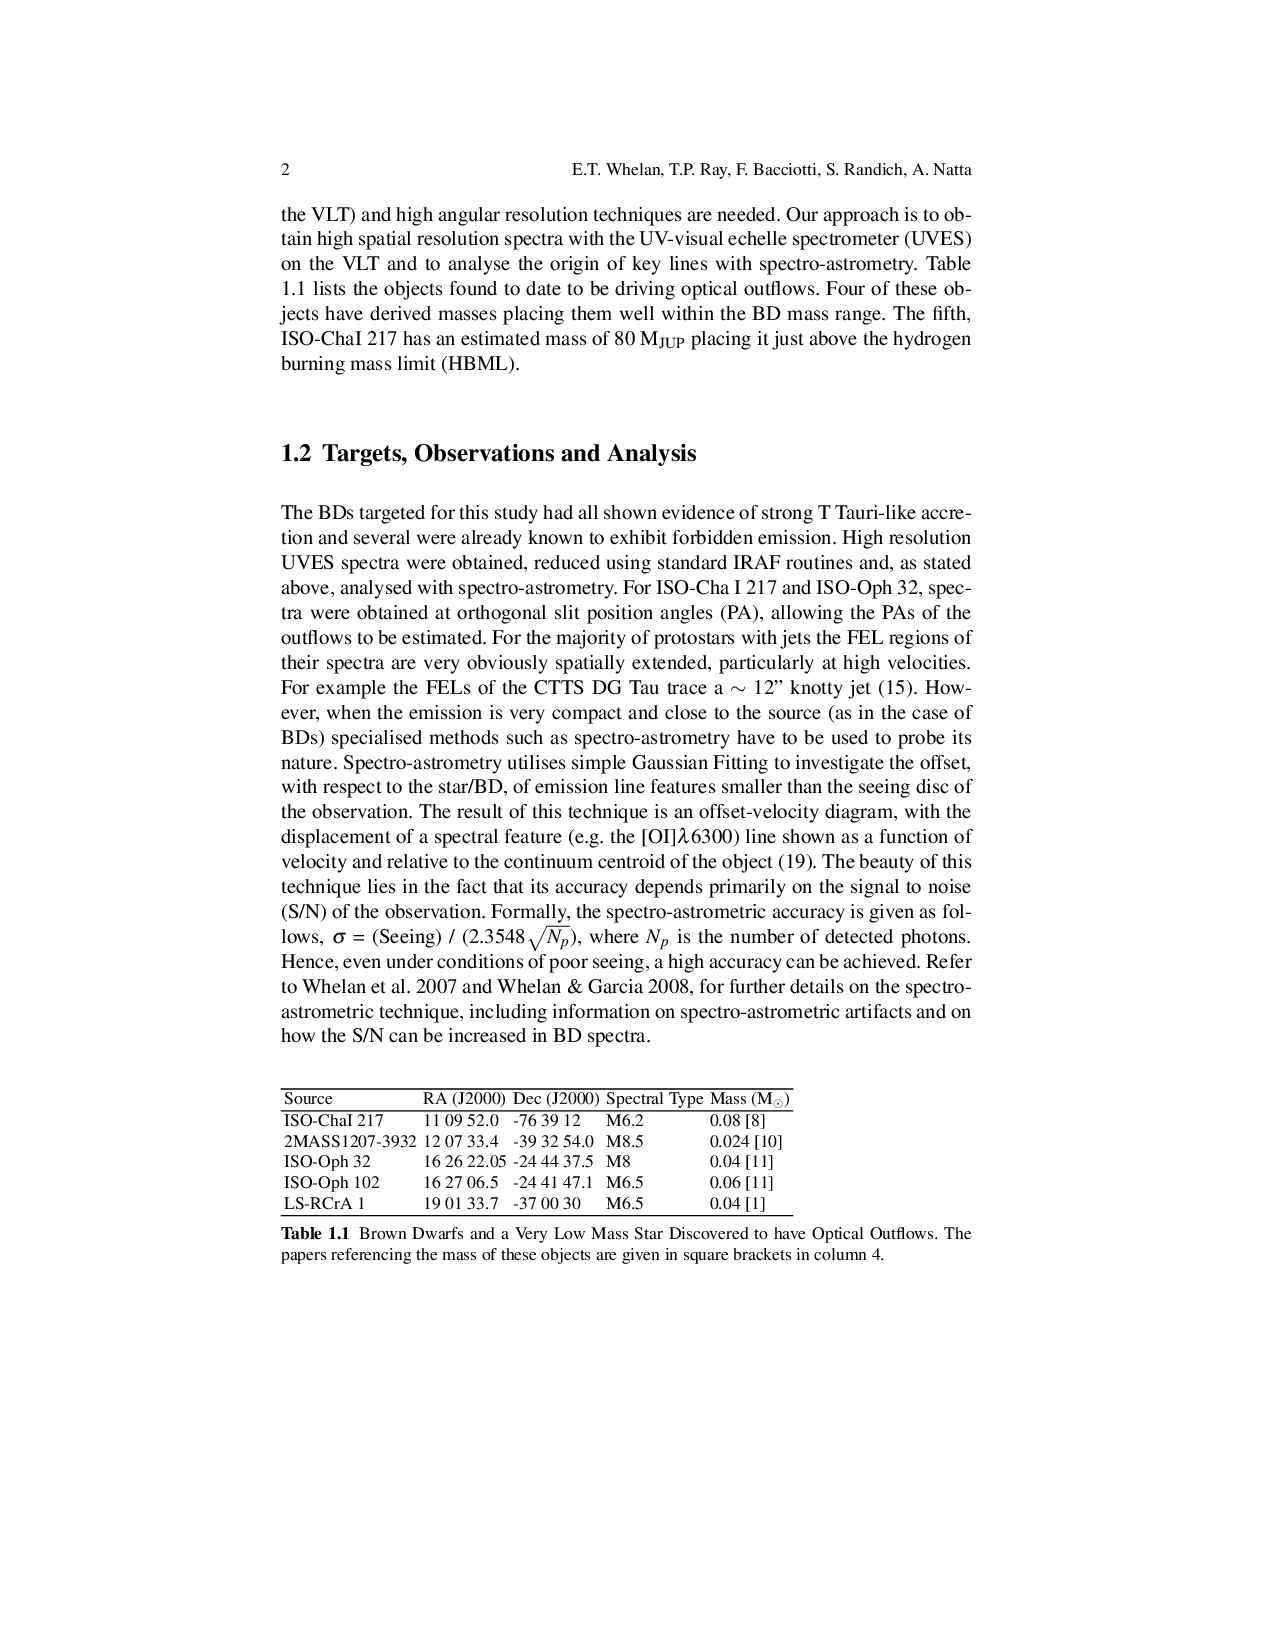
BDs outflows are difficult to detect as they are faint and FEL tracers are only extended on milli-arcsecond scales. Hence long exposure times (∼ 1.5 hours with the VLT) and high angular resolution techniques are needed. Our approach is to obtain high spatial resolution spectra with the UV-visual echelle spectrometer (UVES) on the VLT and to analyse the origin of key lines with spectro-astrometry. Table 1.1 lists the objects found to date to be driving optical outflows. Four of these objects have derived masses placing them well within the BD mass range. The fifth, ISO-ChaI 217 has an estimated mass of 80 M JUP placing it just above the hydrogen burning mass limit (HBML).
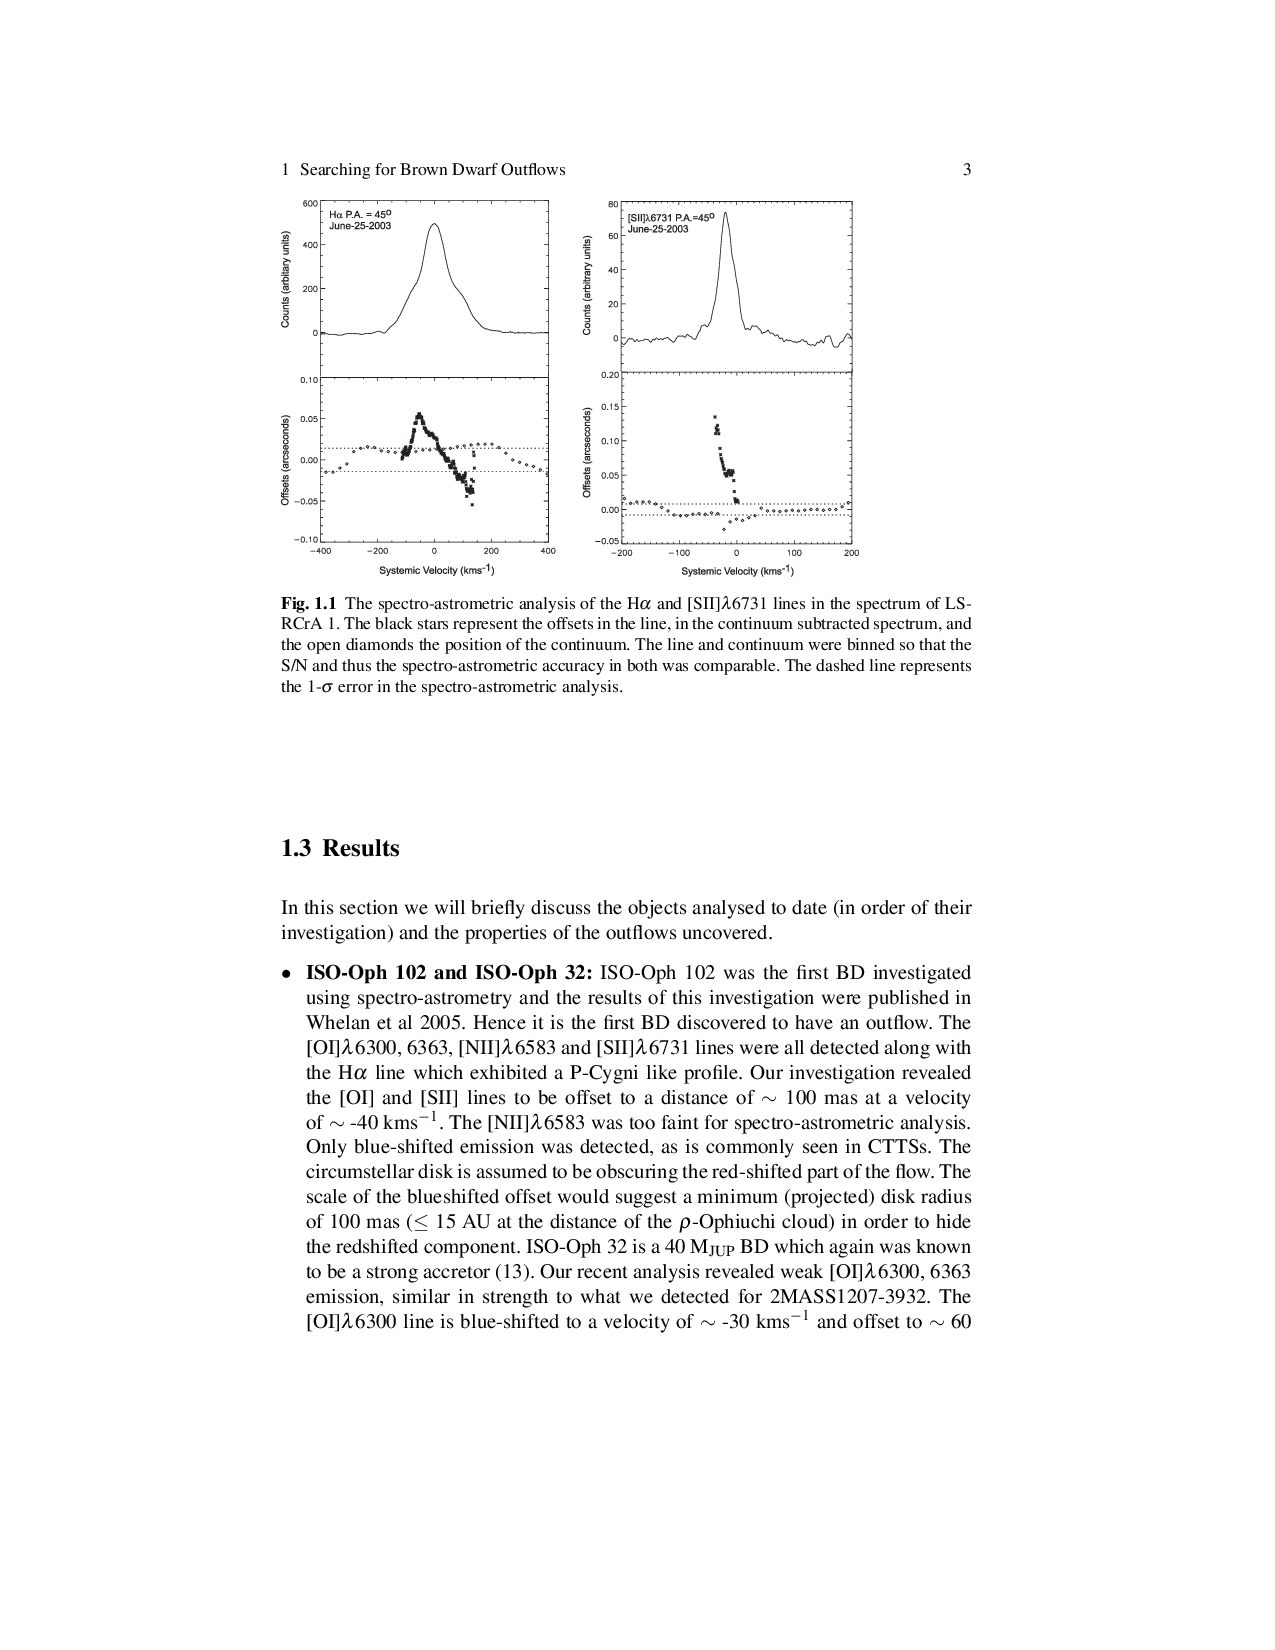
The BDs targeted for this study had all shown evidence of strong T Tauri-like accretion and several were already known to exhibit forbidden emission. High resolution UVES spectra were obtained, reduced using standard IRAF routines and, as stated above, analysed with spectro-astrometry. For ISO-Cha I 217 and ISO-Oph 32, spectra were obtained at orthogonal slit position angles (PA), allowing the PAs of the outflows to be estimated. For the majority of protostars with jets the FEL regions of their spectra are very obviously spatially extended, particularly at high velocities. For example the FELs of the CTTS DG Tau trace a ∼ 12" knotty jet (15). However, when the emission is very compact and close to the source (as in the case of BDs) specialised methods such as spectro-astrometry have to be used to probe its nature. Spectro-astrometry utilises simple Gaussian Fitting to investigate the offset, with respect to the star/BD, of emission line features smaller than the seeing disc of the observation. The result of this technique is an offset-velocity diagram, with the displacement of a spectral feature (e.g. the [OI]λ 6300) line shown as a function of velocity and relative to the continuum centroid of the object (19). The beauty of this technique lies in the fact that its accuracy depends primarily on the signal to noise (S/N) of the observation. Formally, the spectro-astrometric accuracy is given as follows, σ = (Seeing) / (2.3548 N p ), where N p is the number of detected photons. Hence, even under conditions of poor seeing, a high accuracy can be achieved. Refer to Whelan et 1.1 The spectro-astrometric analysis of the Hα and [SII]λ 6731 lines in the spectrum of LS-RCrA 1. The black stars represent the offsets in the line, in the continuum subtracted spectrum, and the open diamonds the position of the continuum. The line and continuum were binned so that the S/N and thus the spectro-astrometric accuracy in both was comparable. The dashed line represents the 1-σ error in the spectro-astrometric analysis.
In this section we will briefly discuss the objects analysed to date (in order of their investigation) and the properties of the outflows uncovered. Only blue-shifted emission was detected, as is commonly seen in CTTSs. The circumstellar disk is assumed to be obscuring the red-shifted part of the flow. The scale of the blueshifted offset would suggest a minimum (projected) disk radius of 100 mas (≤ 15 AU at the distance of the ρ-Ophiuchi cloud) in order to hide the redshifted component. ISO-Oph 32 is a 40 M JUP BD which again was known to be a strong accretor (13). Our recent analysis revealed weak [OI]λ 6300, 6363 emission, similar in strength to what we detected for 2MASS1207-3932. The [OI]λ 6300 line is blue-shifted to a velocity of ∼ -30 kms -1 and offset to ∼ 60 mas at 0 • and ∼110 mas at 90 • . This constrains the PA of this outflow at ∼ 60 • (E of N). • 2MASS1207-3932: UVES spectra of the 24 M JUP BD 2MASS1207-3932 obtained in May 2006 revealed the presence of strong Hα emission and the [OI]λ λ 6300, 6363 emission lines. Only the [OI]λ 6300 was strong enough for spectro-astrometric analysis. The line profile was double peaked with blue and redshifted emission at ∼ -8 kms -1 and 4 kms -1 , resp
…(Full text truncated)…
This content is AI-processed based on ArXiv data.