Gene profiling for determining pluripotent genes in a time course microarray experiment
In microarray experiments, it is often of interest to identify genes which have a pre-specified gene expression profile with respect to time. Methods available in the literature are, however, typically not stringent enough in identifying such genes, …
Authors: ** - J. Tuke (University of Adelaide) - G. F. V. Glonek (University of Adelaide) - P. J. Solomon (University of Adelaide) **
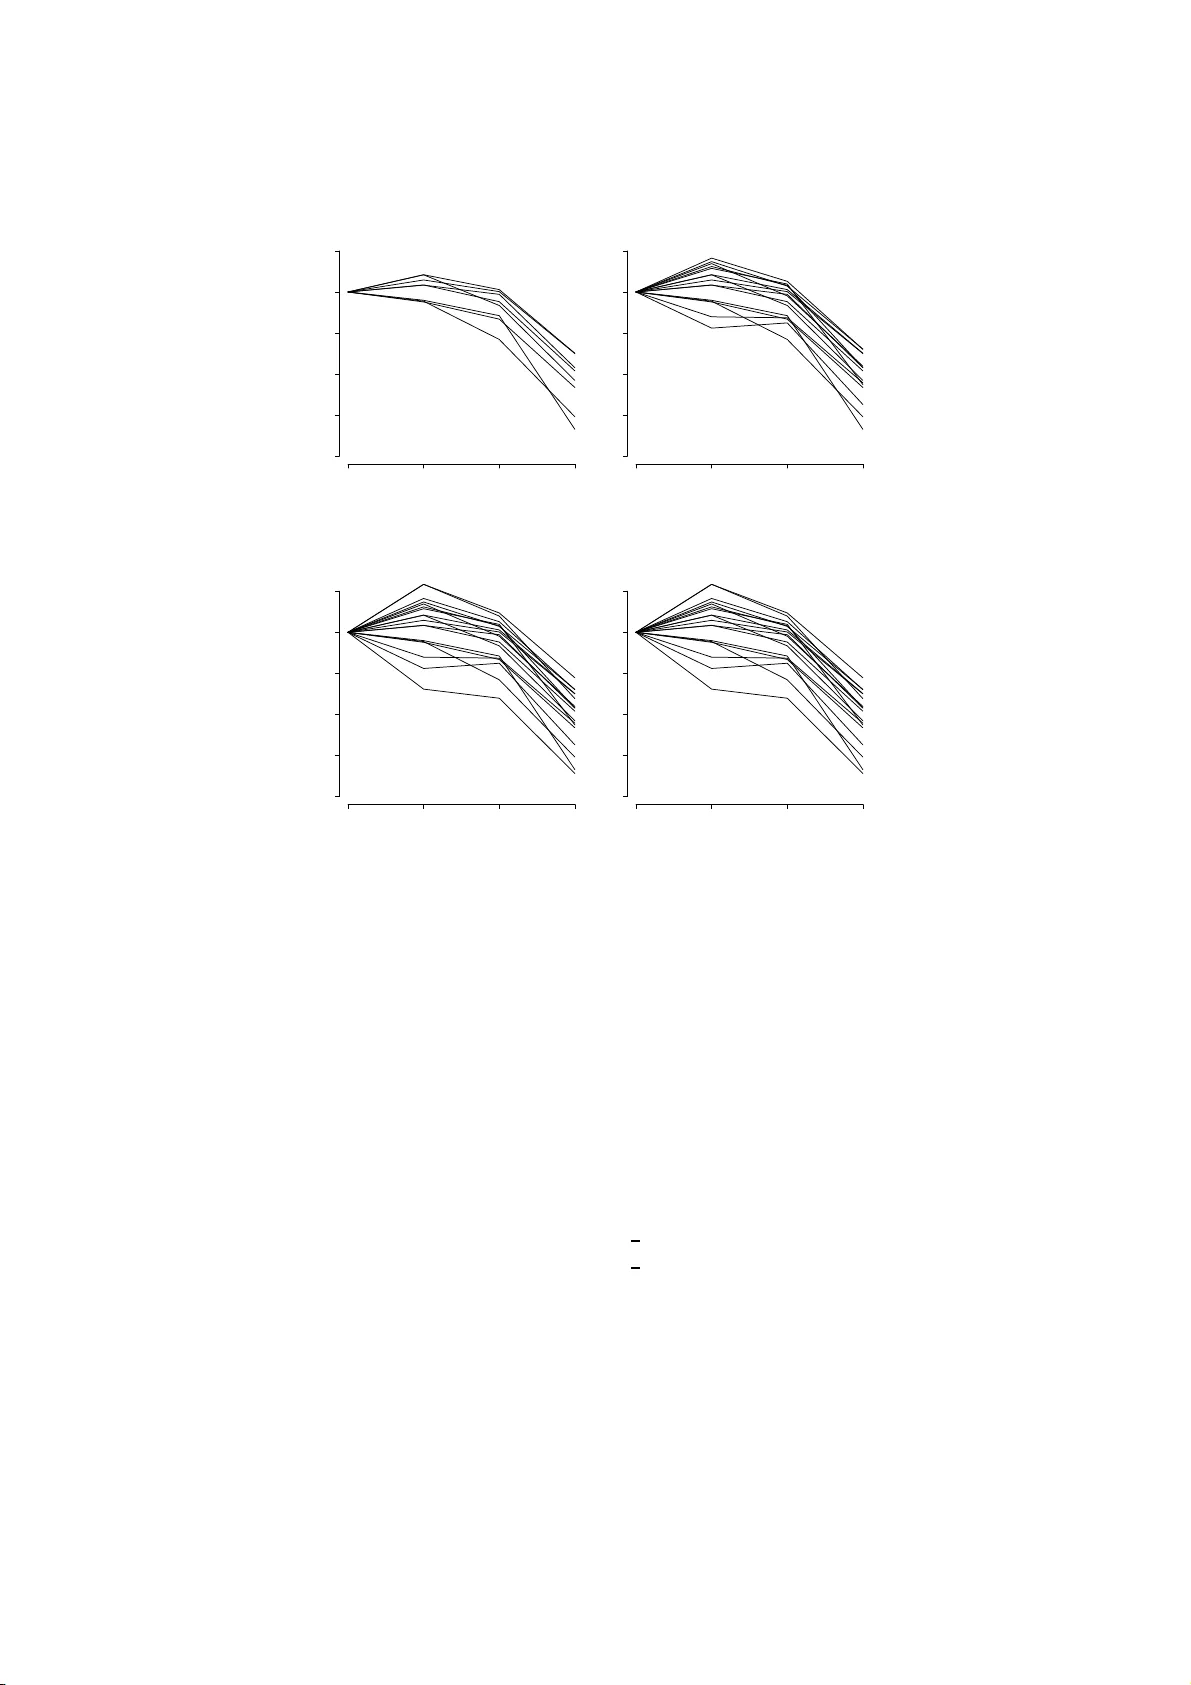
Gene profiling for determining plurip oten t genes in a time course microarra y exp erimen t J. TUKE ∗ Scho ol of Mathematic al Scie nc es The University of A delaide, A delaide SA 5005, Austr alia simon.tuk e@adelaide.edu.au G.F.V. G LONEK Scho ol of Mathematic al Scie nc es The University of A de laide, A delaide SA 5005 , Austr alia gary .glonek@adelaide.edu.au P .J. SOLOMON Scho ol of Mathematic al Scie nc es The University of A de laide, A delaide SA 5005 , Austr alia patt y .solomon@adelaide.edu.au 1 Abstract In microarray exp erimen ts, it is often of inte r est to identify genes wh ic h ha ve a pre- sp ecified gene e xp r ession profile wit h resp ect to time. Metho ds a v ailable in the litera- ture are, ho w eve r, t yp ically not stringen t enough in iden tifying such genes, particularly when the profile requires equiv alence of gene expression lev els at certain time p oin ts. In this pap er, the authors in tro du ce a new met h od ology , called gene profiling, that us es sim ultaneous differential and equiv alen t gene expression lev el testing to rank genes ac- cording to a p re-sp ecified gene expression p rofile. Gene pr ofiling treats th e ve ctor of true gene exp ression lev els as a linear co mbination of appropriate vec tors, i.e., v ectors that giv e th e requir ed criteria for the p rofile. This gene-profile mo del is fitted to the data and th e r esultan t p arameter estimates are summarized in a s ingle test s tatistic that is then used to rank the genes. The theoretical und erpinnings of gene profilin g (equiv alence testing, in tersection-union tests) are discussed in this pap er, and the gene profiling metho dology is applied to our m otiv ating stem cell exp erimen t. Keywor ds : Gene expression; Gene profiling; Linear m od el; Microarra y; Plurip otency; Stem cell; Time course exp erimen t. ∗ T o whom co rresp ondence should b e addressed 1 2 In tro duction Microarra y tec hn ology enables researc h ers to examine the expression leve ls for many thousands of genes simultaneo u sly (see, for example, Nguye n et al. , 2002; Smyt h et al. , 2003). Increasingly , inform ation on gene expression is used to inf er cell protein lev- els and th u s cellular b eh aviour (Nguyen et al. , 2002; S m yth e t al. , 2003; Ahnert et al. , 2006; McLac hlan e t al. , 2006). A further ma j or area of inte rest is in inv estigating c hanges in gene expression leve ls o v er time in a p opulation of cells (Dudoit e t al. , 2002; Bar-Joseph et al. , 2003; Glonek and Solomon, 2004; T ai and Sp eed, 2005; Ern st et al. , 2005; Bro wn et al. , 2006; Ahnert et al. , 2006) and this is the sub ject of the pr esen t pa- p er. W e refer to the gene expression levels o ver time as a gene expression profi le, or profile for short. Sev eral metho ds of analysing gene expr ession profiles fall in to the class of tec h- niques kn o wn as unsu p ervised learnin g metho ds. These metho ds seek to group genes in to a num b er of classes based u p on their observ ed profiles. S ome of the metho dologies discussed in the recen t microarra y literature are hierarc hical classification (Eisen et al. , 1998), self-organizing maps (T ama yo et al. , 1999), the K -means algo r ith m (T a v azo ie et al. , 1999), m ultiv ariate Gaussian mixtures (Ghosh and C hinnaiy an, 2002; Y eung et al. , 2001), and m ixtures of linear mixed mo dels (Celeux e t al. , 2005). A related problem that arises in applications of microarray time course exp eriment s is to sp ecify , in adv ance, a gene expression profile of interest and then to iden tify the genes with matc hing expr ession profiles. Ho w eve r , u nsup ervised metho ds do n ot address th is problem and v arious al- ternativ e approac hes ha ve b een prop osed. One such metho d is P areto optimizatio n, pr op osed b y Fleur y et al. (20 02 ) and Hero and Fleury (2004), in wh ich a set of fu nctions, eac h measuring the asso ciatio n of a gene to a pre-sp ecified p rofile, is chosen. Genes found to b e P areto-optimal with resp ect to these criteria are identi fi ed as matc h in g the pr e-sp ecified profile. The main disadv an tage w ith Pareto optimization is that some genes will b e selected as P areto- optimal genes whilst only matc hing the pre-sp ecified profile for a sub set of the pr ofile’s criteria. In an un published pap er, L¨ onnstedt et al. (2003) d escrib e a different metho d for ranking ge n es, based on t h e inn er p ro duct b etw een the vect or of observed log ratios and a pre-sp ecified p r ofile. T his metho d works w ell for some p rofiles, b ut d id not p ro vide useful outcomes in our ap p licatio n . Gene p rofiling is a new approac h dev elop ed by the p resen t authors, which aims to iden tify genes that m atc h a p re-sp ecified g ene expression profile, with grea ter sp ecificit y than th e p reviously describ ed app roac hes. Gene profiling en tails treating th e ve ctor of true gene expression lev els for ea ch gene as a linear com bination of linearly indep endent v ectors chosen to repr esen t the pre-sp ecified profile. The gene-profile mo d el is fitted to the observe d log ratios, and the genes are ranked b y a single test statistic which incorp orates simultaneous different ial and equiv alen t gene expr ession testing. In Section 3, our motiv ation for gene profiling is presente d . S ectio n 3.1 sets out the details of th e exp erimental design for a plu rip oten t (stem cell) time course exp erim ent whic h provided our initial motiv ation f or the ens uing method ologi cal d ev elopmen t. The theoretical u nderpinn ings of gene profiling are describ ed in Section 4, wh ic h en tails a 2 review of equiv alence testing (Section 4.2 ) and intersectio n -union tests (Section 4.3). The gene profiling metho dology is set out in S ection 4.4, and the r esults obtained fr om our application to a stem cell exp erimen t are p resen ted in S ection 5. In Section 6, some further work and ho w to app ly the metho ds in limma are briefly discus sed. 3 Motiv ation: plurip otency Our motiv ating example is a stem cell exp erimen t originally conducted b y the Rath- jen lab oratory , formerly of the Unive r s it y o f Adelaide. The aim of the exp erimen t was to iden tify genes asso ciated with plurip otency in mice e mbry onic stem cells (D’Amour and Gage, 2003; Ramalho-San tos et al. , 2002 ). Early stem cells h a v e the p oten tial to d ifferentiate in to an y b o dy cell: a prop erty known as p lurip otency . This ability is pr esen t in mice stem cells up to and includin g da y three. After this the stem cells b ecome multipotent: they still ha v e the abilit y to d ifferen tiate int o d ifferen t t yp es of cells, b ut now a limited n umb er. F or example, haemop o etic stem cell s can different iate in to blo o d cells but not nerve cells. As plurip otency is restricted to the early stem cells, day 3 or earlier, genes that h a v e high exp ression lev els in cells up to da y 3, but lo w, or m onotonica lly decreasing expression lev els thereafter, are like ly to b e asso ciated with the bio c hemical path wa ys in vo lved in the plurip otency ab ility of these cells (p ersonal communicatio n , Dr Chr is Wilkinson). 3.1 Plurip otency example: exp erimen tal design Stem cells were isolated fr om th e early embry o and gro wn in culture dishes. Th e cells w ere allo w ed to replicate and gro w o ve r the medium in the dish . Once the cells had cro wded the p late, they w ere remov ed, separated and p lated on to new plates. This cycle of growth and re- p lating is called a p assage . The Rathjen laboratory isolated mice em bryonic stem cells, and for this exp eriment, used cells fr om passages 21, 22, 23 and 24. Th e cells were stim u lated to differen tiate in to multip oten t cells, and on d a ys 0, 3, 6 and 9 after stim ulation, samples were tak en and the messenger RNA (mRNA) obtained. The ge n e expressions of the 16 samples of s tem cell mRNA for the four days ( 0, 3, 6, 9) and four passages, we r e measured. Within eac h p assage, five comparisons w ere made, namely , da y 0 to day 3, da y 0 to da y 9, d a y 3 to da y 6, da y 3 to day 9 , and day 6 to day 9. T he e xp erimen tal design in terms of th e true gene expression le vels, µ ( see Section 4) is summarized in Figure 1, wh ile the exp erimen tal design in terms of the gene p r ofiling parameters, γ (Section 4), is compared to the design in terms of the tru e expression lev els in T able 1. The clone library used in the exp erimen t w as the C ompugen 22,000 mouse oligon ucleotide library (ht tp://www.microarray .adelaide.edu.au/libraries/ ). In t otal, 20 arra ys were hybridized on t wo-co lour long-oligon ucleotide microarra ys, with five arra ys within eac h passage. The five arra ys consisted of th e five comparisons detailed ab o ve. In this a n alysis, the stem cells from eac h passage w ere treated as indep endent biological replicates. 3 µ 0 µ 9 µ 3 µ 6 Figure 1: Microarra y comparisons made within eac h passage for the p lurip otency stem cell exp eriment. Eac h arro w represents t w o arra ys, one for eac h passage (passage 21/22 con tin u ou s arro w, passage 23/24 dash ed arro w), w ith the arrow head p oin ting to the sample lab eled with cy5, and the sample at the arr o w tail lab eled with cy3. Da y 0, 3, 6, and 9 are repr esen ted by µ 0 , µ 3 , µ 6 , and µ 9 resp ectiv ely . Da y P arameterization P arameterization in terms of µ ’s in terms of γ ’s 0 µ 0 γ 0 + γ 1 + γ 2 + 1 2 γ 3 3 µ 3 γ 0 + γ 1 + γ 2 − 1 2 γ 3 6 µ 6 γ 0 + γ 2 9 µ 9 γ 0 T able 1: Paramete rization of stem cell exp eriment in terms of absolute mean gene ex- pressions ( µ i , i = 0 , 3 , 6 , 9) and in terms of the gene profile co efficien ts ( γ i , i = 0 , 1 , 2 , 3). 4 4 Gene profiling metho dology 4.1 Dev elopmen t of metho d for stem cell exp erimen t The expression criteria ov er time r equired for a plurip oten t gene are: • equal gene expression lev els for days 0 and 3, • higher gene expression lev els for days 0 and 3 compared to da y 9, and • the gene expression lev el for day 6 to lie b et ween the gene expression lev els for da y 0 and d a y 3, and the gene expr ession lev el for day 9. The requisite (h yp othetical ) p r ofile is illustrated in Figure 2. Consider the v ector of true mean gene expression lev els, µ = ( µ 0 , µ 3 , µ 6 , µ 9 ) ′ , w here µ i , i = 0 , 3 , 6 , 9 is the mean gene expression lev el on day i as sh o wn in Figure 1. Since this is a v ector in R 4 , it can b e expr essed as the linear com bination of four linearly indep endent v ectors. The first step in gene profi lin g is to choose v ectors that represent the criteria for plurip otency . In the present example, this corresp onds to µ = γ 0 1 1 1 1 + γ 1 1 1 0 0 + γ 2 1 1 1 0 + γ 3 1 / 2 -1 / 2 0 0 . (4.1) With this c h oice of mo del, it follo ws that γ 0 = µ 9 , γ 1 = ( µ 0 + µ 3 ) / 2 − µ 6 , γ 2 = µ 6 − µ 9 , and γ 3 = µ 0 − µ 3 . Therefore, the plu rip oten t profile requires that γ 1 > 0 , γ 2 > 0 , γ 3 = 0 , but d o es not constrain γ 0 . T o find genes that ac hiev e these criteria r equ ires tests for equiv alence as w ell as (sim u ltaneous) tests f or differen tial gene expression. In the next section, equ iv alence testing is discussed. W e then describ e ho w to simulta n eously test for b oth differen tial and equiv alen t gene expression in a time course exp erimen t. 4.2 Statistical E quiv alence T o determine plurip otency , it is necessa r y to demons tr ate that γ 3 = 0. Conv entional hy- p othesis testing is not applicable to th is situation, but the equiv alence testing approac h discussed in W ellek (2002) is. If X is a rand om vec tor wh ose p r obabilit y distribu tion dep ends on a real-v alued parameter θ , then to test if θ is equiv alen t to zero, a n eigh b ourho o d aroun d zero is constructed and the follo wing null and alternativ e hyp otheses are tested: H 0 : | θ | ≥ ǫ, ǫ > 0 , (4.2) H a : | θ | < ǫ. The n eigh b ourho o d defined b y ǫ is the maxim um that the parameter can v ary and still b e considered equiv alen t to zero. Th is neigh b ourho o d is n ecessary to ensu re that the p o wer of the statistical test is greater than its signifi cance lev el (W ellek , 2002). 5 0 3 6 9 −4 −3 −2 −1 0 1 ● ● ● ● µ 0 µ 3 µ 6 µ 9 Da y Log ratio Figure 2: The pre-sp ecified gene expression p r ofile for plur ip oten t genes. F or eac h day , the log ratio with resp ect to d ay 0 is plotted. F or the gene profiling mo del, the parameter ǫ is tak en to b e the largest that a gene’s mean log ratio can v ary around zero and n ot b e of “significan t” gene expression, ac- cording to b iologi sts. In practice, a w orkin g u nderstanding of equiv alen t gene expr ession should b e decided up on in adv ance in consultation with biologists. Un fortunately h o w- ev er, relativ ely little is kno wn ab out gene-sp ecific v ariation p er se: information that could of course b e u sed to d ecide on an appropr iate v alue of ǫ . W e discu ss p oten tially suitable choice s of ǫ in Section 5, bu t for th e pr esen t w e w ill assume an appropr iate ǫ to b e a v ailable. Using suc h a v alue of ǫ , the simp lest and most common wa y to test the h yp otheses in (4.2) is via Confidenc e Interval Inclusion (CI I). Consider the n ull and alternativ e hyp otheses sp ecified in (4.2). W e calculate a confidence inte rv al, R α ( X ), from the obs er ved data X , where R α ( X ) = ( L α ( X ) , U α ( X )) ; (4.3) L α ( X ) and U α ( X ) are ran d om v ariables, suc h that P ( θ ∈ ( L α ( X ) , ∞ )) = P ( θ ∈ (- ∞ , U α ( X ))) = 1 − α. W e reject th e n ull hypothesis in fa vo u r of equiv alence if and only if R α ( X ) ⊂ (- ǫ, ǫ ) , 6 i.e., the confidence interv al is conta ined en tirely within the in terv al (- ǫ, ǫ ). T h is is an α -lev el test. The equiv alence form u lation can b e used to test that γ 3 in equation (4.1) is equiv alen t to zero w ith the follo win g null and alternativ e hyp otheses: H 0 : | γ 3 | ≥ ǫ vs. H a : | γ 3 | < ǫ. (4.4) F or example, to test the h yp otheses in (4.4), the confidence in terv al ( ˆ γ 3 − t ∗ SE( ˆ γ 3 ) , ˆ γ 3 + t ∗ SE( ˆ γ 3 )) , is calculated and γ 3 is concluded to b e equiv alen t to zero if this confi dence in terv al lies within (- ǫ, ǫ ). In this confidence interv al, t ∗ is c h osen suc h that P ( T > t ∗ ) = α , where T h as a t -distrib ution with the app ropriate degrees of freedom for γ 3 . Confidence inte rv al inclusion can also b e used to (separately) test whether γ 1 and γ 2 are significan tly p ositive . The null and alternativ e comp osite hyp otheses for γ 1 are H 0 : γ 1 ≤ 0 vs. H a : γ 1 > 0 , and for γ 2 are H 0 : γ 2 ≤ 0 vs. H a : γ 2 > 0 . F or an α -lev el test h ere, a one-sided (1 − α )100% confid ence in terv al for γ 1 is calcu- lated: ( ˆ γ 1 − t ∗ SE( ˆ γ 1 ) , ∞ ) , and if this in terv al is conta ined in (0 , ∞ ), γ 1 is concluded to b e significantly p ositiv e. Similarly f or γ 2 . These m ethod s allo w testing of eac h criterion separately , but for plurip otency all three criteria need to b e v alid sim ultaneously . The authors’ metho d to simulta n eously test for b oth equiv alence of p arameters to zero and significan t departures of parameters from zero is describ ed in the next section. 4.3 In tersection-Union test The test for eac h criterion discussed in Section 4.2 can b e incorp orated sim ultaneously in to a single null and a single alternativ e hyp othesis as follo ws: H 0 : ( γ 1 ≤ 0) S ( γ 2 ≤ 0) S ( | γ 3 | ≥ ǫ ) , ǫ > 0 , (4.5) v ersus H a : ( γ 1 > 0) T ( γ 2 > 0) T ( | γ 3 | < ǫ ) . (4.6) The hyp otheses in (4 .5 ) and (4.6) represent an int erse ction-union test (IUT)(Berger, 1982). T o review, in an IUT, th e null hyp othesis is expressed as a u n ion, H 0 : θ ∈ [ γ ∈ Γ Θ γ , 7 where Θ γ is a subset of th e parameter s pace in dexed b y γ . T he r ejectio n region R of this I UT is of the form R = T γ ∈ Γ R γ , where R γ is the r ejection region for a test of H 0 γ : θ ∈ Θ γ v ersus H 1 γ : θ ∈ Θ c γ . T his is an α -lev el test, where α = sup γ ∈ Γ α γ and α γ is the size of th e test H 0 γ , with rejection region R γ . Th u s for eac h γ i , i = 1 , 2 , 3, in the null hyp othesis statement (4.5), a test of size α i is found, and the ov erall IUT will b e of lev el sup α i . Usin g the confiden ce interv al inclusion metho d d iscussed in the pr evious section to test eac h γ i separately , eac h test b eing of leve l α , giv es an o verall α -leve l test. Our m ain aim is to rank the genes in our motiv ating example according to th eir matc h w ith the plu rip oten t profile. The testing metho dology describ ed can b e mo dified to give a quan titativ e measur e of h o w closely eac h gene matc hes th e desired profile. Considering eac h gene separately , for eac h parameter, γ i , i = 1 , 2 , 3, confid ence in terv al inclusion is used to test th e associated n ull hyp othesis. Ra ther than using a fixed significance leve l, the smallest significance lev el, α i , for eac h γ i , i = 1 , 2 , 3 resp ectiv ely , is f ound, suc h that the null h yp othesis is rejected. The supremum of α i , i = 1 , 2 , 3 is used as the test statistic to r ank the genes. In fact, in the stem cell exp erimen t, rather than calculate α i for eac h γ i , i = 1 , 2 , 3, the w idth of the largest confidence in terv al, U i , for eac h γ i that w as cont ained within the rejection region was used. The infimum, U, of the U i w as then u sed to rank the genes (it should b e noted that this is equiv alen t to ranking based on sup α i ). T o f u rther elucidate the metho d , consider Figure 3. Th is illustrates a t wo-dimensional example wh er e the criteria are γ 1 = 0 and γ 2 > 0. Th e rejection region is indicated b y the rectangular sh aded r egion. The p oint ( ˆ γ 1 , ˆ γ 2 ) is the estimate of ( γ 1 , γ 2 ). The distance to the nearest b oundary of the rejection region is calculated in standard err ors of the estimate and this d istance is used to rank the genes, with larger v alues indicativ e of asso ciation with plur ip otency . Genes w hose pr ofiles do not lie within the rejection region are excluded from the ranking. The ab o ve develo pm en t leads to the general metho dology for determining plurip o- tency describ ed in the next section. Rejection region γ 2 γ 1 ( ˆ γ 1 , ˆ γ 2 ) ǫ - ǫ Figure 3: Illus tration: for eac h gene, the distance from ( ˆ γ 1 , ˆ γ 2 ) to the nearest b ound ary of the r ejection region is used to rank the genes. 8 4.4 Gene profiling for plurip otency The scanned images for eac h hybridized microarra y slid e w ere analysed us in g SPOT (Y ang et al. , 2001) to giv e the cy3 and cy5 in tensities for eac h gene (Y ang et al. , 2001; Adams and Bisc hof, 1994). The d ata were then normalized by w ithin-arra y pr in t-tip lo ess, and the gene profile mo del w as fitted to the normalized data using limma (Smyth, 2005) in R (R Dev elopment Core T eam , 2006). F or eac h gene, the mo d el parameter estimates and standard errors obtained b y lim ma were used to calculate the U statistic (see b elo w) u sing C co de em b edded in R co de. The genes were then ranked usin g the U statistic. The vec tor of observed log ratios M w as expressed as a lin ear mo del of the true gene expression lev els µ as follo ws : M = X ∗ µ + E , where X ∗ is the design m atrix repr esen ting the mRNA comparisons made on eac h arra y , and E is assumed to b e distributed as N 20 ( 0 , σ 2 I ). Usin g equation (4.1) to sub stitute for µ , giv es M = X ∗ 1 1 1 1 / 2 1 1 1 - 1 / 2 1 0 1 0 1 0 0 0 γ 0 γ 1 γ 2 γ 3 + E = X γ + E . In the stem cell exp erimen t, the microarra y platform u sed w as t wo-c olour long oligon u- cleotide which, as for cDNA microarrays, measur es relativ e gene expr ession, b ut n ot absolute gene exp ression levels. Ther efore, the o v erall gene expression lev el, γ 0 , could not b e estimated and was r emo v ed from the mo del by c h an ging the parameter vect or to ( γ 1 , γ 2 , γ 3 ) and r emoving the fi rst column of X . Estimates of γ were calculated via least squares, and the estimate of σ 2 w as ob- tained using the empirical Ba yes metho d utilized in lim ma ; this giv es a robu st p osterior estimate of σ 2 based on a p rior whic h “b orro ws” in f ormation from t h e observ ed v ariance of all the genes on the array . F or eac h gene, thr ee tests statistics, U 1 , U 2 and U 3 w ere calculated as follo ws: U 1 = ˆ γ 1 SE( ˆ γ 1 ) , U 2 = ˆ γ 2 SE( ˆ γ 2 ) , U 3 = ǫ − | ˆ γ 3 | SE( ˆ γ 3 ) , where SE( ˆ γ i ) is t h e i th diagonal elemen t of the square matrix: s p ( X ′ X ) - 1 , and s is the p osterior estimate of σ . Th e min im um of U i , i = 1 , 2 , 3, is u sed to rank the genes, for whic h genes with larger v alues of U are more lik ely to b e asso ciated with plurip otency . Genes whose estimate ( ˆ γ 1 , ˆ γ 2 , ˆ γ 3 ) of ( γ 1 , γ 2 , γ 3 ) did not lie w ithin the rejection region, i.e. those genes for wh ic h at least one U i , i = 1 , 2 , 3 was negativ e, w ere excluded fr om the ranking. 9 5 Application: determining genes asso ciated with p lurip o- tency using gene p rofiling The mo del (4.1) was fi tted to th e stem cell data with ǫ = 1. In add ition, the test statistics w ere c hanged to test for γ 2 > 1 . 5, i.e., U 2 = ˆ γ 2 − 1 . 5 SE ( ˆ γ 2 ) . Th e v alue of 1 . 5 wa s c hosen to en sure a large difference b et ween the gene expression lev els on d a ys 0, 3 and 6 compared w ith the gene expression leve l on da y 9. The rank ed genes are given in T able 2, and the fitted pr ofiles for these 15 genes are sho wn in Figure 4. Figure 4 shows the fitted log r atios with resp ect to day 0 for th e four time p oints: da y 0, da y 3, d a y 6, and da y 9. Therefore, all of th e profiles will pass through zero on day 0. The p rofiles d emonstrate the requir ed tra jectory: equal expression for day 0 and da y 3, h igher gene expression lev els for days 0 and 3 compared to d ay 9, and the gene expression lev el for day 6 lying b et we en the gene expression lev els for days 0 and 3 and that for day 9. Gene Names ˆ γ 1 ˆ γ 2 ˆ γ 3 U Oct4 0.48 2.77 0.20 2 .53 Utf1 0.54 1.82 − 0.42 2.46 Tdgf1 1.04 1.88 0.22 1.80 Slc35f2 0.32 1.69 − 0.17 1.53 T r h 0.44 1.71 − 0.69 1.50 F o xd 3 0.14 1.79 − 0.17 1.33 Musd1 0.15 2.00 − 0.62 1.17 Skil 0.1 5 1.66 − 0.83 1.16 P ou6f1 0.54 1.66 0.24 1.13 P ar2 0.33 1.58 0.60 0.75 Nanog 0.31 1.99 0.88 0.69 Slc7a3 0.09 2.45 − 0.58 0.67 Gng3 0.15 1.55 − 0.42 0.33 Skil 0.2 3 1.54 − 0.74 0.28 Rae-28 0. 14 1.51 − 0.29 0.08 T able 2: The ranked genes from fi tting plur ip oten t profile (4.1 ) to the stem cell data. The top-rank ed gene, Oct4, is we ll-known to b e asso ciated with plur ip otency (Ro dda et al. , 2005; Loh et al. , 2006) and would therefore b e exp ected to app ear amongst the top- rank ed genes for plurip otency in this exp erimen t. Other genes of note in the rank ed genes in T able 2 are Utf1 (rank 2) whic h is asso ciated with un differen tiated em bry- onic cell transcription (Nishimoto et al. , 2005), and Nanog (rank 11) whic h is cen tral to em bryonic stem cell plurip otency (W ang e t al. , 2006). The r ecen t article by W ang et al. (2006) isolated proteins asso ciated with the protein Nanog and thus w ith plurip otency . O f th e 38 p r oteins discus sed in W ang et al. (2006), Oct4 and Nanog app eared in our list of r ank ed genes using mo del (4.1): ranks 1 and 11 resp ectiv ely . The remaining pr oteins w ere n ot in the r ank ed genes as the profiles of the 10 asso ciated mRNAs are not consistent with p r ofile (4.1). 0 3 6 9 −4 −3 −2 −1 0 1 ● ● ● ● ● ● ● ● ● ● ● ● ● ● ● ● ● ● ● ● ● ● ● ● ● ● ● ● ● ● ● ● ● ● ● ● ● ● ● ● ● ● ● ● ● ● ● ● ● ● ● ● ● ● ● ● ● ● ● ● Log ratio Da y T rh Musd1 F o xd3 Oct4 Utf1 T dgf1 P ou6f1 P a r2 Na nog Sl c35f2 Sk il (2x) G ng3 R a e-28 Sl c7a3 Figure 4: Fitted log ratios with resp ect to day 0 for th e ranke d genes for the plu r ip otency profile (4.1). Sensitivity analysis : As s tr essed previously , the c hoice of the neigh b ourho o d around zero assumed f or equiv alence (i.e., ǫ ) should b e d ecided up on in consultation w ith bi- ologists. Ho w eve r , this is problematic since biologists still hav e r elativ ely little explicit kno wledge of gene-wise expr ession v ariabilit y , and therefore, what pr ecisely and qu an- titativ ely ma y represent equ iv alence of gene expression. T o in vestig ate the p oten tial effects of altering th e neigh b ou r ho o d defined by ǫ , the primary analysis w as r ep eated assuming, resp ectiv ely , v alues of ǫ = 0 . 5 , 1 , 1 . 5 , and 2 . In Figure 5 the profiles for the genes wh ic h hav e observ ed pr ofi les that lie within the rejection region are p lotted for ea ch c hoice of equiv alence neigh b ourho o d. As the equiv- alence neighbour h o o d wid th ( ǫ ) in cr eases, m ore genes h a v e profiles that lie within the rejection r egion, bu t there is greater v ariation b et ween the gene expression leve ls for da y 0 and da y 3. Nev ertheless, gene profiling in this application has b een demonstrated to b e reasonably robust. F or ǫ =0.5, 1 and 1.5, O ct4 was rank ed as th e top gene, while for ǫ =2, it had only dropp ed to rank 2. Pr ofiling for Sox2 : I t is well kno wn that the gene S o x2 is commonly asso ciated with plurip otency (Ro dda et al. , 2005), b ut it was not in the ranked genes usin g the gene expression profile (4.1): the fi tted gene expression profile for So x2 is v ery differen t from 11 0 3 6 9 −4 −3 −2 −1 0 1 ● ● ● ● ● ● ● ● ● ● ● ● ● ● ● ● ● ● ● ● ● ● ● ● ● ● ● ● ● ● ● ● Lo g rati o Day ( a ) 0 3 6 9 −4 −3 −2 −1 0 1 ● ● ● ● ● ● ● ● ● ● ● ● ● ● ● ● ● ● ● ● ● ● ● ● ● ● ● ● ● ● ● ● ● ● ● ● ● ● ● ● ● ● ● ● ● ● ● ● ● ● ● ● ● ● ● ● ● ● ● ● Day Lo g rati o ( b) 0 3 6 9 −4 −3 −2 −1 0 1 ● ● ● ● ● ● ● ● ● ● ● ● ● ● ● ● ● ● ● ● ● ● ● ● ● ● ● ● ● ● ● ● ● ● ● ● ● ● ● ● ● ● ● ● ● ● ● ● ● ● ● ● ● ● ● ● ● ● ● ● ● ● ● ● ● ● ● ● ● ● ● ● Lo g rati o Day ( c) 0 3 6 9 −4 −3 −2 −1 0 1 ● ● ● ● ● ● ● ● ● ● ● ● ● ● ● ● ● ● ● ● ● ● ● ● ● ● ● ● ● ● ● ● ● ● ● ● ● ● ● ● ● ● ● ● ● ● ● ● ● ● ● ● ● ● ● ● ● ● ● ● ● ● ● ● ● ● ● ● ● ● ● ● Lo g rati o Day ( d) Figure 5: Fitted log ratios with resp ect to day 0 for the ranked genes with (a) ǫ = 0.5, (b) ǫ = 1, (c) ǫ = 1.5, and (d ) ǫ = 2. the plu rip oten t pr ofi le used in the analysis. The criteria for the pr ofile of So x2 are: higher gene expression lev el on d a y 0 compared to the gene expr ession leve ls for da ys 6 and 9; equiv alen t gene expression level s on days 6 and 9; and th e gene expr ession lev el for da y 3 to lie b et ween the gene expression lev el for da y 0 and the lev els for da ys 6 and 9. Gene profi lin g can b e used to r an k the genes according to these alternativ e criteria. An appr op r iate mo d el for Sox2 is: µ = 1 1 1 0 1 0 1 0 1 0 0 1 2 1 0 0 - 1 2 γ , in which γ 0 is unrestrained, γ 1 > 0, γ 2 > 0, and γ 3 is equiv alen t to zero. This mo del w as fitted to the data and the ranked genes are shown in Figure 6. Th e r ank ed genes w ere Cpt1a, 12 00014E20Rik, 22104 09E12Rik, Sox-2 , Np-1, Birc5, 57304 19I09Rik, MGI:1922 156, r etSDR3, and clone RP21-50 5L19 on c hromosome 5. So x2 was rank ed at 12 p osition 4. Of note is retSDR3. Th is g ene has the required fo r m w ith a larger difference in gene expression b etw een day 0 and d a ys 6 and 9 compared to the other genes. Ev en with th is large difference, retSDR3 is lo w do wn in the ran k in g at rank 9. This low ranking is b ecause retSDR3 has a large gene expression v ariance (0.181) compared to the other ranked g enes (a ve rage gene expression v ariance of 0 .054). This illustrates that if t wo genes h a v e th e s ame co efficien t v alues, gene profiling will rank lo we r the gene whic h has the larger v ariance and thus more un certain t y ab out its true pr ofile. B i r c5 1 200014E20Rik So x2 22 10409E12Rik C pt1a 5 730419I09Rik M GI:1922156 N p-1 clone RP21-505L19 on c hromosome 5 r etSDR3 0 3 6 9 −4 −3 −2 −1 0 ● ● ● ● ● ● ● ● ● ● ● ● ● ● ● ● ● ● ● ● ● ● ● ● ● ● ● ● ● ● ● ● ● ● ● ● ● ● ● ● D a y Lo g rati o Figure 6: Fitted log r atios with resp ect to day 0 for the top 10 r ank ed genes f or the So x2 profile. 6 Discussion of further w ork In general, gene pr ofiles of interest to molecular biologists often consist of t wo t yp es of criteria: equal gene expression at different time p oints and differentia l gene expression at differen t time p oint s. Gene profiling pro vides a straigh tforw ard metho dology to filter genes whic h satisfy these t wo t yp es of criteria simulta n eously . W e b eliev e that this has not b een accomplished using previously a v ailable tec h n iques. By sim ultaneously testing for all criteria, gene p rofiling effectiv ely filters out and excludes genes that are only partially consisten t with the required pr ofile. W e no w touch on some areas requiring further work. 13 Choic e of ǫ : As noted in Section 4.3 , to test for a p arameter b eing equal to zero, a n eigh b ourh o o d of wid th ǫ is defined. T his neigh b ourho o d is the amount that the parameter could v ary and still b e considered equiv alen t to zero. In this p ap er, the c hoice of ǫ w as based on plotting pr ofiles for the v arious c hoices of ǫ , and c ho osing the b est ǫ to give the r equired p r e-sp ecified profiles. Ideally , the choic e of ǫ should b e based on consultation with biologists, to the extent that su c h kno wledge is a v ailable. One would anti cipate that suc h r equisite kno wledge will gradu ally accrue o ve r time, as microarra y and other n ew genomics tec hnologies are more widely app lied in molecular biology and genetics. Invarianc e of p ar ameterization : Another area requiring fur ther r esearc h is the in- v ariance (or otherwise) of r eparameterizat ion. In his (2002) b o ok, W ellek n otes: “... in con trast to the corresp ond in g conv en tional testing problems with the c ommon b oundary of n ull and alternativ e hypothesis [ sic ] b eing g iven by zero, equiv alence problems r emain generally not in v arian t un der redefinitions of the m ain parameter.” T o illustrate this p oint, consider the problem of finding marker genes for d a y 3 in the stem cell exp eriment. The cr iteria for such genes are: high gene exp r ession lev el on da y 3, as we ll as equal and low gene expression lev els on day 0, da y 6 and d ay 9. The requisite pr ofile is illustrated in Figure 7. Examination of the profile r evea ls th ree p ossible mo dels: µ = 1 0 0 0 1 1 - 1 3 - 1 3 1 0 0 -1 1 0 -1 0 γ , µ = 1 0 0 0 1 1 - 2 3 1 3 1 0 -1 1 1 0 -1 0 γ , µ = 1 0 0 0 1 1 - 2 3 - 1 3 1 0 -1 0 1 0 -1 -1 γ , where γ = ( γ 0 , γ 1 , γ 2 , γ 3 ) ′ with γ 0 unrestrained, γ 1 significan tly p ositiv e, γ 2 equiv alen t to zero, and γ 3 equiv alen t to zero. The three m o d els ma y not necessarily giv e the same results. This is b ecause equiv- alence is not transitive , i.e., if µ 0 is equiv alen t to µ 6 , and µ 6 is equiv alen t to µ 9 , it is not necessarily tru e that µ 0 is equiv alen t to µ 9 . This is b ecause equiv alence is defined in a neigh b ourho o d and so a “drift” resulting in µ 0 and µ 9 b eing to o far apart to b e considered equiv alen t can o ccur. Metho ds to imp ose inv ariance are currentl y under in- v estigation b y the authors. Although this is a n i nteresting area of resea r ch, in v ariance of reparameterization does not limit the use of gene profiling. There are many p re-existing statistica l tests, e.g., the W ald test, that are not in v arian t under reparameterizatio n. In man y cases, the r esearch hyp otheses will dictate the optimal mo d el to us e. Applying gene pr ofiling using limma : Gene profi lin g is easily implemen ted by fitting the mo del to th e d ata using limm a and th en ca lculating the U statistics. Th e calculation of the U statistics w as written in C to decrease the run time, but is easy to implemen t in R . T o conclude, gene pr ofiling introdu ces a flexible metho d to select genes for a pre- sp ecified time-c our se profile. Gene profiling is straigh tforward to implemen t in pract ice, requiring only small mo difications to the R pac k age limma , and can b e used to select for 14 most p rofiles of in terest to biologists. The application of gene pr ofiling in this article has b een to t wo-c olour microarrays, bu t it could r eadily b e mo d ifi ed for use for other microarra ys platforms, su c h as Affymetrix GeneChip (Lo ckhart et al. , 1996), and f or other tec hnologies where it is requ ired to rank obs erv ations by corresp ondence with a pre-sp ecified profile. 0 3 6 9 −1 0 1 2 3 ● ● ● ● Lo g rati o D a y µ 0 µ 3 µ 6 µ 9 Figure 7: Hyp othetical gene expression p rofile for a da y 3 mark er gene. 7 Ac kno wledgemen ts W e thank the Rathjen group f or the use of the stem cell data, and Dr Chris Wilkinson and Professor T erry Sp eed for useful information ab out stem cell exp er im ents. The second- and third-n amed authors are grateful to the Aus tralian Research Council for researc h supp ort thr ough a Disco v ery Pro ject Grant. Th e first-named author w as sup- p orted by a George F raser PhD sc h olarship at the Unive rs ity of Ad elaide. References Adams, R. a nd Bischof, L. (1994). S eeded r egion gro win g. IEEE T r ansactions on Pattern Analysis and Machine Intel ligenc e 16 , 641–647. 15 Ahner t, S. E., Willbrand, K., Brown, F . C. S. and Fink, T. M . A. (2006). Un biased p attern detection in microarra y d ata series. Bioinformatics 22 , 1471 –1476. Bar-Josep h, Z., Gerber , G. K., Gifford, D. K., Jaakkola, T. S. and S imon, I. (2003). Con tinuous representa tions of time-series gene exp ression data. J Comput Biol 10 , 341–56. Berger, R. L. (1982). Multiparameter hypothesis testing and acceptance samp ling. T e chnometr ics 24 , 295–300 . Bro wn, A . L., Wilkinson, C. R., W a terman , S. R ., Kok, C. H ., Sa lerno, D. G., Diakiw, S. M., Reyn olds, B., Scott, H. S., Tsykin, A., Glonek, G. F., Goodall, G. J., Sol omon, P. J., Gon d a, T. J. and D’Andrea, R. J. (2006 ). Genetic regulators of my elop oiesis and leukemic signaling id en tified by gene profiling and linear mo deling. Journal of L euko cyte Biolo gy 80 , 1–15. Celeux, G., Mar tin, O. and La ve r gne, C. (2005). Mixture of linear mixed mod els for clustering gene expression profiles from rep eated microarra y exp eriment s. Statis- tic al M o del ling 5 , 243–2 67. D’Amour, K . A. a nd Ga ge, F. H. (2003). Genetic an d f u nctional differences b et ween m ultip otent neural and plurip otent em b ry onic stem cells. PNA S 100 , 11866–118 72. Dudoit, S., Y ang, Y. H., Callo w, M. J . a nd Sp eed, T. P. (2002) . S tatistica l metho ds f or identifying differen tially expr essed genes in replicated cDNA microarray exp erimen ts. Statistic a Sinic a 12 , 111–139. Eisen, M. B., Spel lman, P. T., Brown, P. O. a nd Bot stein, D. (1998 ). Cluster analysis and displa y of genome-wide exp ression patterns. PNAS 95 , 14863–148 68. Ernst, J ., Nau, G. J. and Bar -Joseph, Z. (200 5). Clu stering sh ort time series gene expression data. Bioinformatics 21 , 159–168. Fleur y, G., Her o, A., Yoshid a, S., Car ter, T., Barlow, C. a nd Sw aroop, A. (2002). P areto analysis for gene fi ltering in microarray exp eriments. Pr o c. XI Eur op e an Sig nal Pr o c essing Confer enc e . Ghosh, D. and Chinnaiy an, A. M. (2002). Mixture mo delling of gene expression data from microarra y exp erimen ts. Bioinformatics 18 , 275–286. Glonek, G. F. and Solo mon, P. J. (2004). F actorial and time course designs for cDNA microarra y exp erim ents. Biostatistics 5 , 89–111. Hero, A. O . a nd Fl eur y, G. (2004) . Pareto- optimal metho ds f or gene r anking. The Journal of VLSI Signal Pr o c essing 38 , 259–275 . Lockhar t, D. J ., Dong, H., Byrne , M. C., Follettie, M. T., Gallo, M. V., Chee, M. S., Mittmann, M ., W ang, C., Koba y as hi, M., Hor ton, H. and Bro wn, E. L. (199 6). Expr ession monitoring b y hybridizatio n to high-density oligon ucleotide arra ys. Nat Biote chnol 14 , 1675–80. 16 Loh, Y.-H., Wu, Q., Che w, J.-L., Vega, V. B., Zhan g, W., C hen , X., Bo urque, G., Geo r ge, J., Leo ng, B., Liu, J., Wong, K.-Y., Sung, K. W., Lee, C. W. H., Zhao, X.-D., Chiu, K.-P., Lipovich, L., Kuz netsov, V. A., Robson, P., St anton, L. W., W ei, C.-L., Ruan, Y ., Lim, B. a nd N g, H.-H. (2006 ). The Oct4 and Nanog transcription net work regulates plur ip otency in mouse embry onic stem cells. Nat Genet 38 , 431–4 0. L ¨ onnsted t, I., Grant, S., Be gley, G. and Speed, T. (2003) . Microarra y analysis of tw o in teracting treatmen ts: a linear mo del and trends in expression o v er time. In Ingrid L¨ onnstedt’s Ph.D. thesis. McLachlan, G. J., Bean, R. W. an d Jones, L. B. T. (2006). A simple imple- men tation of a normal m ixtu re approac h to different ial gene expression in m ulticlass microarra ys. Bioinformatics 22 , 1608–1615 . Nguyen, D. V., Arp a t, A. B., W ang, N. Y. and Carroll, R. J. (2002) . DNA microarra y exp eriments: Biological and tec hnological asp ects. Biometrics 58 , 701– 717. Nishimoto, M., Miy a gi, S., Y amagishi, T., Sakaguchi, T., Niw a, H., Mura - ma ts u, M. and Okuda, A. (2005). Oct-3/4 mainta in s the pr oliferativ e embry onic stem cell state via sp ecific binding to a v arian t o ctamer sequen ce in the regulatory region of the UTF1 lo cus. Mole cular and Cel lular Biolo gy 25 , 5084–509 4. R Developme nt Core Team (2 006). R: A L anguage and Envir onment for Statistic al Computing . R F ou n dation for Statistica l Computing, Vienn a, Austria. Ramalho-S antos, M., Yoon, S., Ma tsuzak i, Y., Mulligan, R. C. and Mel ton, D. A. (2002 ). “Stemness”: T ranscriptional profiling of embry onic and adult stem cells. Scienc e 298 , 597–60 0. R odda, D. J., Chew, J.-L., Lim, L.-H., Loh, Y.-H., W ang, B., Ng, H.-H. and R obs on, P. (2005). T ranscrip tional regulation of Nanog by Oct4 and So x2. J Biol Chem 280 , 24731–7. Smyth, G., Y ang, Y. and Speed, T. (2003). Statistical issues in cDNA microarray data analysis. Metho ds Mol Biol 224 , 111–36. Smyth, G. K. (2005). Limma: linear m o d els for microarra y d ata pp. 397–42 0. T ai, C. Y. and Spee d, T. P. (2005). A m ultiv ariate empirical Ba y es statistic for replicated microarra y time course data. T ec hnical Rep ort 667. T ama yo, P., Sl onim, D., Mesiro v, J., Zhu, Q., Kit areew an, S., Dmitrovsky, E., Lander, E. S. an d Golub, T. R. (1999). Interpreting patterns of ge n e expres- sion with self-organizing maps : Method s and application to hematop oietic differenti- ation. PN AS 96 , 2907–29 12. 17 T a v azoie, S., Hughes , J. D., Campbel l, M. J., Cho, R . J. and Church, G. M. (1999 ). Systematic determination of genetic net wo rk arc h itecture. Nat Genet 22 , 281–2 85. W ang, J., Ra o, S., Chu, J., Shen, X., Lev asse ur, D. N., Theun issen, T. W. and Orkin, S. H . (2006). A protein interac tion n et w ork for plurip otency of embry onic stem cells. Natur e 444 , 364–368. Wellek , S. (2002). T esting Statistic al Hyp otheses of Equivalenc e . C R C Pr ess. Y an g, Y., Buckley, M. and S peed, T. (2001). Analysis of cDNA microarray images. Brief Bioinform 2 , 341–9. Yeung, K . Y., Fraley, C., Murua, A., Raft er y, A. E. and Ruzzo, W. L. (2001 ). Mo d el-based clustering and d ata transf ormations for gene expression data. Bioinformatics 17 , 977–987 . 18 List of Figures 1 Microarra y comparisons made within eac h p assage for the plurip otency stem cell e xp erimen t. Eac h arro w r epresen ts tw o arrays, one for eac h pas- sage (passage 21/22 con tinuous arrow, p assage 23/24 d ash ed arro w), with the arrow h ead p oint ing to the s ample lab eled with cy5, and th e sample at the arrow tail lab eled with cy3. Da y 0, 3, 6, and 9 are represent ed b y µ 0 , µ 3 , µ 6 , and µ 9 resp ectiv ely . . . . . . . . . . . . . . . . . . . . . . . . . 4 2 The pre-sp ecified gene expression profile for plurip otent genes. F or eac h da y , the log ratio with resp ect to d ay 0 is plotted. . . . . . . . . . . . . . 6 3 Illustration: for eac h gene, the distance from ( ˆ γ 1 , ˆ γ 2 ) to the nearest b oundary of the rejection region is used to rank the genes. . . . . . . . . 8 4 Fitted log r atios with resp ect to da y 0 for the r ank ed genes f or the plurip o- tency pr ofile (4.1). . . . . . . . . . . . . . . . . . . . . . . . . . . . . . . 11 5 Fitted log ratios with resp ect to da y 0 for the r ank ed genes with (a) ǫ = 0.5, (b) ǫ = 1, (c) ǫ = 1.5, and (d) ǫ = 2. . . . . . . . . . . . . . . . . . . 12 6 Fitted log ratios with resp ect to d a y 0 for the top 10 ranked genes for the S ox2 profile. . . . . . . . . . . . . . . . . . . . . . . . . . . . . . . . 13 7 Hyp othetical gene expression pr ofi le for a d a y 3 mark er gene. . . . . . . 15 19 List of T ables 1 P arameterization of stem cell exp erimen t in terms of absolute mean gene expressions ( µ i , i = 0 , 3 , 6 , 9 ) and in terms of the gene pr ofi le coefficients ( γ i , i = 0 , 1 , 2 , 3). . . . . . . . . . . . . . . . . . . . . . . . . . . . . . . . 4 2 The ranked genes from fitting p lurip oten t p rofile (4.1) to the stem cell data. . . . . . . . . . . . . . . . . . . . . . . . . . . . . . . . . . . . . . . 10 20
Original Paper
Loading high-quality paper...
Comments & Academic Discussion
Loading comments...
Leave a Comment