Time-Varying Networks: Recovering Temporally Rewiring Genetic Networks During the Life Cycle of Drosophila melanogaster
Due to the dynamic nature of biological systems, biological networks underlying temporal process such as the development of {\it Drosophila melanogaster} can exhibit significant topological changes to facilitate dynamic regulatory functions. Thus it …
Authors: Amr Ahmed, Le Song, Eric P. Xing
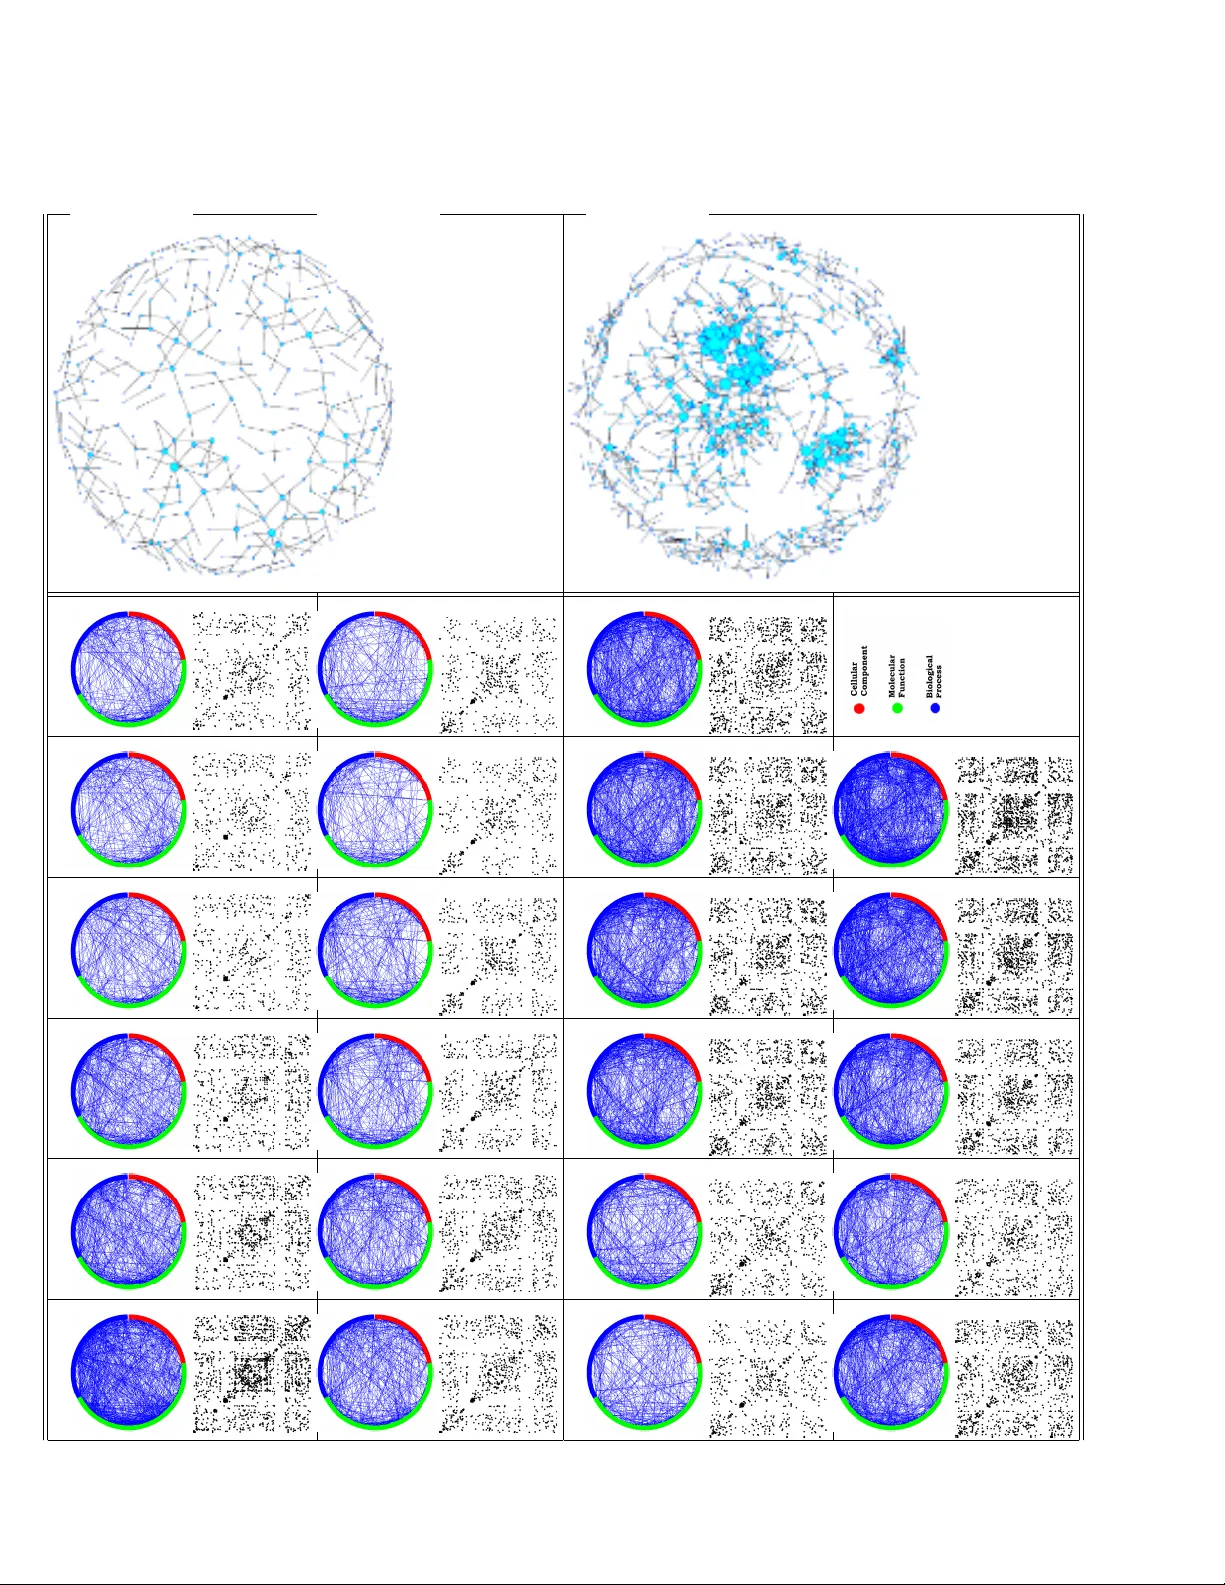
Time-V arying Net w orks: Reco v ering T emp orally Rewiring Genetic Net w orks During the Life Cycle of Dr osophila melano gaster Amr Ahmed † , Le Song † and Eric P . Xing ? SAILING Lab, Carnegie Mellon Universit y { amahmed,lesong,ep xing } @cs.cmu.edu † equally con tributing authors ? corresp onding author Abstract. Due to the dynamic nature of biological systems, biological netw orks underlying temp oral pro cess such as the dev elopment of Dr osophila melano gaster can exhibit significant top ological changes to facilitate dynamic regulatory functions. Th us it is essen tial to dev elop metho dologies that capture the temp oral evolution of net w orks, whic h mak e it possible to study the driving forces underlying dynamic rewiring of gene regulation circuit y , and to predict future net work structures. Using a new mac hine learning metho d called T esla, which builds on a nov el temp oral logistic regression technique, we rep ort the first successful genome-wide reverse-engineering of the latent sequence of temp orally rewiring gene net works o ver more than 4000 genes during the life cycle of Dr osophila melano gaster , giv en longitudinal gene expression measuremen ts and ev en when a single snapshot of suc h measurement resulted from eac h (time-sp ecific) netw ork is av ailable. Our metho ds offer the first glimpse of time-sp ecific snapshots and temp oral evolution patterns of gene netw orks in a living organism during its full developmen tal course. The recov ered netw orks with this unpreceden ted resolution chart the onset and duration of many gene in teractions which are missed by typical static netw ork analysis, and are suggestive of a wide array of other temp oral b eha viors of the gene netw ork ov er time not noticed b efore. I I In tro duction A ma jor challenge in systems biology is to understand and model, quantitativ ely , the top ological, func- tional, and dynamical prop erties of cellular netw orks, such as transcriptional regulatory circuitry and signal transaction path wa ys, that control the b eha viors of the cell. Empirical studies sho wed that man y biological netw orks b ear remark able similarities to v arious other net works in nature, such as so cial netw orks, in terms of global top ological characteristics such as the scale- free and small-world prop erties, alb eit with different characteristic co efficients (Barabasi & Albert, 1999). F urthermore, it w as observed that the a verage clustering factor of real biological net works is significantly larger than that of a random netw ork of equiv alen t size and degree distribution (Barabasi & Oltv ai, 2004); and biological netw orks are c haracterized by their intrinsic mo dularities (V´ aszquez et al., 2004), which reflect presence of physically and/or functionally linked molecules that work synergistically to achiev e a relativ ely autonomous functionality . These studies ha v e led to numerous adv ances tow ards uncov ering the organizational principles and functional prop erties of biological net works, and ev en identification of new regulatory even ts (Basso et al., 2005); how ev er, most of such results are based on analyses of static networks , that is, netw orks with inv ariant top ology ov er a given set of molecules, such as a protein-protein interaction (PPI) net work o v er all proteins of an organism regardless of the conditions under whic h individual interactions ma y tak e place, or a single gene net work inferred from microarra y data ev en though the samples may b e collected o ver a time course or multiple conditions. Ov er the course of a cellular pro cess, such as a cell cycle or an immune response, there may exist multiple underlying ”themes” that determine the functionalities of each molecule and their relationships to each other, and such themes are dynamical and sto c hastic. As a result, the molecular netw orks at each time p oin t are context-dependent and can undergo systematic rewiring, rather than b eing inv ariant ov er time, as assumed in most current biological netw ork studies. Indeed, in a seminal study b y Luscombe & et al. (2004), it was shown that the ”active regulatory paths” in a gene expression correlation net work of Sac char omyc es c er evisiae exhibit dramatic top ological c hanges and hub transience during a temp oral cellular pro cess, or in response to diverse stimuli. How ever, the exact mechanisms underlying this phenomena remain po orly understo od. What prev ents us from an in-depth in vestigation of the mec hanisms that drive the temp oral rewiring of biological netw orks during v arious cellular and physiological pro cesses? A key technical hurdle w e face is the unav ailability of serial snapshots of the rewiring netw ork during a biological pro cess. Under a realistic dynamic biological system, usually it is technologically imp ossible to exp erimentally determine time-sp ecific net work top ologies for a series of time p oin ts based on tec hniques suc h as tw o-h ybrid or ChIP-chip systems; resorting to computational inference metho ds such as structural learning algorithms for Bay esian netw orks is also difficult b ecause w e can only obtain a single snapshot of the gene expressions at each time point – ho w can one derive a net work structure sp ecific to a p oin t of time based on only one measurement of no de-states at that time? If we follow the naive assumption that each snapshot is from a different netw ork, this task would b e s tatistically imp ossible because our estimator (from only one sample) would suffer from extremely high v ariance. Extant metho ds w ould instead p ool samples from all time p oin ts together and infer a single ”av erage” netw ork (F riedman et al., 2000; Ong, 2002; Basso et al., 2005), which means they choose to ignore netw ork rewiring and simply assume that the netw ork snapshots are indep enden tly and identically distributed. Or one could perhaps divide the time series in to ov erlapping sliding windows and infer static net works for each window separately . These approach, how ev er, only utilizes a limited num b er of samples in eac h window and ignores the smo othly ev olving nature of the netw orks. Therefore, the resulting net w orks are limited in term of their temp oral resolution and statistical p ow er. T o our knowledge, no metho d is curren tly a v ailable for genome-wide reverse engineering of time-v arying netw orks underlying biological pro cesses with temp oral resolution up to every single time p oin t where gene expressions are measured. Here, w e presen t the first successful reverse engineering of a series of 23 time-v arying netw orks of Dr osophila melano gaster ov er its en tire developmen tal course, and a detailed top ological analysis of the temp oral evolution patterns in this series of netw orks. Our study is based on a new machine learning algo- rithm called TEmp or al ly Smo othe d L 1 -r e gularize d LOgistic R e gr ession , or T esla (stemmed from TESLLOR, the acronym of our algorithm). T esla is based on a key assumption that temp orally adjacent netw orks are lik ely not to b e dramatically different from each other in topology , and therefore are more likely to share common edges than temp orally distal netw orks. Building on the p o w erful and highly scalable iterative L 1 - I II regularized logistic regression algorithm for estimating single sparse netw orks (W ainwrigh t et al., 2006), w e develop a nov el regression regularization scheme that connects multiple time-sp ecific netw ork inference functions via a first-order edge smo othness function that encourages edge retention in netw orks immediately across time p oin ts. An imp ortan t prop ert y of this no vel idea is that it fully in tegrates all av ailable samples of the entire time series in a single inference pro cedure that recov ers the wiring patterns b etw een genes ov er a time series of arbitrary resolution — from a netw ork for every single time p oin t, to one netw ork for every K time p oin ts where K is very small. Besides, our metho d can also b enefit from the smo othly evolving nature of the underlying net works and the prior knowledge on gene on tology groups. These additional pieces of information increase the c hance to recov er biologically plausible netw orks while at the same time reduce the computational complexity of the inference algorithms. Imp ortan tly , T esla can b e casted as a conv ex opti- mization problem for whic h a globally optimal solution exists and can b e efficien tly computed for netw orks with thousands of no des. T o our kno wledge, T esla represen ts the first successful attempt on genome-wide reverse engineering of time-v arying netw orks underlying biological pro cesses with arbitrary temporal resolution. Earlier algorithmic approac hes, such as the structure learning algorithms for dynamic Bay esian netw ork (Ong, 2002), learns a time-homogeneous dynamic system with fixed no de dep endencies, which is entirely different from our goal, whic h aims at snapshots of rewiring netw ork. The T race-back algorithm (Luscombe & et al., 2004) that enables the revelation of netw ork changes ov er time in yeast is based on tracing active paths or subnetw ork in static summary netw ork estimated a priori from all samples from a time series, whic h is significan tly differen t from our metho d, b ecause edges that are transient ov er a short p eriod of time may b e missed by the summary netw ork in the first place. The DREM program (Ernst et al., 2007) that reconstructs dynamic regulatory maps trac ks bifurcation p oin ts of a regulatory cascade according to the ChIP-chip data ov er short time course, which is also different from our metho d, b ecause T esla aims at recov er the en tire time- v arying net w orks, not only the in teractions due to protein-DNA binding, from long time series with arbitrary temp oral resolution. A recent genome-wide microarray profiling of the life cycle of Dr osophila melano gaster revealed the ev olving nature of the gene expression patterns during the time course of its developmen t (Arb eitman et al., 2002). In this study , 4028 genes w ere examined at 66 distinct time points spanning the em bryonic, larv al, pupal and adultho od p erio d of the organism. It was found that most genes (86%) were differentially expressed ov er time, and the time courses of many genes follow ed a wa v e structure with one to three p eaks. F urthermore, clustering genes according their expression profiles help ed identify functional coherent groups sp ecific to tissue and organ developmen t. Using T esla, we successfully reverse-engineered a sequence of 23 ep och-specific netw orks from this data set. Detailed analysis of these net works rev eals a ric h set of information and findings regarding how crucial netw ork statistics change o ver time, the dynamic b ehavior of key genes at the h ubs of the net works, ho w genes forms dynamic clusters and how their inter-connectivit y rewires o vertime, and improv ed prediction of the activ ation patterns of already known gene in teractions and link them to functional b eha viors and dev elopmental stages. Results and Discussion Time-V arying Gene Netw orks in Dr osophila melano gaster T esla can reconstruct time-v arying dynamic gene netw orks at a temp oral resolution from one netw ork p er ev ery time p oin t to one netw ork p er ep och of arbitrary num b er of contiguous time p oints. F rom the 64-step long Drosophila melanogaster life cycle microarray time course, we reconstructed 23 dynamic gene netw orks, one per 3 time points, spanning the em bry onic (time point 1–11), larv al (time p oint 12–14), pupal (time point 15–20) and adultho od stage (time p oin t 21–23) d uring the life cycle of Dr osophila melano gaster (Fig. 1) . The dynamic netw orks app ear to rewire ov er time in resp onse to the developmen tal requirement of the organism. F or instance, in middle of embry onic stage (time p oin t 4), most genes selectively interact with other genes whic h results in a sparse netw ork consisting mainly of paths. In contrast, at late adultho o d stage (time p oin t 23), genes are more activ e and each gene interacts with man y other genes which leads to visible clusters of gene interactions. The global patterns of the evolution of the gene interactions in this netw ork series are summarized in Fig 2. The net work statistics include a summary of the degree distribution, netw ork size in term of the n umber of edges, and the clustering co efficien t of the net works, which are computed for eac h IV snapshot of the temp orally rewiring netw orks. The degree distribution provides information on the av erage n umber and the extent that one gene in teracts with other genes; the net work size c haracterizes the total n umber of active gene interactions in eac h time p oin t; and the clustering co efficien t quantifies the degree of coherence inside p oten tial functional mo dules. The change of these three indices reflects the temp orally rewiring nature of the underlying gene net works. All three indices display a wa ve pattern ov er time with these indices p eaking at the start of the em bry onic stage and near the end of adultho od stage. Ho wev er, b et w een these t wo stages, the evolutions of these indices can b e different. More sp ecifically , the degree distribution follo ws a similar path of evolution to that of the net work size: there are three large netw ork changes in the middle of em bryonic s tage (near time p oin t 5), at the b eginning of the larv al stage (time p oin t 11) and at the b eginning of the adultho od stage (time p oint 20). In contrast, clustering co efficien ts evolv e in a differen t pattern: in the middle of the life cycle there is only one p eak which o ccurs near the end of the em bryonic stage. This asynchronous ev olution of the clustering co efficien t from the degree distribution and net work size suggests that increased gene activity is not necessarily related to functional coherence inside gene mo dules. T o provide a summary of the 23-ep o c h dynamic netw orks, gene interactions recov ered at different time p oin ts are combined into a single netw ork (Fig. 3(a)). The resulting summary netw ork consists of 4509 dis- tinctiv e in teractions. Ov erall the summary netw ork rev eals a cen ter of tw o gian t clusters of tightly interacting genes, with several small lo ose clusters remotely connected to the cen ter. The tw o giant clusters are eac h built around genes with high degree centralit y . These t wo clusters and other small clusters are integrated as a single net work via a set of genes with high b et weenness centralit y . The top giant cluster is cen tered around tw o high degree no des, protein co ding gene eIF4AII I and CG9746. Both genes are related to molecular functions such as A TP binding. The selective interaction of these genes with other molecules mo dulates the biological functions of these molecules. In the b ottom giant cluster, high degree no des are more abundant compared to the top cluster. These high degree nodes usually hav e more than one functions. F or instance, gene dsf and dsx are inv olved in DNA binding and mo dulate their transcription, which in turn regulates the sex related biological pro cesses. Gene no c, CG14438, mkg-p are in volv ed in b oth ion binding and intracellular comp onent, while gene zfh1 and shn play imp ortan t roles in the dev elopmental pro cess of the organism. The connections b et ween the clusters are very often channeled through a set of genes with high b et w een- ness centralit y . Note these genes do not necessarily hav e a high degree. They are imp ortan t b ecause they pro vide the rela ys for man y biological path w ays. F or instance, gene fab1 is inv olv ed in v arious molecular func- tions such as A TP , protein and ion binding, while at the same time it is also in volv ed in biological pro cesses suc h as in tracellular signaling cascade. Gene dlg1 participate in v arious functions such as protein binding, cell polarity determination and cellular comp onen t. Another gene tko participates in functions related to rib osome from b oth molecular, biological and cellular comp onen t p oin t of views. F or comparison, a single static netw ork of comparable size ( ∼ 4500 gene interactions) is inferred by treating all measurements as indep enden t and iden tically distributed samples (Fig 3(e)). The static net work shares some common features with the summary graph of the dynamic netw orks. F or instance, both netw orks rev eal t wo giant clusters of interacting genes. How ever, the static netw ork provides no temp oral information on the onset and duration of each gene interaction. F urthermore, the static netw ork and the summary graph of the dynamic netw orks follow very different degree distributions. The degree distribution of the summary graph of the dynamic netw orks has a muc h hea vier tail than that of the static netw ork (Fig 3(f )). In other words, the distribution for the dynamic netw orks resembles more to a scale free netw ork while that for the static net work resembles more to a random graph. Hub Genes in the Dynamic Net works The h ub genes corresp ond to the high degree no des in summary net w ork. They represent the most influential elemen ts of a net work and tend to b e essential for the dev elopmental pro cess of the organism. The top 50 h ubs are identified from the summary graph of the dynamic net works in Fig. 3. These hubs are track ed ov er time in terms of their degrees and this evolution are visualized as colormap in Fig. 4(a). T o further understand the role play ed by these hubs, histogram analysis are p erformed on these 50 hubs in term of 43 ontological functions. The functional decomp osition of these hubs are shown in Fig. 4(c). The ma jority of these hubs are related to functions such as binding and transcriptional regulation activity . This V 1 2 3 4 5 6 7 8 9 10 11 12 Visualization for the netw ork at time p oint 4 13 14 15 16 17 18 19 20 21 22 23 Visualization for the netw ork at time p oint 23 Fig. 1. The 23 snapshots of the dynamic netw orks are visualized using a circular la yout and a scatter plot of the netw ork adjacency matrix. F or b oth lay outs, genes are ordered according to their top level functions (either related to cellular comp onen t, molecular function or biological pro cess). F urthermore, t wo snapshots are further visualized using a spring lay out algorithm and display ed in the last column of the figure. VI (a) (b) (c) Fig. 2. The evolution of the distribution on the node degree is summarized using its pow er law exp onen t in (a). The evolution of the num b er of edge is plotted in (b). The netw orks change in size ov er time with new edges app earing and old ones disapp earing. The num b er of newly added edges in each time p oin t is also plotted in (b). Plotted in (c) are the clustering co efficien ts for each snapshot of the temp oral netw orks. is in fact an exp ected outcome as transcription factors (TF) are thought to target a large n umber of genes and mo dulate their expression. T o further understand the functional sp ectrum of the genes targeted b y the high degree transcriptional factors, the top 20 transcriptional factor hubs are also track ed ov er time in terms of their degrees and the ev olution is illustrated in Fig. 4(b). The degrees of the transcriptional factors p eak at different stages which means they differentially trigger target genes based on the biological requirements of developmen tal pro cess. In Fig. 4(d)(e)(f ), functional decomp osition is p erformed on the target genes regulated by three example transcriptional factor hubs. F or instance, p eb, the protein ejaculatory bulb, interacts with extracellular region genes and genes inv olved in structural molecular activity . Another example is spt4 whic h triggers man y binding genes. This is consistent with its functional role in chromatin binding and zinc ion binding. Dynamic Clustering of Genes Most gene in teractions o ccur only at certain time during the life cycle of Dr osophila melano gaster . Indeed, on a verage there are only one eighth of the total gene in teractions presen t in each temporal snapshot of the dynamic netw orks. The clusters in the summary graph are the result of temp oral accumulation of the dynamic netw orks. T o illustrate this, tw o clusters of genes are singled out from Fig 3(a) for further study . Cluster I consists of 167 genes and there are five ma jor gene ontology groups, ie. binding activit y (34.7%), organelle (9%), transp orter activity (6.6%), transducer activity (6.6%) and motor activit y (5.4%); cluster I I consists of 90 genes and there are three ma jor gene ontology groups, ie. structural molecule activity (61.1%), organelle (8.9%) and transp orter activity (6.7%). T o obtain a finer functional decomp osition of the genes in the interaction netw orks, the largest connected comp onen t of the summary graph is further group ed into 20 clusters. Although this connected comp onen t consists only of ab out 40% (1674) of all genes , it contains more than 97% (4401) of the in teractions in the summary graph. This 20 clusters v ary in size, with the smallest cluster having only 11 genes and the largest cluster having 384 genes. The evolution of these cluster of genes is illustrated in Fig. 5. It can b e seen that the connections within a cluste r dissolv e and reapp ear ov er time, and different clusters w ax and w ane according to differen t schedule. F urthermore, the functional comp osition of these 20 clusters are compared against the background func- tional comp osition of the set of all 4028 genes. F or this purp ose, gene ontology terms are used as the bins for the histogram, and the n umber of genes belonging to eac h ontology group are coun ted in to the corre- sp onding bins. The functional comp osition of 9 out of the 20 clusters are statistically significantly differen t from the background (t wo sample Kolmogorov-Smirno v test at significance level 0.05). The top 5 functional comp onen ts of these significan t clusters are summarized in T able 1. During the life cycle of Dr osophila melano gaster , the dev elopmental program of the organism ma y require genes related to one function b e more active in certain stage than others. T o inv estigate this, genes are VI I (a) (b) (c) Fig. 3. The summary visualization in (a) is created b y adding the 23-ep och dynamic netw orks together; the width of an edge is prop ortional to the n umber of times it occurs, and the size of a node is prop ortional to its degree. (b) A static netw ork inferred by treating all microarray data as indep enden tly and iden tically distributed samples. (c) The degree distribution of the static netw ork is different from that of the summary graph of the dynamic net works. VI II (a) (b) (c) (d) (e) (f ) Fig. 4. (a) The top 50 hubs in the summary graph of the dynamic net works are track ed ov er time in terms of their degrees. Each row represents one h ub and each column represents a time p oin t with the color co de corresp onds to the degree of the hub. (b) shows the same information as (a) but only for the top 20 transcriptional factors with largest degree. (c) shows the functional decomp osition of the top 50 hubs. (d)(e)(f ) show examples of functional decomp osition of the genes regulated by the transcriptional factor hub. These examples corresp ond to the highlighted gene in (b) and their gene names are p eb, spt4 and no c resp ectiv ely . IX T able 1. T op 5 functional comp onents of the 9 clusters whose functional comp ositions are statistically significan tly differen t from the back functional comp osition. The second column of the table displays the n umber of genes in each cluster resp ectiv ely . The functional comp osition of eac h cluster is display ed as the p ercen tage of genes with that particular function. The last column of the table sho ws that p -v alue of the statistical test. # Genes # T op 5 F unction Comp onen ts p -v alue 1 138 transcription regulator activit y (15.9%), developmen tal pro cess (8.7%), < 10 − 6 organelle (13.8%), repro duction (8.0%), lo calization (5.8%) 2 384 binding (37.8%), organelle (12.5%), transcription regulator activity (7.8%), < 10 − 6 enzyme regulator activit y (7.6%), biological regulation (3.6%) 3 146 binding (29.5%), transp orter activity (11.0%), organelle (8.9%), 0 . 05 motor activit y (6.2%), molecular transducer activity (5.5%) 4 120 structural molecule activit y (45.0%), translation regulator activity (10.8%), < 10 − 6 organelle (6.7%), binding (5.8%), macromolecular complex (4.2%) 5 89 organelle (14.6%), binding (13.5%), m ulticellular organismal pro cess (11.2%), 10 − 3 dev elopmental pro cess (7.9%), biological regulation (7.9%) 6 25 catalytic activit y (16.0%), translation regulator activity (16.0%), organelle (8.0%), 0.04 an tioxidan t activity (8.0%), cellular pro cess (8.0%) 7 39 extracellular region (28.2%), biological adhesion (12.8%), binding (7.7%), 0.007 repro duction (7.7%), transp orter activity (5.1%) 8 119 m ulti-organism pro cess (16.0%), repro duction (9.2%), developmen tal pro cess (9.2%), < 10 − 6 molecular transducer activit y (7.6%), organelle (5.9%) 9 151 binding (28.5%), en velope (14.6%), organelle (9.9%), < 10 − 6 organelle part (9.9%), transp orter activity (5.3%) 1 2 3 4 5 6 7 8 9 10 11 12 13 14 15 16 17 18 19 20 21 22 23 Fig. 5. The adjacency matrix of the 20 clusters of genes derived from the largest connected comp onen ts of Fig. 3 are plotted ov er time. Sho wed on the upp er left corner is an enlarged picture of the adjacency matrix of the summary graph. The red lines sho w the b oundaries b et ween the clusters. X group ed according to their ontological functions. It is exp ected that the in teractions b et ween gene ontology groups, as quantified b y the n umber of wirings from genes in one group to those in another group, also exhibit temp oral pattern of rewiring. F or this purp ose, the 4028 genes are classified in to 3 top level gene ontology (GO) groups related to cellular comp onen t, molecular function and biological pro cess of Dr osophila melano gaster according to Flybase. Then they are further divided into 43 gene ontology groups which are the direct children of the 3 top level GO groups. The in teraction b et ween these ontology groups evolving ov er time is sho wn in Fig. 6. Through all stage of developmen tal pro cess, genes b elonging to three ontology groups are most active, and they are related to binding function, transcription regulator activity and organelle function resp ectiv ely . P articularly , the group of genes in volv ed in binding function play the central role as the hub of the netw orks of interactions b et ween ontology groups. Genes related to transcriptional regulatory activity and organelles function show p ersisten t interaction with the group of genes related to binding function. Other groups of genes that often interact with the binding genes are those related to functions such as developmen tal pro cess, resp onse to stimulus and biological regulation. Large top ological changes can also b e observ ed from the temp oral rewiring patterns b et ween these gene on tology groups. The most diverse interactions b et ween gene on tology groups o ccur at the b eginning of em bryonic stage and near the end of adultho od stage. In contrast, near the end of embry onic stage (time point 10), the in teractions b et ween genes are largely restricted to those from 4 gene on tology groups: transcriptional regulator activit y , enzyme regulator activity , binding and organelle. T ransien t Coherent Subgraphs During the dev elopmen t of Dr osophila melano gaster , there ma y be sets of genes within which the interactions exhibit correlated appearance and disapp earance. These sets of genes and their tight interactions form coheren t subgraphs. Note that coherent subgraphs can b e different from the clusters in the summary graph. While the former emphasizes the synchronous activ ation and deactiv ation of edges ov er time, the later only concerns the cum ulative effect of the degree of interactions b et ween genes. T o identify these coherent subgraphs, CODENSE (Hu et al., 2005) is applied to the inferred dynamic net works and 8 coherent subgraphs are discov ered (T able 2). These c oheren t subgraphs v ary in size, with the smallest subgraph containing 27 genes and the largest subgraph containing 87 genes. The degree of activit y of these functional modules as measured by the clustering coefficients of the subgraphs follows a stage-sp ecific temporal program. F or instance, subgraph 3 and 4 are most active during the adultho od stage, while subgraph 4 and 7 are most activ e during embry onic and pupal stage resp ectiv ely . It is natural to ask whether the genes in a coherent subgraph are enriched with certain functions. T o sho w this, the functional comp osition of these 6 subgraphs are also compared to the background functional comp osition of the set of all 4028 genes. Statistical test (tw o sample Kolmogorov-Smirno v test with signif- icance lev el 0.05) shows that 6 out of the 8 subgraphs are significantly different from the bac kground in term of their functions. F or instance, subgraph 6 is enric hed with genes related to binding (20.3%), en ve- lop e (18.6%), organelle part (16.9%), organelle (15.3%) and an tioxidan t activity (5.1%) ( p -v alue < 10 − 6 ). F urthermore, these genes reveal increased activity near the end of the first 3 developmen tal stages. Another example is subgraph 7 which is enrich with genes related to transp orter activity (11.1%), repro ductiv e pro- cess (11.1%), multicellular organismal pro cess (11.1%), organelle (7.4%) and transcription regulator activity (7.4%). These genes peak in their activity near the end of the pupal stage. These results suggest that differen t gene functional mo dules follow very different temp oral programs. Dynamics of Known Gene In teractions Differen t gene interactions may following distinctiv e temp oral programs of activ ation, app earing and disap- p earing at different time p oin t during the life cycle of Dr osophila melano gaster . In turn the transient nature of the interactions implies that the evidence supp orting the presence of an interaction b et ween tw o genes ma y not b e present in all microarray exp erimen ts conducted during different developmen tal stages of the or- ganism. Therefore, p o oling all microarray measuremen ts and inferring a single static netw ork can undermine the inference pro cess rather than helping it. This problem can b e ov ercome by learning dynamic netw orks whic h recov er transient interactions that are supp orted by correct subsets of exp erimen ts. XI 1 2 3 4 5 6 7 8 9 10 11 12 13 14 15 16 17 18 19 20 21 22 23 Fig. 6. T emp orally rewiring patterns of 43 gene ontology groups related to the cellular comp onent, molecular function and biological pro cess of Dr osophila melano gaster . The 4028 measured genes are group ed according to the 43 on tology group; The weigh t of an edge b et ween tw o ontology groups coun ts the num b er of connections b etw een genes across these tw o groups. The width of an edge in the visualization is prop ortional to its w eight. F or clarity , only edges with w eights greater than 5 are display ed. Each on tology group is co ded in clo ckwise order with a color shown in the legend on the upp er left corner. XI I T able 2. CODENSE is used to discov er coherent subgraphs across the 23 temp orally rewiring net works. Six such subgraphs are discov ered. The num ber of genes within each subgraph are 69, 58, 29, 87, 64, 59, 27 and 63 resp ectively . In each cell of the table the ev olution of the clustering co efficien t for each subgraph is plotted, and the corresp onding configurations of the subgraph at different time p oin ts are also illustrated. 1 2 3 4 5 6 7 8 T o show the adv an tage of dynamic netw orks ov er a static net work, the recov ered in teraction by these tw o t yp es of netw orks are compared against a list of 1143 known undirected gene interactions hosted in Flybase. The dynamic netw orks recov er 96 of these known gene interactions while the static net work only reco vers 64. That is dynamic netw orks recov er 50% more known gene interactions than the static net work. F urthermore, the static net w ork provides no information on when a gene in teraction starts or ends. In contrast, the dynamic net works pinp oin t the temp oral on-and-off sequence for each recov ered gene interaction. T o inv estigate whether the gene interactions with different activ ation pattern are related to their func- tional difference, hierarc hical clustering is performed on these set of reco vered gene in teractions based on their activ ation patterns (Fig. 7). It can b e seen that all these interactions are transient and very sp ecific to certain stage of the life cycle of Dr osophila melano gaster . F urthermore, gene in teractions with similar activ ation pattern tends to recruit genes with similar functions. T o demonstrate this, histogram analysis is p erformed base on the gene on tology groups of the genes inv olv ed in interactions. In Fig 7, five clusters in differen t level of the cluster hierarc hy are highligh ted and their histograms show that functionally different gene interactions tend to activ ation in very different temp oral sequence. F or instance, gene interactions in cluster I activ ates near the b oundary of em bryonic and larv al stage, and in these interactions, no genes are related to the cellular comp onen t function of the organism; cluster I I activ ates near the end of pupal stage and is enric hed by genes related to the cellular comp onen t function. Conclusion Numerous algorithms ha ve b een dev eloped for inferring biological netw orks from high throughput exp erimen- tal data, such as microarra y profiles (Segal et al., 2003; Dobra et al., 2004; Ong, 2002), ChIP-chip genome lo calization data (Lee et al., 2002; Bar-Joseph et al., 2003; Harbison et al., 2004), and protein-protein inter- action (PPI) data (Uetz et al., 2000; Giot et al., 2003; Kelley et al., 2004; Causier, 2004), based on formalisms suc h as graph mining (T anay et al., 2004), Bay esian netw orks (Cow ell et al., 1999), and dynamic Bay esian net works (Kanaza wa et al., 1995). Ho wev er, most of this v ast literature fo cused on modeling a static netw ork or time-inv ariant netw orks (F riedman et al., 2000), and muc h less has b een done tow ards mo deling the dy- namic processes underlying netw orks that are topologically rewiring and semantically evolving ov er time, and on developing inference and learning techniques for reco vering unobserved netw ork top ologies from observed attributes of entities (e.g., genes and proteins) constituting the netw ork. The T esla program presented here represen ts the first successful and practical to ol for genome-wide reverse engineering the netw ork dynamics based on the gene expression and ontology data. This method allows us to reco ver the wiring pattern of XI II (a) (b) Fig. 7. Ninety six known gene interactions are reco vered b y the inferred dynamic netw orks. The onset and duration of these interactions follo w differen t temp oral patterns. The activ ation of eac h gene in teraction o ver time is represented as one column in the upp er part of (a); within each column, if a gene interaction is active a blue dot is drawn otherwise the space is left blank. These temp oral sequences of activ ation can also b e viewed as a sequence of zeros and ones where zero means not active and one means active. Based on these sequences of zeros and ones, hierarchical clustering is p erformed on the gene in teractions. The clustering results are display ed on the top of the activ ation patterns. Note that the gene in teractions hav e also b een ordered according to the hierarchical clustering results. Therefore blo c k of gene interactions with similar activ ation patterns can b e seen. T o in vestigate how the activ ation patterns of gene interactions are related to their biological function, several clusters of gene in teractions are highlighted as cluster I, I I, I I I IV and V. The 43 gene on tology terms are used as the bins to build histograms to inv estigate the functional comp osition of eac h cluster. The histograms are enlarged and shown in (b). The histogram bins are ordered according to the gene ontology groups sho wn in the horizontal axis. The colors of the axis indicate the top 3 level of the gene ontology group related to cellular comp onen t (cyan), molecular function (purple) and biological pro cess (pink). XIV the genetic netw orks ov er a time series of arbitrary resolution. The recov ered netw orks with this unprece- den ted resolution chart the onset and duration of many gene interactions which are missed by typical static net work analysis. W e exp ect collections of complex, high-dimensional, and feature- rich data from complex dynamic biological pro cesses such as cancer progression, immune resp onse, and developmen tal pro cesses to con tinue to grow, giv en the rapid expansion of categorization and characterization of biological samples, and the improv ed data collection technologies. Thus we b elieve our new method is a timely contribution that can narro w the gap b et ween imminent metho dological needs and the av ailable data, and offer deep er understanding of the mec hanisms and pro cesses underlying biological netw orks. Material and Metho ds Microarra y Data W e used the microarray data collected by Arb eitman et al. (2002) in their study of the gene express ion patterns during the life cycle of Dr osophila melano gaster . Approximately 9,700 Dr osophila cDNA elemen ts represen ting 5,081 different genes were used to construct the 2-color sp otted cDNA microarrays. The genes analyzed in this pap er consists of a subset of 4,028 sequence-verified, unique genes. Exp erimen tal samples w ere measured at 66 differen t time p oin ts spanning the embry onic, larv al, pupal and adultho o d p erio d. Eac h hybridization is a comparison of one sample to a common reference sample made from p ooled mRNA represen ting all stages of the life cycle. Normalization is performed so that the dye dependent intenstiv e resp onse is remov ed and the av erage ratio of signals from the exp erimen tal and reference sample equals one. The final expression v alue is the log ratio of signals. Missing V alue Imputation Missing v alues are imputed in the same manner as Zhao et al. (2006). This is based on the assumption that gene expression v alues change smo othly ov er time. If there is a missing v alue, a simple linear interpolation using v alues from adjacen t time p oin ts is used, i.e. the v alue of the missed time p oin t is set to the mean of its t wo neighbors. When the missing p oin t is a start or a end p oin t, it is simply filled with the v alue of its nearest neigh b or. Expression V alue Binarization The expression v alues are quantized into binary num b ers using thresholds sp ecific to each gene in the same manner as Zhao et al. (2006). F or each gene, the expression v alues are first sorted; then the top t wo extreme v alues in either end of the sorted list are discarded; last the median of the remaining v alues are used as the threshold ab ov e which the v alue is binarized as 1 and 0 otherwise. Here 1 means the expression of a gene is up-regulated, and 0 means do wn-regulated. Net work Inference mo del In this paper, we used a new approach for reco vering time-ev olving netw orks on fixe d set of genes from time series of gene expression measurements using temp or al ly smo othe d L 1 -r e gularize d lo gistic r e gr ession , or in short, TLR (for temporal LR). This TLR can b e formulated and solv ed using existing efficient con vex optimization techniques which makes it readily scalable to learning ev olving graphs on a genome scale ov er few thousands of genes. F or eac h time ep o c h w e assumed that w e observ e binary gene activ ation patterns, which w e obtained from the con tin uous micro-arra y measuremen ts as described abov e. A t eac h ep och we represent the regulatory net work using a Marko v random field define as follows: Let G t = ( V , E t ) b e the graph structure at time ep o c h t with v ertex set V of size | V | = p and edge set E t . Let { X t 1: N t } b e a set of i.i.d binary random v ariables asso ciated with the vertices of the graph. Let the join t probability of the random v ariables b e given by the Ising mo del as follows: P ( x t d | Θ t ) = exp X i ∈ V θ t ii x t d,i + X ( i,j ) ∈ E t θ t ij x t d,i x t d,j − A ( Θ t ) ! , (1) XV where the parameters { θ t ij } ( i,j ) ∈ E t capture the correlation (regulation strength) b et w een genes X t i , and X t j . A ( Θ t ) is the log normalizing constant of the distribution. Given a set of { X t 1: N t } i.i.d samples drawn from P ( X t d | Θ t ) at each time step, the goal is to estimate the structure of the graph, i.e. to estimate { ˆ E t } T t =1 . W e cast this problem as a regularized estimation problem of the time-v arying parameters of the graph as follo ws: ˆ Θ 1 , . . . , ˆ Θ T = arg min Θ 1 ,...,Θ T T X t =1 nLL ( Θ t ) + R ( Θ 1 . . . Θ T , λ ) , (2) where, nLL ( · ) is the exact (or appro ximate surrogate) of the negativ e Log Lik eliho o d R ( · ) is a regu- larization term, and λ is the regularization parameter(s). W e assume that the graph is sp arse and evolv es smo othly o ver time, and w e w ould lik e to pick a regularization function R ( · ) that results in a sparse and smo oth graphs. The s tructure of the graphs can then b e recov ered from the non-zero parameters which are isomorphic to the edge set of the graphs. When T = 1, the problem in Eq. (2) degenerates to the static case: ˆ Θ = arg min Θ nLL ( Θ ) + R ( Θ , λ ) , (3) and th us one needs only to use a regularization function, R ( · ), that enforces sparsity . Several approaches w ere prop osed in the literature (W ainwrigh t et al., 2006; Lee et al., 2006; Guo et al., 2007). this problem has b een addressed b y c ho osing R = L 1 -p enalt y , ho wev er, they differ in the w ay they appr oximate the first term in Eq. (3) whic h is intractable in general due to the existence of the log partition function, A ( Θ ) (W ainwrigh t et al., 2006; Lee et al., 2006; Guo et al., 2007). In W ainwrigh t et al. (2006) a pseudo-likelihoo d approac h was used. The pseudo-likelihoo d, ˆ P ( X d | Θ ) = Q P i =1 P x d,i | x d , N ( i ) , where N ( i ) is the Marko v blanket of no de i , i.e., the neigh b oring no des of no de i . In the binary pairwise-MRF, this lo cal likelihoo d has a logistic-regression form. Thus the learning problem in (3) degenerates to solving P l 1 -regularized logistic regression problems resulting from regressing each individual v ariable on all the other v ariables in the graph. More sp ecifically , the learning problem for no de i is given by: ˆ θ i = arg min θ i 1 N N X d =1 log P x d,i | x d , − i , θ i + λ 1 k θ − i k 1 = arg min θ i 1 N N X d =1 log(1 + exp( θ i x d , − i )) − x d,i θ i x d , − i + λ 1 k θ − i k 1 , (4) where, θ i = ( θ i 1 , . . . , θ iP ) are the parameters of the L 1 -logistic regression, x d , − i denotes the set of all v ariables with x d,i replaced by 1, and θ − i denotes the vector θ i with the comp onen t θ ii remo ved (i.e. the in tercept is not p enalized). The estimated set of neigh b ors is given by: ˆ N ( i ) = { j : θ ij 6 = 0 } . The set of edges E is then defined as either a union or an intersection of neighborho od sets { N ( i ) } i ∈ V of all the vertices. W ainwrigh t et al. (2006) sho wed that b oth definitions would conv erge to the true structure asymptotically . T o extend the ab o ve approach to the dynamic setting, we return to the original learning problem in Eq. (2) and approach it using the techniques presen ted abov e. W e use the negativ e pseudo-loglik eliho o d as a surrogate for the intractable nLL ( · ) at each time ep och. T o constrain the multiple time-sp ecific regression problems each of whic h takes the form of Eq. (4) so that graphs are ev olving in a smo oth fashion, that is, not dramatically rewiring ov er time, we p enalize the difference b et w een the regression co efficien t vectors corresp onding to the same node, sa y i , at the tw o adjacen t time steps. This can b e done by introducing a regularization term k θ t i − θ t − 1 i k 1 1 for each no de at each time. Then, to also enforce sparsity o ver the graphs learnt at each ep o c h, in addition to the smo othness b et ween their evolution across epo c hs, we use the standard L 1 p enalt y ov er each θ t i . These choices will decouple the learning problem in (2) into a set of P separate smo othe d L 1 -regularized logistic regression problems, one for each v ariable. Putting everything together, for eac h no de i in the graph, w e solve the following problem for : ˆ θ 1 i , . . . , ˆ θ T i = arg min θ 1 i ,...,θ T i T X t =1 l av g ( θ t i ) + λ 1 T X t =1 k θ t − i k 1 + λ 2 T X t =2 k θ t i − θ t − 1 i k 1 1 , (5) XVI where l av g ( θ t i ) = 1 N t N t X d =1 log P x t d,i | x t d , − i , θ t i = 1 N t N t X d =1 log(1 + exp( θ t i x t d , − i )) − x t d,i θ t i x t d , − i . (6) The problem in Eq. (5) is a conv ex optimization problem with a non-smo oth L 1 functions. Therefore, we solv e the following equiv alent problem instead b y in tro ducing new auxiliary v ariables, u t i and v t i (the case for q = 2 is handled similarly): min θ 1 i ,...,θ T i ,u 1 i ,...,u T i ,v 2 i ,...,v T i T X t =1 l av g ( θ t i ) + λ 1 T X t =1 1 T u t i + λ 2 T X t =2 1 T v t i (7) sub ject to − u t i,j ≤ θ t i,j ≤ u t i,j , t = 1 , . . . , T , j = 1 , . . . , i − 1 , i + 1 , . . . , P , sub ject to − v t i,j ≤ θ t i,j − θ t − 1 i,j ≤ v t i,j , t = 2 , . . . , T , j = 1 , . . . , P , where 1 denotes a vector with all comp onen ts set to 1, so 1 T u t i is the sum of the comp onents of u t i . T o see the equiv alence of the problem in Eq. (7) with the one in Eq. (5, we note that at the optimal p oint of Eq. (7), we must hav e u t i,j = | θ t i,j | , and similarly v t i,j = | θ t i,j − θ t − 1 i,j | , in which case the ob jectiv es in Eq. (7) and Eq. (5) are the same (a similar solution has b een applied to solving L 1 -regularized logistic regression in Koh et al. (2007)). The problem in Eq. (7) is a conv ex optimization problem, with now a smo oth ob jectiv e, and linear constrain t functions, so it can b e solved by standard conv ex optimization metho ds, such as interior p oin t metho ds, and high qualit y solvers can directly handle the problem in Eq. (7) efficien tly for medium to large scale (up to few thousands of no des). In this pap er, we used the CVX optimization pack age 1 . Gene Ontology Gene ontology (GO) data is obtained from Flybase 2 . There are altogether 25,072 GO terms with 3 name spaces: molecular function, biological pro cess and cellular comp onen t. The GO terms are organized into a hierarc hical structure, and 16,189 GO terms are leaf no des of the hierarch y . The 4,028 genes are assigned to one or more leaf no des. When we estimate the netw orks for a target gene, we restrict the netw ork inference to those genes that share common GO terms with the target gene. This op eration restricts the netw ork inference to a biologically plausible set of genes and it also drastically reduces the computation time. Mining F requent Coheren t Subgraphs CODENSE is an algorithm for efficiently mining frequen t coherent dense subgraphs across a large num b er of massiv e graphs (Hu et al., 2005). In the context of dynamic netw orks, it is adapted to discov er functionally coheren t gene modules across the temporal snapshots of the net w orks. In such a module, the interactions b et w een comp onen t genes follow a similar pattern of onset and duration. CODENSE takes as inputs a summary graph and a supp ort v ector for each edge. A no de in the summary graph represen ts a gene; an edge represents a gene in teraction and its w eight is the num b er of times that this interaction o ccurs o ver time. The summary graph is used to guide the search for dense subgraphs in CODENSE. A supp ort vector records the exact temp oral sequence of on-and-off of a gene interaction. Using the supp ort vectors, CODENSE finds a set of genes whose interactions follow a similar path of evolution. Ac kno wledge Le Song is supp orted by Lane F ellowship for computational biology . 1 http://stanford.edu/$\sim$boyd/cvx 2 http://flybase.bio.indiana.edu Bibliograph y Arb eitman, M., F urlong, E., Imam, F., Johnson, E., Null, B., Baker, B., Krasnow, M., Scott, M., Da vis, R., & White, K. (2002). Gene expression during the life cycle of Dr osophila melano gaster . Scienc e , 297 , 2270–2275. Bar-Joseph, Z., Gerb er, G., Lee, T., Rinaldi, N., Y o o, J., Rob ert, F., Gordon, D., F raenk el, E., Jaakk ola, T., Y oung, R., & Gifford, D. (2003). Computational discov ery of gene mo dule and regulatory netw orks. Natur e Biote chnolo gy , 21 (11), 133742. Barabasi, A. L., & Alb ert, R. (1999). Emergence of scaling in random netw orks. Scienc e , 286 , 509–512. Barabasi, A. L., & Oltv ai, Z. N. (2004). Netw ork biology: Understanding the cell’s functional organization. Natur e R eviews Genetics , 5 (2), 101–113. Basso, K., Margolin, A., Stolovitzky , G., Klein, U., Dalla-F av era, R., & Califano, A. (2005). Reverse engi- neering of regulatory net works in human b cells. Nat Genet , 1061–4036. Causier, B. (2004). Studying the interactome with the y east tw o-hybrid system and mass sp ectrometry . Mass Sp e ctr om R ev , 23 (5), 350367. Co well, R. G., Da wid, A. P ., Lauritzen, S. L., & Spiegelhalter, D. J. (1999). Pr ob abilistic Networks and Exp ert Systems . Springer. Dobra, A., Hans, C., Jones, B., Nevins, J., Y ao, G., & M.W est (2004). Sparse graphical mo dels for exploring gene expression data. J. Mult. Analysis , 90 (1), 196212. Ernst, J., V ainas, O., Harbison, C. T., Simon, I., & Bar-Joseph, Z. (2007). Reconstructing dynamic regulatory maps. Mol Syst Biol , 3 , 1744–4292. F riedman, N., Linial, M., Nachman, I., & Peter, D. (2000). Using bay esian netw orks to analyze expression data. Journal of Computational Biolo gy , 7 , 601–620. Giot, L., Bader, J. S., Brouw er, C., Chaudhuri, A., Kuang, B., Li, Y., Hao, Y. L., Ooi, C. E., Go dwin, B., Vitols, E., Vija yadamodar, G., Pochart, P ., Machineni, H., W elsh, M., Kong, Y., Zerhusen, B., Malcolm, R., V arrone, Z., Collis, A., Minto, M., Burgess, S., McDaniel, L., Stimpson, E., Spriggs, F., J.Williams, Neurath, K., Ioime, N., Agee, M., V oss, E., F urtak, K., Renzulli, R., Aanensen, N., Carrolla, S., Bick el- haupt, E., Lazov atsky , Y., DaSilv a, A., Zhong, J., Stany on, C. A., Jr, R. L. F., & Roth b erg, J. M. (2003). A protein in teraction map of drosophila melanogaster. Scienc e , 302 (5651), 17271736. Guo, F., Hannek e, S., F u, W., & Xing, E. P . (2007). Recov ering temporally rewiring netw orks: A mo del-based approac h. ICML . Harbison, C. T., Gordon, D. B., Lee, T. I., Rinaldi, N. J., Macisaac, K. D., Danford, T. W., Hannett, N. M., T agne, J., Reynolds, D. B., Y oo, J., Jennings, E. G., Zeitlinger, J., Pokholok, D. K., Kellis, M., Rolfe, P . A., T akusaga wa, K. T., Lander, E. S., Gifford, D. K., F raenkel, E., & Y oung, R. A. (2004). T ranscriptional regulatory co de of a euk ary otic genome. Natur e , 431 (7004), 99104. Hu, H., Y an, X., Huang, Y., Han, J., & Zhou, X. (2005). Mining coherent dense subgraphs across massive biological net works for functional discov ery . Bioinformatics , 21 (1), i213–i221. Kanaza wa, K., Koller, D., & Russell, S. (1995). Sto c hastic simulation algorithms for dynamic probabilistic net works. Pr o c e e dings of the 11th A nnual Confer enc e on Unc ertainty in AI . Kelley , B. P ., Y uan, B., Lewitter, F., Sharan, R., Sto c kwell, B. R., & Ideker, T. (2004). Path blast: a to ol for alignmen t of protein interaction netw orks. Nucleic A cids R es , 23 , 83–88. Koh, K., Kim, S., & Boyd, S. (2007). An in terior-p oin t metho d for large-scale l1-regularized logistic regression. Journal of Machine le arning r ese ar ch . Lee, S.-I., Ganapathi, V., & Koller, D. (2006). Efficien t structure learning of marko v net works using l1- regularization. NIPS . Lee, T. I., Rinaldi, N. J., Rob ert, F., Odom, D. T., Bar-Joseph, Z., Gerber, G. K., Hannett, N. M., Harbison, C. T., Thompson, C., Simon, I., Zeitlinger, J., Jennings, E. G., L.Murra y , H., Gordon, D. B., Ren, B., Wyric k, J. J., T agne, J., V olkert, T. L., F raenkel, E., Gifford, D. K., & Y oung, R. A. (2002). T ranscriptional regulatory net works in saccharom yces cerevisiae. Scienc e , 298 (5594), 799804. Luscom b e, N., & et al. (2004). Genomic analysis of regulatory netw ork dynamics reveals large top ological c hanges. Natur e , 431 , 308–312. Ong, I. M. (2002). Mo delling regulatory pathw a ys in e.coli from time series expression profiles. Bioinfor- matics , 18 , 241–248. XVI II Segal, E., Shapira, M., A. Regev, D. P ., Botstein, D., Koller, D., & F riedman, N. (2003). Mo dule netw orks: iden tifying regulatory mo dules and their condition-sp ecific regulators from gene expression data. Natur e Genetics , 43 (2), 16676. T ana y , A., Sharan, R., Kupiec, M., & Shamir, R. (2004). Revealing modularity and organization in the yeast molecular net work by integrated analysis of highly heterogeneous genomewide data. Pr o c. Natl. A c ad. Sci. , 101 (9), 2981–6. Uetz, P ., Giot, L., Cagney , G., Mansfield, T., & et. al (2000). A comprehensive analysis of protein-protein in teractions in saccharom yces cerevisiae. Natur e , 403 (6670), 601–603. V´ aszquez, A., Dobrin, R., Sergi, D., Eckmann, J.-P ., Oltv ai, Z. N., & Barab´ asi, A.-L. (2004). The top o- logical relationship b et ween the large-scale attributes and lo cal interaction patterns of complex netw orks. Pr o c e e dings of the National A c ademy of Scienc es , 101 , 17940—17945. W ain wright, M., Ravikumar, P ., & Laffert y , J. (2006). High dimensional graphical model selection using l1-regularized logistic regression. In Neur al Information Pr o c essing Systems . Zhao, W., Serp edin, E., & Dougherty , E. (2006). Inferring gene regulatory netw orks from time series data using the minim um description length principle. Bioinformatics , 22 (17), 2129–2135.
Original Paper
Loading high-quality paper...
Comments & Academic Discussion
Loading comments...
Leave a Comment