Between the Information Economy and Student Recruitment: Present Conjuncture and Future Prospects
In university programs and curricula, in general we react to the need to meet market needs. We respond to market stimulus, or at least try to do so. Consider now an inverted view. Consider our data and perspectives in university programs as reflectin…
Authors: ** Fionn Murtagh (Science Foundation Irel, Director, Information
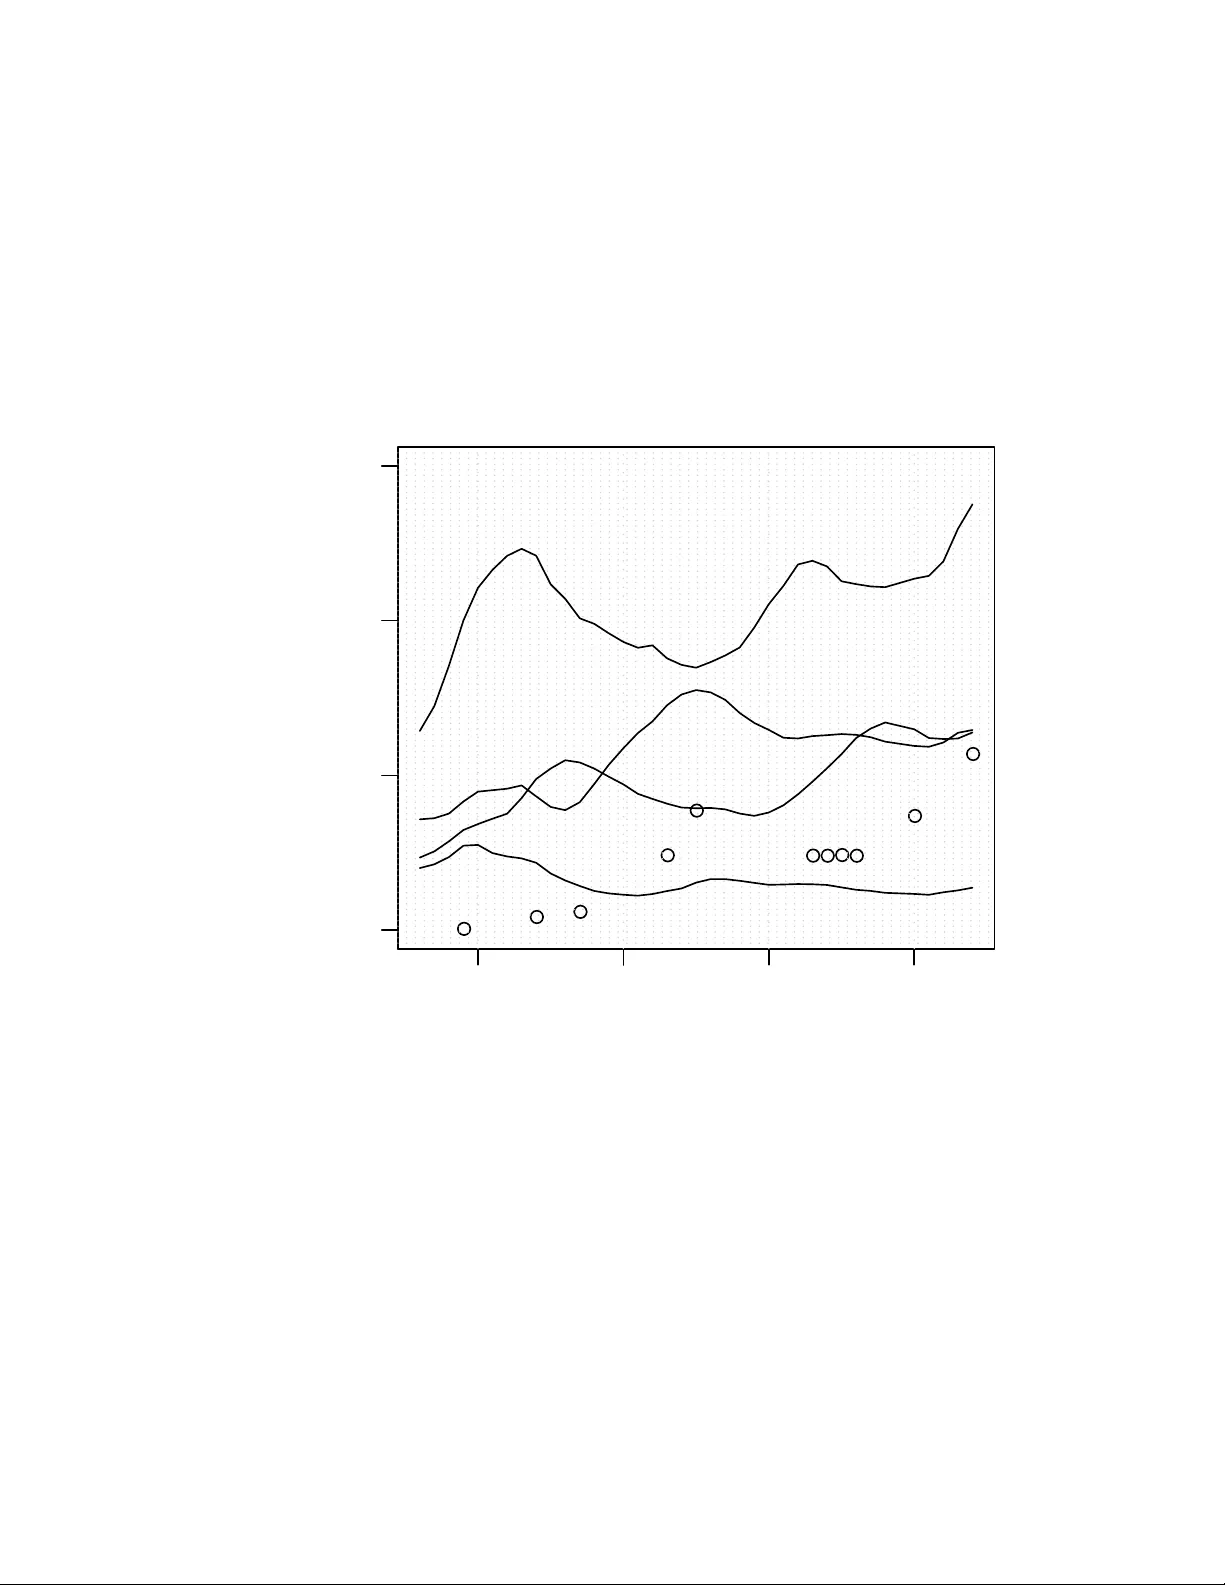
Bet w een the Information Econom y and Studen t Recruitmen t: Presen t Conjuncture and F uture Prosp ects Fionn Murtagh ∗ Director, Information, Comm unications and Emergent T echnologies Science F oundation Ireland Wilton House, Wilton Place, Dublin 2, Ireland Email: fm urtagh@acm.org Marc h 4, 2022 Abstract In univ ersity programs and curricula, in general w e react to the need to meet mark et needs. W e resp ond to market stimulus, or at least try to do so. Consider no w an inv erted view. Consider our data and persp ectiv es in univ ersity programs as reflecting and indeed presaging economic trends. In this article I pursue this line of thinking. I sho w how v arious past ev ents fit very well into this new view. I provide explanation for why some tec hnology trends happ ened as they did, and wh y some current dev elopments are imp ortan t now. 1 The Do wn turn in Academic Computer Sci- ence Undergraduate Studen t Recruitmen t The student recruitment crisis of Computer Science and Engineering (CS and E) has b een seen as one where there is ov er-provision of supply relative to demand. A resp onse has b een sough t in more public outreach and in restructuring course pro vision. I am completely at one with this imp ortan t w ork. In this article I wan t to lo ok at this context of discomfort and indeed of crisis from a v ery different v antage p oin t. I will argue that we can view the swings of fortune in CS and E studen t recruitmen t as a prism with whic h to view large ∗ Fionn Murtagh is also Professor of Computer Science in the Univ ersity of London. De- partment of Computer Science, Ro yal Hollowa y , University of London, Egham TW20 0EX, England 1 scale underlying technol ogy and economic trends. I will illustrate this argument in v arious w a ys. In an ideal world we could step back and just note that student demand has gone elsewhere, assuming relativ ely unc hanging demographics. Maybe w e w ould ev en retool our exp ertise, b y c hanging researc h discipline for example. But there has b een very great fluctuation in student demand and reacting ov erly hastily to the ups and do wns of fortune is rarely a go o d idea. In this article I will lo ok closer at this fluctuation in student demand for CS and E. I will rev erse the usual view of trying to explain studen t demand in terms of deep-lying econom y needs. Instead I will presen t the view that ma jor fluctuations in the economy can – up to a point – b e in terpreted and understoo d b y the a v ailable data on student demand. The fit with a wide range of important tec hnology trends is very goo d, as I will exemplify . Bet ween technological upswings I will present the view that one should pre- pare well for the next upswing. In regard to how we prepare for the future, one p oin t to b e noted is that our persp ectiv e will be a cloudy one if traditional eco- nomic categories like manufactured goo ds and services dominate our thinking. See section 2.5 for further discussion here. Relativ ely interc hangeably in this article I will use the terms CS and E, and ICT or information and communications tec hnology . The latter is preferred when the industrial, commercial and market aspects are strongly represented. 2 The Information So ciet y and the New Econ- om y P erio ds of Sp ectacular Gro wth There hav e b een tw o ma jor ICT-led economic b ooms in recen t times. In b oth phases, the communications aspect of computing was hugely prominent. Figure 1 shows an educational reflection of what happened and when. I use North American data a n umber of times in this article b ecause it is of high qualit y and collected in a consisten t wa y ov er many years. Twice, w e find ma jor upswings in attractiveness of the science and technology . Figure 1 relates to incoming student inten tions. Like business confidence surv eys vis-` a-vis the econom y , Figure 1 expresses the pulling p o wer of the discipline (or the generally p erceiv ed tigh t cluster of disciplines asso ciated with CS and E). W e see, w ell- mirrored in Figure 1, a massive take-off of, and interest in, computerization. By the late 1980s, this w as in free-fall. Growth w as ratcheted up in the 1990s. By early 2001, the economy was slipping fast (see e.g. [30] in supp ort of the do wnturn starting in late 2000). I will lo ok at these tw o massive technology upswings, w ell expressed by the bumps in Figure 1. In line with what they hav e b een often called, I will use the respective terms of Information So ciet y and New Economy perio ds or b ooms. As a synonym here for b oom, I will use the term up welling. In o cean pro cesses, upw elling is heat- and gra vity-engendered. Up welling ev ents hav e imp ortan t implications for biomass and later parts of the fo od chain. The 2 up welling metaphor is an apt one. 2.1 The Information So ciet y Bo om P erio dizing the earlier Information Society b o om may b e help ed by Figure 1 and this note from [36] that “b et ween 1980 and 1986, undergraduate CS pro duction nearly quadrupled to more than 42,000 degrees. This perio d w as follo wed b y a swift decline and leveling off during the 1990s”. The first great b o om was the p ersonal computer (PC) led one, fo cused on the computerization of so ciet y , and it also sa w a great deal of early activity in net working. This bo om w as led by the generalized PC uptak e in the early 1980s. It put to rest the debate on whether computerization of society could lead to pro ductivit y and general growth. A k ey text, with influence in ternationally , was the Nora/Minc rep ort [20], which inspired F renc h telecoms through Minitel, for example (an early c hapter of [20] is en titled “F rom informatics to telematics”). Among the very opening lines are: “Increasing computerization of so ciet y is at the heart of the crisis” and the economic, political and so cial crisis is charac- terized generally b y “gra ve, new c hallenges” under the ov erall heading of “the F rench crisis of informatics”. T ectonic mov ements la y in the technology undergro wth, underlying science and engineering, and in market forces. Just to sk etch a few imp ortant even ts of the time, Intel’s first micropro cessor w as launched in Nov ember 1971. The Apple I I personal computer, introduced in 1977, w as in con tin uous pro duction un til 1993. It was successful and mass-pro duced. The IBM PC, or IBM 5150, w as launc hed in August 1981. V ery soon the IBM PC had massively ov ertaken other alternativ e platforms [28]. 1984 sa w the div estiture of A T&T’s operating companies into seven Regional Bell Op erating Companies (see [23] for discussion and historical bac kground). Mobile telephony was launc hed in the US in 1984. What was termed the deregularization or lib eralization of the telecoms mar- k et was initiated in the Europ ean Union in 1985 through directives under the T reaty of Rome. The massiv e gro wth from the early 1990s of mobile telephon y relativ e to fixed line telephon y is well c harted in [23]. So to o are the organisa- tional changes in the sector, including domestic and international alliances, and mergers and acquisitions (M&As) all of which hugely increased. 2.2 The T elecoms View Preceding the Information So ci- et y Bo om Against a background of mark et dominance by IBM, and the use of videotext in the UK (information delivered to end users by television signal), the national telecoms pro vider in F rance, DGT – Direction G ´ en ´ erale des T´ el´ ecommunications, obtained a sup erministerial budget in 1975, and in 1978, Simon Nora and Alain Minc submitted their hugely influen tial rep ort, [20], to Presiden t V al´ ery Giscard d’Estaing. The Nora/Minc report forecasted (the following is taken from [29]): “A mas- siv e so cial computerization will take place in the future, flowing through so ciet y 3 lik e electricit y . ... The debate will focus on in terconnectability .” The rep ort con- cluded that the adv ent of c heap computers and p o werful global comm unications media was leading to “an uncertain so ciet y , the place of uncoun table decen tral- ized conflicts, a computerized so ciet y in which v alues will b e ob ject of numerous riv alries stemming from uncertain causes, bringing an infinite amoun t of lateral comm unication.” T o contin ue to compete in the first rank of nations, Nora and Minc exhorted, F rance would ha ve to mount a full-scale national effort in the new field they named telematics (merging the terms “telecommunications” and “informatics”). They did not fail to note that “T elematics, unlike electricit y , do es not carry an inert current, but rather information, that is to say , p ow er” and that “mastering the netw ork is therefore an essen tial goal. This requires that its framework be conceiv ed in the spirit of a public service.” Officially launc hed in 1982, Minitel was a great success. In 1998 there w ere 5.6 million Minitel terminals av ailable for this use of this secure but closed net work [17]. 2.3 Bet w een the Information So ciet y and New Econom y Bo oms: An Example from Financial Data and Infor- mation In this section I will lo ok at one economic sector and how a ma jor initiative w as undertak en and grown before and then during the 1990s New Econom y b o om. I use it as an apt example of where and ho w new initiativ es can be seeded to tak e adv antage of economic doldroms, and p erhaps particularly adv antageously during suc h do wnbeat perio ds. Financial services no w accoun t for a goo d part of leading economies. In the US, financial services contribute to GDP (gross domestic pro duct) at 8 p ercent. In New Y ork City , in 2007 the finance industry was “resp onsible for nearly one third of all w ages earned” [32]. In the UK, the financial services sector con tributes 6 p ercen t to GDP and emplo ys 4 p ercen t of the national w orkforce. (See [9]). Finance is based on the direct and immediate pro cessing of data and infor- mation. In this sense it is one big application of ICT. The International Financial Services Cen ter, IFSC, w as established in Dublin in 1987 b et w een the tw o b oom p erio ds. It has been a significant success story . The IFSC now has 10,700 employ ed, gro wing b y 1000 p er y ear. More than 430 in ternational op erations trade in the IFSC, and a further 700 are appro ved to carry on business there. F rom a very low base at the beginning of the 1990s, Ireland has b ecome an established center for the Europ ean in vestmen t funds industry , as sho wn in T able 1 [9]. The Decem b er 2007 financial services strategy rep ort [9] on the Irish and in ternational financial services sector makes in teresting reading too that links up with the growth in PhDs. (This is discussed further in section 3.) This rep ort provided a rationale as to wh y and where more PhDs are needed in this sector. Rather than “skilled generalists” lacking sp ecialized knowledge, this 4 Luxem b ourg 24.4% F rance 19.7% German y 13.4% UK 10.3% Ireland 9.5% Italy 5.1% Spain 3.8% Other 13.8% T otal 100% T able 1: Percen tage net assets of the Europ ean inv estment fund industry , 2006. F rom [9]. rep ort called for “a greater fo cus on sp ecializing in a n umber of selected areas whic h would supp ort the dev elopment of a distinctive comp etence which was more aligned with a mid to high cost base.” 2.4 The New Economy or Dot-Com Bo om The second great b oom came ab out through the web, with complementary activ- it y in telecoms, e-commerce and dot-com ven ture capital and finance generally . Wide and p opular take-up of the web w as consolidated with the release of the Mosaic browser in early 1993 b y Marc Andreessen, a student who graduated in 1993 at the Univ ersity of Illinois at Urbana-Champaign. This led to absolute dominance o ver other information sharing systems that w ere current in the v ery early 1990s, such as Gopher and V eronica, W AIS (wide area information system, based on the Z39.50 protocol), archie and others. Tw o markers of the Dot-Com b o om are to be seen in Ireland and in Finland. The Celtic Tiger [21] was a term coined by [11] in August 1994. The parallel w as with the Asian Tiger economies. In some years of the Celtic Tiger p erio d gro wth, measured by real GDP (gross domestic pro duct), was more than 10%. Statistics and discussion can be seen at [8]. By 2008, the ICT s ector had grown in Ireland to employ more than 91,000 p eople. The Irish soft ware sector alone accoun ts for 10% of Ireland gross domestic pro duct [31]. This spectacular Irish gro wth to ok off in 1993 and contributed crucially to Ireland’s impressiv e growth up to 2001 [10]. So the Irish Celtic Tiger perio d began at the same time as the p opular take-up of the w eb, and both grew in tandem. In Finland, the history of Nokia is rev ealing also from the p oin t of view of timing relative to the New Economy . Nokia ev olved from b eing an industrial conglomerate dating from the 1860s. It was established as a woo d pulp mill in 1865; mo ved to rubber and cable companies op erating in alliance with a forestry compan y from 1922 to 1966/1967; follo wing a merger it expanded in to electronics; and from this, telecoms took off in the 1990s. The tak e-off of Nokia w as started in the 1990s, at roughly the same time as the Irish Celtic Tiger 5 tak e-off, and the p opular upsurge of the w eb. Nokia p oint to a management decision that in 1994, “form ulated the key elements of Nokia’s strategy: leav e old businesses and increasingly focus on telecomm unications.” So a range of momentous decisions and even ts w ere happ ening at roughly the same time, relating to: net works; mobile telecoms; user in terfaces; the in- formation economy; and information distribution. On the latter, information distribution, the July 1994 plunge of comet Sho emaker-Levy in to the planet Jupiter, lasting a week, was an early example. Net works including the y oung w eb came of age at that time, through massiv e worldwide interest. My role in- cluded analyzing image data and getting information out by all av ailable means – web, other netw orks (e.g., CompuServe, a dial-up netw ork later absorb ed into A OL), news and television media. The context is describ ed by [38]. The Dot-Com b oom collapsed by early 2001, and it may be the case that we are now pulling out of the down turn. A go o d pro xy for whether we are or not is the attractiv eness manifested b y undergraduate studen t recruitmen t. In terna- tionally this has b een in freefall since 2001. There hav e b een bad consequences: some departments ha ve retrenc hed, and old debates ab out the nature of our science and engineering hav e again dev elop ed an unpleasant rawness. “After six years of declines, the num b er of new CS ma jors in fall 2006 was half of what it w as in fall 2000 (15,958 versus 7,798)” [35]. Nonetheless the prognosis stated there is hopeful that a turn-around is no w happening. The resp onse to the crisis of student recruitment in CS, with knock-on bud- getary (salary and support) effects, has been surprisingly uniform. It has led to attempts to refocus undergraduate curricula into new digital media suc h as digital m usic; games technologies; and information securit y . One interesting thing ab out Figure 2 is that it shows where the students w ent, giv en their fligh t from CS and E. Ph ysical Science (Ph ysics, Chemistry , Astronom y , Other) had a v ery similar curv e to that of Mathematics, so we do not show it here. It do es appear that for the 1980s b oom, CS gained greatly in shifting studen ts in such a w ay that ultimately Biological Science and So cial Sciences w ere the losers then. In the 1990s bo om there is some indication of this swing again, albeit less pronounced. Note that in Figure 2 the degrees a warded can be exp ected to hav e some lag relative to underlying economic dev elopments, and relativ e to inten tions as seen in Figure 1. 2.5 The Information So ciet y and New Econom y Upw elling P erio ds: View from Economics Ho w real the ICT base for society had become remained for long an op en issue to b e addressed, – a set of questions rather than a resoundingly clear response to profound structural c hanges in econom y and society . It was so for b oth the Information So ciet y upw elling of the 1980s and for the New Economy of the 1990s. P akko [22] discusses ho w far there w as qualitative c hange. T emple [33] dis- cusses whether or not the econom y had b ecome structurally new. In b oth cases 6 ● ● ● ● ● ● ● ● ● ● ● ● ● ● ● ● ● ● ● ● ● ● ● ● ● ● ● ● ● ● ● ● ● ● ● ● 1970 1980 1990 2000 1 2 3 4 5 Percent CS, CE incoming freshman intentions Percentage of all subjects, fall of: 1971−2006 Figure 1: A clear view of the tw o great p eaks in attractiveness of CS in the past decades. These are in tentions and not ac- tual commitmen ts to degree programs, surv eyed from incoming freshmen. Data from www.cra.org/wp/index.php?p=104 and also www.imageofcomputing/p df/Heri Study 2006.p df Data analyzed b y CRA, Computing Research Asso ciation; originally from HERI, Higher Education Researc h Institute, Universit y of California, Los Angeles. In the discussion I asso ciate the tw o p eaks with, resp ectiv ely , the Information So ciet y and the New Econom y up wellings. 7 ● ● ● ● ● ● ● ● ● ● ● ● ● ● ● ● ● ● ● ● ● ● ● ● ● ● ● ● ● ● ● ● ● ● ● ● ● ● ● 1970 1980 1990 2000 0 50000 100000 150000 1966 to 2004 Thousands Bachelor degrees earned, selected disciplines Figure 2: The comparative setting. NSF Division of Science Resources data. See: h ttp://www.nsf.gov/statistics/nsf07307. Computer Science is the curv e that is highlighted through the succession of large op en dots. Other curv es from top to bottom: Social Sciences; Engineering (noticeably sharing the p eak of the Information So ciet y b oom); Biological Sciences; and Mathematics. Data for the year 1999 was not av ailable, so I linearly interpolated. 8 these authors argue positively . The v ery fact that suc h questions w ere p osed is what is curious. IBM announced its first PC in August, 1981, but the old style of economics sho wed no pro ductivit y gains from the PC b oom of the 1980s. PC sales p eak ed in 1995. F or PCs, accessories and components, “... demand has slo wed sharply . If w e lo ok at nominal order growth for this same industry we see a virtual collapse in orders betw een 1994 and 1997 despite some firming in the ov erall economic gro wth rate.” [37]. The long heralded Information So ciet y was criticized as b eing no where to b e found [16]. This is all v ery curious when lo oked at now in our rear view mirror. The low point for long-term productivity growth had later to b e revised to 1982, as opposed to – 1996! [16]. Both Information So ciety and New Econom y p eriods were not easy to un- derstand for economists. In a muc h quoted remark, in 1987 Nob el Laureate Rob ert Solow said that “we can see the computer age ev erywhere except in the pro ductivit y statistics” (e.g. [18]). A very glo omy view of the computing and telecoms sector w as presen ted in May 1998 b y [37]: “Surveys now indicate that almost 50% of all U.S. households own PCs. The PC is a sophisticated pro duct. Educational levels, ev en literacy , are inadequate for a significant percentage of the U.S. population. It is quite amazing that so high a p ercen tage of all house- holds o wn PCs. Clearly , market saturation, if it is not already here, cannot b e far a wa y .” All one can sa y is, thank go o dness new user interface tec hnology sa ved us all! An asp ect of confusion for commentators on the technology swings has b een the role of services versus manufactured go ods. The problem with the following view of ICT application [3] is clear enough, namely that soft ware and similar go ods are in fact – to an excellent approximation – of zero cost from the second cop y on wards: “in tangible goo ds, such as softw are and other digital information- go ods, whose unit costs of pro duction tend to fall rapidly with gro wth in the v olume of pro duction. ... In this sense one may sa y that the information tec h- nology revolution has b een con tributing to wards main taining the imp ortance of the sector of the US economy in whic h production is characterized b y con- v entional, old-fashioned economies of scale.” So econom y of scale is meant to explain what w as happ ening in an ICT upw elling. I disagree: services, I b elieve, should not b e distinguished from other classes of go ods. Another p erceiv ed problem with understanding go o ds v ersus services is that true prices of services are difficult to fathom. David [3] notes “a substan tial gap b et ween a verage labour productivity gro wth rates in the b etter-measured, commo dit y-pro ducing sector on the one hand, and a collection of ‘hard-to- measure’ service industries, on the other.” Da vid [3] goes some w ay tow ards reconciling how tangible go ods can be influenced b y intangible services. He presen ts “a view of the digital technol- ogy rev olution as a source of efficiency impro vemen ts that gradually hav e b een increasing in magnitude and permeating the economy”. David sees computeri- zation and telecoms as “general purp ose technologies” or as a “general purpose engine”, deploy ed in the framework of more established technologies. He p oints to further progress to b e expected, and as examples mentions (i) digitized and 9 online in tra-company workflo w, (ii) w earable and similar computing platforms; and (iii) tele-working. Ho w ever this p erspective remains anchored in a view that efficiency of traditional mark et sectors is what is imp ortan t, rather than something that is fundamentailly new. My view of this is quite different. W e are not witnessing just a ratcheting up of traditional efficiencies. In fact what I cannot understand is wh y a dividing line is dra wn betw een goo ds and services. When I hear of manufacturing b eing distinguished from services, as economic categories, I am perplexed. A manu- factured go od that do es not p erform a service when used or consumed – that, to my mind, is a contradiction in terms. If a service is purchased and consumed then surely that is immediately and directly a man ufactured go od. Indeed, further evidence of the tangibilit y of services was the economic down- turn triggered b y the US subprime b orro wing sector in the second half of 2007. T o illustrate how this can hav e implications for the ICT sector, consider India’s T ata Consultancy Services (TCS) [15] with 65% of its near US $ 40 billion in rev enues earned from the US. TCS’s US earnings in turn accounted for a ma jor share of its ov erall 30% of reven ues from the banking and financial sector. Ma yb e c hanges of economic categories will come ab out. Industrial and sec- toral categorization sc hemes m ust c hange o ver time. A standard is the NAICS, North American Industry Classification System [34]. The NAICS 2007 and the NAICS 2002 standards in tro duced a go od n umber of c hanges, in particular in the ICT area. Nonetheless there are high lev el categories for: Man ufacturing, Information, Utilities, Professional (i.e. Services), and so on. Links can b e found at [34] also to the North American Pro duct Classification System (NAPCS) for services and separately for man ufacturing. Industrial categorization schemes of these t yp es hav e their use in particular areas. An example of how a differen t sc heme was developed is GICS, Global Industry Classification Standard. It was dev elop ed b y the financial sector (specifically Morgan Stanley Capital Interna- tional and Standard and Poor’s) to allow for a categorization that w as b etter correlated with profitability and rate of gro wth. By distinguishing b et ween a computer and telecom sector, on the one hand, and others with which this sector interfaces, one really has to square lots of circles. Consider the follo wing ICT-related categories, from [14], where for ex- ample the soft ware sector is cut off from its domain of application (not a go o d idea from the softw are engineering viewp oin t of user-centered design). “IT- pro ducing industries – semiconductors, computers, communications equipment, and softw are ... Although three-quarters of U.S. industries ha ve contributed to the acceleration in economic growth, the four IT-pro ducing industries are resp onsible for a quarter of the gro wth resurgence, but only 3 p ercen t of the Gross Domestic Pro duct (GDP). IT-using industries account for another quar- ter of the gro wth resurgence and about the same proportion of the GDP , while non-IT industries with 70 p ercen t of v alue-added are responsible for only half the resurgence. Obviously , the impact of the IT-pro ducing industries is far out of proportion to their relativ ely small size.” Being stuc k in an IT-producing v er- sus IT-using view unfortunately hinders greatly an understanding of the present or the near future. 10 I would propose that “innov ation” has to b e understo od in conjunction with what is at issue, just as softw are is closely tied to its application. Unfortunately w e must often discuss innov ation in the abstract, and similarly the softw are sector in the abstract. I hav e noted that instead it is the technology that has changed fundamentally . A useful supp ortive view is the follo wing. While tec hnological innov ation, tax and deficit policy are in terdep endent, so that, for example, lo wer interest rates from increased sa vings can encourage innov ation as can lo w er tax rates, nev ertheless Mandel [16] concludes that: “In the 1990s, at least, it seems that tec hnology is more p o werful than either taxes or deficits.” It is m y view that this is indeed the case, that any hard and fast distinction b et w een go ods and services is unclear at b est, and that soft w are b elongs to b oth camps. 2.6 The Financial Side of the New Econom y The 1990s New Econom y has b een widely seen as an economic bubble [13]. Tw o examples, among many , of ho w this work ed in practice are as follows. In what then as no w is widely view ed as AOL’s purchase of Time W arner in January 2000, b oth were roughly equally capitalized but there were 12,000-odd employ ees with the former and 67,000-o dd with the latter. Another example of new buying old was in F ebruary 2000 when V o dafone (telecoms, mobile, UK-based) bought out Mannesmann (engineering, German-based). By being massively v alued, new w av e ICT companies were able to buy out traditional, solid corp orations [23]. In this section I prob e the financial mec hanism underlying this and its role in giving suc h strong trump cards to the new tec hnologies. F or Perez [25, 26], b ooms such as the New Economy one are fueled by finan- cial bubbles that are to b e understoo d as “massive processes of credit creation”, “massiv e episo des of credit creation”. P erez [24] colorfully describ es a financial and economic bubble as follows: “a whirlp ool that suc ks in h uge amoun ts of the w orld’s w ealth to reallo cate it in more adv enturous or rec kless hands ... A part of this go es to new industries, an- other to expand the new infrastructure, another to modernize all the established industries, but most of it is mov ed ab out in a frenzy of money-making money , whic h creates asset inflation and provides a gambling atmosphere within an ev er-expanding bubble”. When new technologies that ha ve instigated this ha ve consolidated, a production phase sets in, and is viewed in far more fav orable terms – stable, equitable, just – by Perez. Expressing the foregoing in another w ay , Perez p oin ts to the “techno-economic paradigm” of developmen t at issue here. Developmen t of tec hnology without finance is unthink able. The causal connection b et ween finance and tec hnology is m utually disruptive but sim ultaneously , at a deep level, constructiv e and sym- biotic. P erez [26] describes how: “those radical inno v ative breaks also require b old and risk-loving bankers, because the ‘serious’ ones w ould share the same men tal routines as the heads or managers of the established firms. In fact, the historical recurrence of bursts of ‘wildcat or reckless’ finance in the p eriod of in tense in vestmen t in technological rev olutions s uggests that these phenomena 11 ma y b e causally connected.” One other term used b y P erez strik es a chord, that of “clusters of radical inno v ation”, “Suc h interconnected innov ations in pro ducts and processes, in equipmen t and organization, tec hnical and managerial, form a coherent and m utually enhancing set of technologies and industries, capable of carrying a wa ve of growth in the economy”. F or we can see that in the earlier 1980s Information So ciet y b o om that I discuss here, there w as the p enetration of computerization in to all asp ects of business, the rise of individual computing through the PC, Minitel as a precursor to society-wide net working, and v arious other facets. In the 1990s New Economy b oom there was a great surge in human-computer in terface technology , mobile phone uptake soared, and industrial mergers of new and long-established partners took place, such as b et ween A OL and Time W arner, or V o dafone and Mannesmann. 3 The Changing Nature of the PhD The PhD degree, including the title, the dissertation and the ev aluation frame- w ork as a work of research (the “rite of passage”) came about in the German lands b et ween the 1770s and the 1830s. Clark [1] finds it surprising that it sur- viv ed the disrepute asso ciated with all academic qualifications in the turmoil of the late 18th century . In the United States, the first PhD w as a w arded b y Y ale Univ ersity in 1861. In the UK, the Universit y of London in tro duced the degree b et w een 1857 and 1860. Cam bridge Universit y aw arded the DPhil or PhD from 1882, and Oxford Universit y only from 1917. A quite remark able feature of the mo dern p erio d, p ost Dot-Com or New Econom y b oom, is ho w spectacular the growth of PhD num b ers has now be- come. Figure 3 shows ho w PhDs dropped during the goo d y ears of the Dot-Com econom y p eriod. But now the output trend in regard to PhDs is h ugely differ- en t. In just four years, from 2003 to 2007, PhD output in CS and E in North America has doubled. The T aulb ee surv ey indicates that PhDs are exp ected to decline in the near future but by how muc h and whether then going into a further clim b or a plateau are quite op en issues. In ternationally the evolution illustrated in Figure 3 holds to o. F or example, Ireland is pursuing a doubling of PhD output up to 2013 [4]. Concomitan t with num b ers of PhDs, the very structure of the PhD is chang- ing in many countries outside North America. There is a strong mov ement a wa y from the traditional German “master/apprentice” mo del, tow ards instead a “professional” qualification. This mo ve is seen often as tow ards the US mo del. In Ireland there is a strong mov e to reform the PhD tow ards what is termed a “structured PhD”. This inv olves a change from the apprenticeship model consisting of lone or small groups of students ov er three years in one univ er- sit y departmen t to a new mo del incorp orating elements of the apprenticeship mo del cen tered around groups of studen ts possibly in m ultiple universities where generic and transferable skills (including entrepreneurial) can b e em b edded in education and training ov er four y ears. 12 In Finland a Graduate School system was pursued on the cross-institutional lev el from 1995. Like the Irish case, the aim is for more systematic education and training that is more akin to that for a profession rather than as an appren- ticeship. An aim to o is greater efficiency of advisor resource deploymen t and course provision, ov er a four year timeline [27]. The Engineering Do ctorate in the UK is of similar duration, and professionally oriented [6]. Do ctoral T raining Cen tres in the UK hav e similarities with the Graduate School concept [7]. An analogous situation holds for Graduate Schools in F rance, supp orting a three y ear p ost-Master do ctorate [5]. Unlike in these cases, German y is retaining a traditional “master/appren tice” model [12]. Num b ers of PhDs are dramatically up, and as we hav e seen in man y coun tries there is a ma jor restructuring underwa y of the PhD work conten t and even timeline. In tandem with this, as Figure 4 shows, in North America the ma jority of PhDs now go directly in to industry . This trend goes hand in hand with the mo ve from an apprenticeship for a career in academe to, instead, a professional qualification for a career in business or industry . 4 Conclusion CS and E undergraduate recruitment and PhD pro duction figures are all key data. With v arious examples I ha ve shown that they are also key to our under- standing of a wide range of underlying social and tec hnological trends. Using these key data to study underlying economical and technological changes ough t not b e left to others. After all, we as Computer Scientists and Engineers ha ve a b etter v antage point. The categories w e use are supremely imp ortant. The joint association of computerization and telecoms in the term ICT is just one example. So to o is the multime dia information industry [23], merging telecoms, information tech- nology , entertainmen t, media and consumer electronics. Official statistics lag v ery m uch b ehind this. So facts and figures can mislead. I ha ve noted the con- fused ov erlapping terms “manufacturing” and “services”. An immediate con- clusion is that p olicy makers can pro vide leadership by using forw ard-reaching categorization and prioritization of research themes and directions. Steps in this direction are discussed further in [19]. References [1] W. Clark, A c ademic Charisma and the Origins of the R ese ar ch University , Univ ersity of Chicago Press, 2006. [2] Computing Researc h News Online, V ol. 20, No. 3, CRA, Computing Re- searc h Asso ciation, May 2008, http://www.cra.org/CRN/online.h tml 13 ● ● ● ● ● ● ● ● ● ● ● ● ● ● ● ● ● ● ● ● ● 1990 1995 2000 2005 600 800 1000 1400 1800 Years 1987 to 2007 Number of PhDs PhD production in CS and CE Figure 3: PhD pro duction in North America, in CS and CE. F rom the CRA T aulb ee Surv ey , Ma y 2007. While the gro wth may not con tinue, the increase in n umbers of completing PhDs in CS and CE in the p ost Dot-Com or New Econom y p eriod is little short of stupendous. F or data see [2]. 14 ● ● ● ● ● ● ● ● ● ● ● ● ● ● ● ● ● ● ● ● ● ● ● 1985 1990 1995 2000 2005 35 40 45 50 55 60 1985 to 2007 Percentages by sector ● ● ● ● ● ● ● ● ● ● ● ● ● ● ● ● ● ● ● ● ● ● ● CS, CE PhD employment: academe, industry Figure 4: Employmen t of PhDs pro duced in North America in CS and CE. F rom CRA T aulb ee Surv ey , 2008 data. The curv e with the filled dots represen ts academe, including in CS/CE aw arding institute, other CS/CE institute, or non- CS/CE institute. The curve with the op en circles represents industry , including small percentages for gov ernment and self-employ ed. Those who left North America are not included. F or data see [2]. 15 [3] P . Da vid, “Pro ductivit y gro wth prospects and the new economy in histor- ical p erspective”, EIB Papers (European Inv estment Bank), V ol. 6, No. 1, 2001, pp. 41–61. [4] Department of En terprise, T rade and Employmen t, Ireland, Str at- e gy for Scienc e, T e chnolo gy and Innovation 2006–2013 , 2006. www.en temp.ie/science/technology/sciencestrategy .htm [5] “Do ctorat”, Ministry of National Education, F rance, October 2007, h ttp://www.education.gouv.fr/cid306/do ctorat.h tml [6] EPSRC (Engineering and Ph ysical Sciences Re- searc h Council), UK, Engineering Do ctorates, www.epsrc.ac.uk/P ostgraduateT raining/EngineeringDo ctorates [7] EPSRC (Engineering and Ph ysical Sciences Research Council), UK, EPSR C Cen tres for Do ctoral T raining, www.epsrc.ac.uk/CallsF orProp osals/DTCsOutlines08.h tm [8] ESRI, Economic and So cial Research Institute, “Irish economy”, h ttp://www.esri.ie/irish econom y [9] Exp ert Group on F uture Skills Needs, F utur e Skil ls and R ese ar ch Ne e ds of the International Financial Servic es Industry , F orf´ as, Decem b er 12, 2007, 227 pp. http://www.forfas.ie/publications/sho w/pub285.html [10] G. FitzGerald, “What caused the Celtic Tiger phenomenon?”, Irish Times, 21 July 2007. [11] K. Gardiner, “The Irish economy: a Celtic Tiger”, MS (Morgan Stanley) Euroletter, 31 August 1994. [12] German Academic Exc hange Service (D AAD, Deutscher Ak ademis- c her Austausch Dienst), “P aths to a Do ctorate in Germany”, 2008, h ttp://www.daad.de/deutschland/forsc hung/promotion/04670.en.h tml [13] A. Ghosh, “The IPO phenomenon in the 1990s”, So cial Science Journal, 43, 487–495, 2006. [14] D.W. Jorgensen and C.W. W essner, Eds., Enhancing Pr o ductivity Gr owth in the Information A ge: Me asuring and Sustaining the New Ec onomy , Committee on Measuring and Sustaining the New Econom y , Board on Science, T ec hnology , and Economic Policy , Policy and Global Affairs, Na- tional Research Council of the National Academies, National Academies Press, 2007. [15] V. Kulk arni, “Subprime aftersho c k: lo cal IT cos brace for lo wer tech sp ends. Multi-billion dollar write-offs by financial services firms may hit their 2008 IT budgets, h urting offshoring”, LiveMin t.com, The W all Street Journal, 16 June 2008, www.livemin t.com/2007/11/19002722/Subprime- aftersho c k-lo cal-IT.h tml 16 [16] M.J. Mandel, “Commen tary: Ho w most economists missed the b oat”, BusinessW eek Online, 15 No vem b er 1999, h ttp://www.businessweek.com/1999/99 46/b3655147.h tm [17] A. McIver McHo es and G. McHoes, “Minitel”, Macmillan Science Library: Computer Sciences, www.b o okrags.com/researc h/minitel-csci-01, 2006. [18] C.E. Minehan, L.E. Browne and L. McIn tyre, “Productivity gro wth and the ‘new economy’ ”, 17 pp., in 1999 Ann ual Report, F ederal Reserv e Bank of Boston. [19] F. Murtagh, “The Corresp ondence Analysis platform for unco vering deep structure in data and information”, Sixth Ann ual Bo ole Lecture in Infor- matics, April 2008, Computer Journal, forthcoming, 2008. [20] S. Nora and A. Minc, L’Informatisation de la So ci´ et ´ e , La Do cumen tation fran¸ caise, 1978. [21] S. O Riain, “The birth of a Celtic Tiger”, Comm. ACM, 40 (3), 11-16, 1997. [22] M.R. Pakk o, “The high-tech inv estmen t b o om and economic growth in the 1990s: accounting for qualit y”, Review of F ederal Reserve Bank of St Louis, Marc h 2002, 3-18 [23] J. P ennings, H. v an Kranenburg and J. Hagedo orn, “Past, present and future of the telecommunications industry”, chapter, Gro wth and Dynam- ics of Maturing New Media Companies, No 15, Research Memoranda from Maastric ht: METEOR, Maastrich t Researc h School of Economics of T ech- nology and Organization, 2005. [24] C. Perez, T e chnolo gic al R evolutions and Financial Capital: The Dynamics of Bubbles and Golden A ges , Edw ard Elgar, Cheltenham, UK, 2002. [25] C. P erez, “Resp ecialization and the deploymen t of the ICT paradigm”, rep ort, 37 pp., 2005. [26] C. Perez, “Finance and technical change: a long-term view”, report, 18 pp., 2004. T o app ear in: H. Hanusc h and A. Pyk a, Eds., The Elgar Comp anion to Ne o-Schump eterian Ec onomics , Edw ard Elgar, Cheltenham, 2004. [27] “Researcher training: Finnish Science and T echnology Informa- tion Service”, Ministry of Education, Finland, 13 F ebruary 2008, h ttp://www.research.fi/en/resources/researc her training [28] J. Reimer, “P ersonal Computer Mark et Share: 1975-2004”, h ttp://www.jeremyreimer.com/total share.h tml [29] H. Rheingold, The Virtual Communit y (electronic v ersion), h ttp://www.rheingold.com/vc/bo ok/8.h tml The Virtual Community: Homeste ading on the Ele ctr onic F r ontier , MIT Press, (revised edn.) 2000. 17 [30] Research and Innov ative T echnology Administration, US Department of T ransp ortation, Bureau of T ransp ortation Statistics, “T ransp ortation Statistics Ann ual Report 2001”, 2001. [31] K. Ryan, Engineering the Irish softw are tiger, Computer, 78–83, June 2008. [32] L. Story , “With economy tied to W all St., New Y ork braces for job cuts”, New Y ork Times, March 24, 2008. [33] J. T emple, “The assessmen t: the New Economy”, Oxford Review of Eco- nomic P olicy , 18 (3), 241-264, 2002. [34] US Census Bureau, NAICS, North American Industry Classification Sys- tem, 2002, 2007. http://www.census.go v/ep cd/www/naics.html [35] J. V egso, “Con tinued drop in CS Bachelor’s degree pro duc- tion and enrollments as the n umber of new ma jors stabi- lizes”, Computing Research News, V ol. 19, No. 2, Marc h 2007. h ttp://www.cra.org/CRN/articles/march07/v egso.html [36] J. V egso, “Enrollmen ts and degree pro duction at US CS departmen ts drop further in 2006-07”, Comput- ing Research News, V ol. 20, No. 2, Marc h 2008, h ttp://www.cra.org/CRN/articles/march08/jv egso enrollments.h tml [37] V enoroso Asso ciates, “High tech... the bo om/bust cycle of a gen- eration? Executiv e summary”, 27 May 1998 h ttp://www.gold- eagle.com/gold digest 98/veneroso052798.h tml [38] K. Whitehouse, “Comet explo des on Jupiter – and the web”, Computer Graphics and Applications, 14, 12–13, 1994. 18
Original Paper
Loading high-quality paper...
Comments & Academic Discussion
Loading comments...
Leave a Comment