On the Optimization of the IEEE 802.11 DCF: A Cross-Layer Perspective
This paper is focused on the problem of optimizing the aggregate throughput of the Distributed Coordination Function (DCF) employing the basic access mechanism at the data link layer of IEEE 802.11 protocols. In order to broaden the applicability of …
Authors: Massimiliano Laddomada, Fabio Mesiti
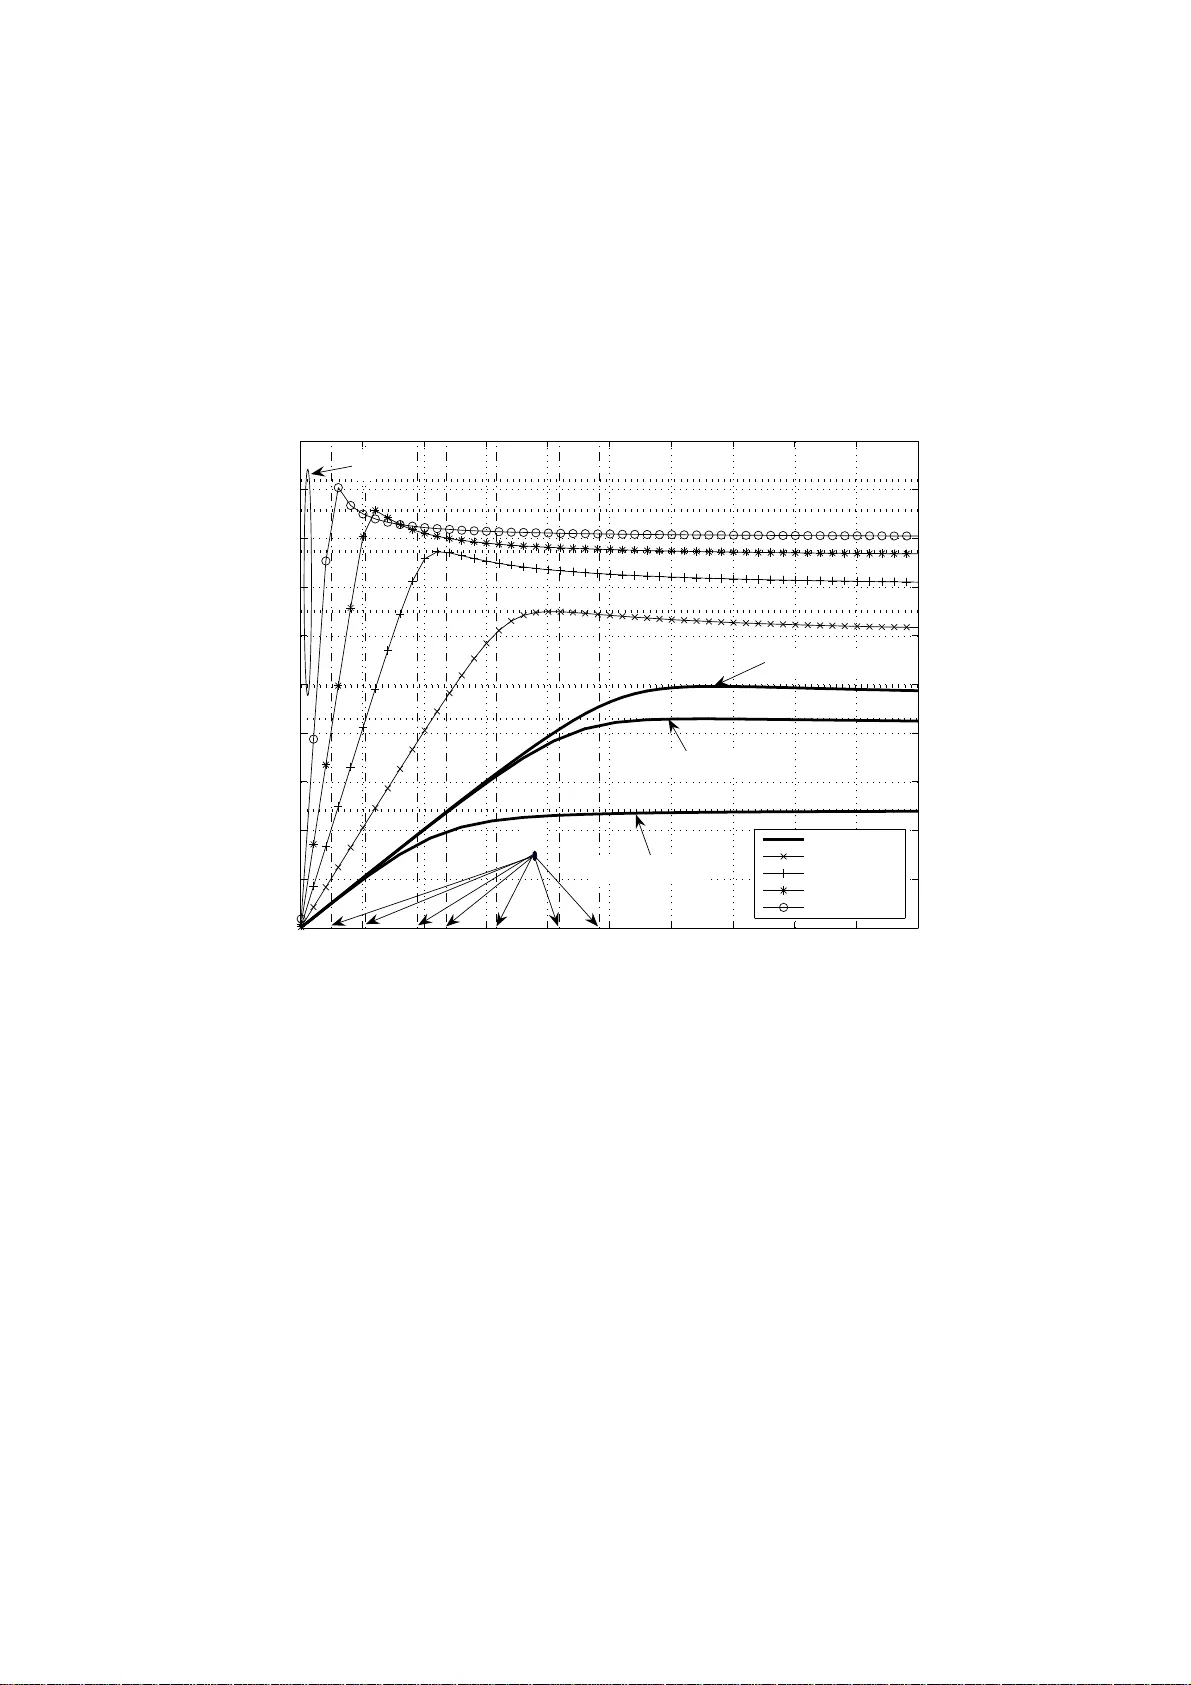
1 On the Optimization of the IEEE 802 .11 DCF: A Cross-Layer Perspecti v e Massimiliano Laddomada and Fabio Mesiti Abstract This paper is fo cused on the prob lem of optimizing the aggregate throughput of the Distributed Coordination Function (DCF) employing the b asic access mechanism at the d ata link lay er of IEEE 80 2.11 pr otocols. In order to broade n the applicability o f th e p roposed a nalysis, we c onsider general operatin g condition s a ccounting for b oth non-satur ated and saturated traffic in the pr esence o f transmission channel error s, as exemplified b y the packet error rate P e . The main clue of this work stems from the relation th at links th e aggregate through put of th e network to the packet r ate λ o f the co ntending stations. I n particular, we sho w that th e aggregate throu ghput S ( λ ) presents tw o clearly distinct operatin g r egions that d epend on the actual value of the p acket rate λ with respe ct to a critical value λ c , theoretically derived in th is work. The b ehavior of S ( λ ) paves the way to a cro ss-layer optimizatio n alg orithm, which proved to be e ffecti ve for maximizing the aggr egate throu ghput in a variety of network oper ating co nditions. A nice con sequence of the propo sed optimization fram ew ork relies on th e fact that the agg regate thro ughpu t can be predicted quite accura tely with a simple, yet ef fective, closed-fo rm expression , wh ich is also derived in th e article. Finally , th eoretical a nd simu lation re sults are p resented throug hout the work in o rder to unv eil, as well as verify , the key ideas. Index T erms Cross-layer, DCF , distributed coordination f unction, IEEE 8 02.11 , MA C, non-saturated, optimization , satur ation, throug hput, unlo aded tr affic, un saturated. Massimiliano L addomada is with the Electrical E ngineering Dept. of T e xas A&M University-T exarkana, email: mladdomada@tamu t.edu. Fabio Mesiti is with DEL EN, Poli tecnico di T o rino, Italy . 2 I . I N T R O D U CT I O N DCF represents t he main access mechanism at the Medium Access Control (MAC ) l ayer [1] of the IEEE802.11 series of standards, and it i s based on Carrier Sense Multipl e Access with Collision A voidance (CSMA/CA). Many papers, following the seminal work by Bianchi [2], ha ve addressed the problem of modeling, as well as optimizin g, the DCF in a variety of traffic load m odels and transm ission channel condition s. Let us provide a surv ey of the recent literature related to th e problem addressed in this paper . Papers [3]-[7] model the influence of real channel condition s on the t hroughput o f the DCF operating in saturated traf fic conditions . Paper [3] in vestigates the saturation throughput of IEEE 802.11 in presence of non ideal transmissio n channel and capture effec ts. The beha vior of the DCF of IEEE 802.11 WLANs in unsaturated traffi c conditi ons has been analyzed in [8]-[13], whereby the authors proposed various bi-dimens ional Markov m odels for unsaturated traffic conditions, extending t he basic bi -dimensional mo del proposed by Bianchi [2]. In [14], the authors look at th e imp act of channel induced errors and of the recei ved Signal-to-Noise ratio (SNR) on the achiev able throughput in a sys tem with rate adaptation, whereby the transmiss ion rate of the terminal is modified depending on either direct, or indirect measurements of the link qualit y . The effect of the contention wi ndow s ize on the performance of th e DCF h as been in ve stigated in [15]- [22] upon a ssuming a v ariety of transmission scenarios. In [15]-[17], the authors addre ssed the optimization of the con tention window in su ch a way as to optimi ze the s aturated throughput of the DCF . As a starti ng point for the d eri vations which follow , we adopt the b i-dimensional model proposed in a companion paper [12] (see also [13]). Briefly , in [12] the authors extended th e saturated Bianchi’ s model by introducing a new idle state, not present in the original Bianchi’ s model, acc ounting for the case in which the station queue is empty . The Mark ov chain of the proposed contention mo del wa s solved for obtaining the stationary probabiliti es, alon g wi th t he probability τ that a s tation st arts transmitting in a randomly chosen time slot. In this paper the focus is d if ferent i n m any respects. Firstly , we i n v estigate the behavior of the aggregate throughput as a function o f the t raf fic load λ of the contending stations, and note that the aggre gate throughput S ( λ ) presents two distinct operating regions identi fied, respectively , by Below Link Capacity 3 (BLC) region and Link Capacity (LC) region. Deriv ed in closed-form in this work, and identified by S m throughout the paper , the li nk capacity of the con sidered scenario corresponds to t he m aximum throughput that the network c an achie ve when the contending stations transmit with a proper set of network parameters. W e show that the network operates in the BLC region when the actual value of the packet rate λ is less than a crit ical va lue λ c , theoretically derived in t his work. The s econd part of this article is focused on th e opti mization o f the DCF throughput. W e p ropose a cross-layer algorit hm whose main aim i s to allow the network to operate as close as poss ible to the link capacity S m . Th e propos ed optimi zation algorithm relies on a number of insig hts deriv ed by t he beha vior of the aggregate t hroughput S ( λ ) as a functi on of the traf fic load λ , and aims at choosing either an appropriate value of t he mi nimum cont ention window W 0 , or a p roper s ize of t he transm itted packets depending on the network operating region. Finally , we deriv e a simple mo del of th e optimized throu ghput, which is us eful for predicting the aggregate through put without resorting to s imulation. The rest of the paper is organized as follows. Section II briefly presents the Marko v m odel at the very basi s of t he proposed optim ization framew ork, whereas Section III in v estigates the behavior o f the aggregate throughput as a functio n of the traf fic load λ . Th e propos ed optimizati on algorithm is discussed in s ection IV. Section V presents simul ation results of the proposed technique applied to a sam ple n etwork scenario, while Section VI draws the conclusi ons. I I . M A R K OV M O D E L I N G The bi-dimensional Markov Process of the contention model proposed in [12], and sh own in Fig. 1 for completeness, governs t he behavior of each con tending st ation thro ugh a series of states indexed by the pair ( i, k ) , ∀ i ∈ [0 , m ] , k ∈ [0 , W i − 1] , whereby i i dentifies the backof f stage. On the other hand, the index k , which belongs to the set [0 , W i − 1] , ident ifies the backof f counter . By th is setup, the size of the i th contentio n window i s W i = 2 i W 0 , ∀ i ∈ [1 , m ] , while W 0 is the mi nimum size of t he contention window . An idle state, identified by I i n Fig. 1, i s introduced i n order to account for th e scenario in which after a successful transm ission there are no packets to be transm itted, as well as for the situation i n whi ch the 4 packet queue is empty and the station is waiting for a ne w packet arriv al. The proposed M arkov model accounts for packet errors due t o imp erfect channel condit ions, by defining an equiv alent probability of failed t ransmission, identified by P eq , which considers the n eed for a new contention due either to packet collisions ( P col ) or to channel errors ( P e ) on the transmitted packets, i.e., P eq = P col + P e − P e · P col (1) It is ass umed that at each transmi ssion attempt each station encounters a cons tant and i ndependent probability of failed transm ission, i ndependently from the number of retransm issions already suffered. The st ationary solut ion of t he Markov Model in Fig. 1 is employed to com pute τ , th e probabil ity that a station starts a transmission in a rando mly chosen time sl ot. First o f all, observe that a packet transmission takes pl ace when a station g oes in one of the states b i, 0 , ∀ i ∈ { 0 , m } . Therefore, the probabi lity τ can be e valuated by adding up t he prob abilities b i, 0 over the s et i ∈ { 0 , . . . , m } . U pon i mposing th e normalization condition 1 on the Markov model in Fig. 1, and expressing the probabilit ies b i,k , ∀ k ∈ { 1 , . . . , W i − 1 } , as a function of the probabil ities b i, 0 , the probability τ can be rewritten as follows: τ = 2(1 − 2 P eq ) q q [( W 0 +1)(1 − 2 P eq )+ W 0 P eq (1 − (2 P eq ) m )]+2(1 − q )(1 − P eq )(1 − 2 P eq ) (2) As in Bianchi’ s work [2], we ass ume that: 1) th e probability τ is constant across all time slots; 2) the probability P col is constant and independent of the number of colli sions already suffered. Giv en τ , t he probability of colli sion P col , can be defined as fol lows: P col = 1 − ( 1 − τ ) N − 1 (3) Finally , the term q in (2) is the prob ability of having at least one packet waiting for transmis sion in t he station queue after an aver age slot d uration. Let u s sp end few words on the e v aluation of q . Upon assuming that the packet interarriv al t imes are exponentially dis tributed wi th m ean 2 1 /λ , the probabi lity q can be well approxim ated by the follo wing 1 The probabilities b i,k must add up to 1 ∀ k ∈ { 1 , . . . , W i − 1 } , and ∀ i ∈ { 0 , m } . 2 λ , which is measured in pk t/s , represents the rate at which the packets arriv e into the station queue from the upper layers. 5 relation in a scenario where t he contending station s employ queues of sm all si zes [9]: q = 1 − e − λE [ S ts ] ≈ λ · E [ S ts ] | λ ≈ 0 E [ S ts ] = (1 − P t ) σ + P t (1 − P s ) T c + + P t P s (1 − P e ) T s + P t P s P e T e (4) where E [ S ts ] , t he expec ted ti me per slot , is u seful t o relate the states of t he Markov chain to the actual time s pent in each s tate. As a note aside, not ice that e − λE [ S ts ] in (4) corresponds to the probabi lity that zero packets are receiv ed from t he upper layers when the packet in terarri val times are exponentially distributed. The oth er terms in volv ed in E [ S ts ] are defined as follows [2], [12]. σ is the du ration of an empty tim e slot; P t is the p robability t hat there is at least one transmissi on in the considered time slot, w ith N st ations contending for th e channel, each trans mitting with probabil ity τ ; P s is the conditional prob ability that a packet transm ission occurring on the channel i s successful; T c , T e and T s are, re spectively , the avera ge times a channel is s ensed busy due to a collision, th e transmissi on tim e duri ng w hich the d ata frame is af fected by chann el errors, and the av erage time of s uccessful data frame transm ission. I I I . T H RO U G H P U T A N A L Y S I S The com putation of the normalized syst em throughpu t relies on the numerical solution of the nonlinear system o btained by jointly sol ving (1) and (2). The soluti on o f the system, which corresponds to the values of τ and P eq , i s used for the computati on of the n ormalized syst em t hroughput, i.e., the fraction of the t ime during which th e channel is u sed to successfull y transm it payload bits: S = P t · P s · (1 − P e ) E [ P L ] /E [ S ts ] (5) whereby E [ P L ] i s the aver age packet payload lengt h, and P t · P s can be rewritten as [2]: P t · P s = N τ (1 − τ ) N − 1 (6) In order to g ain insights on the behavior of the aggregate throughput S , let us in vestigate the theoretical beha vior of (5) as a function of t he packet rate λ for two diffe rent values of t he packet error probabili ty P e , and mini mum contention window W 0 = 32 , in a scenario with N = 10 cont ending stations transmit ting at the bit rate 1 Mbps. 6 The two rightmos t su bplots of Fig. 2 show the theoreti cal behavior of the throughput in (5), as well as simulatio n results obtained with NS2 by employing the typical MA C layer parameters for IEEE 802.11b giv en in T able I [1]. Other parameters are noticed in th e label o f t he figure. Let us spend a few words about the sim ulation setup i n ns-2. In order to account for imperfect channel transmi ssions, t he channel model is implement ed using the suggestio ns proposed in [23], where the outcom es of a binary , equiprobable random variable are used t o establish whether each packet is rece iv ed erroneously . In other words, the random var iable is equal to 1 with p robability P e (erroneous transmission), and 0 with probability 1 − P e . W e notice in passing that the th eoretical model developed is independent on the s pecific propagation channel. T he onl y parameter needed is P e , wh ich can be appropriatel y linked to the specific wireless propagation channel u pon specifying a threshold of th e signal-t o-noise ratio allowing perfect reception at the receiv er [24]. W e adopted the patch NO AH ( NO Ad-Ho c ), ava ilable on the authors’ website 3 , for emulating a wireless network in infrastructure m ode. The emp loyed traf fic model is implemented b y generating an exponenti ally distributed random v ariable with expected value 1 /λ , i n accordance to the theoretical mo del dev eloped in Section II. Let us focus on the curves not iced in the two rightmos t subplots in Fig. 2. Basically , there are two diffe rent operating regions of the throughput in (5). As λ → 0 + , i.e., all the contend ing stations approach unloaded traffi c conditi ons, the throughput can be approximated as a straight line passi ng through t he point ( S, λ ) = (0 , 0) : S ( λ ) = N · E [ P L ] · λ (7) This relation follows from the theoretical thro ughput noti ced i n (5) upon approximatin g the probabilit ies P t and P s in the li mit λ → 0 + . Indeed, as λ → 0 + , the first relation in (4) yields q ≈ λ · E [ S ts ] , whereas the probability τ in (2) can be well approximat ed by τ ≈ q / (1 − P eq ) . Since P col → 0 as λ → 0 + (because τ → 0 ), it is P eq → P e . Furthermore, as λ → 0 + , (6) can be approximated by the following relation: P t · P s ≈ N τ = N q 1 − P e (8) 3 See http://icapeople.epfl.ch/widmer/uwb/ns-2/noah / 7 Upon sub stituting (8) in (5), the theoretical th roughput can be well approx imated as follows: S ( λ ) | λ ≈ 0 + = P t · P s · (1 − P e ) E [ P L ] E [ S ts ] ≈ N E [ P L ] q E [ S ts ] ≈ N · E [ P L ] · λ (9) This linear mo del i s d epicted in the subplots of Fig. 2 overimposed t o b oth theoretical and simulated results. The key observation from this result i s that the aggregate throughput produ ced by N s tations approaching unloaded t raf fic conditions, is onl y dependent on the number of stati ons, as well as on the packet size. No other network parameters affect the aggregate t hroughput in thi s operating region. Moreover , the results depi cted in Fig. 2 denote that the deriv ed lin ear model is valid up to a critical value of λ (identified b y λ c throughout the paper), above which the aggre gate throughput n o longer i ncreases linearly wit h λ . W e note in p assing that , given λ c , t here is no n eed to simul ate the network t o obtain the agg regate throug hput: i t is v ery well approximated b y the theoretical relation derived in (9) for any λ ∈ [0 , λ c ] . Once again , let u s focus on the results shown in the rightmost subplots of Fig. 2. The aggregate throughput gets to a maxim um at a pro per value of λ , above which the ef fect of the collisions among the statio ns, as well as the propagati on channel , let t he throughput reach a horizontal asym ptote. The maximum value of S ( λ ) o ver the whole range of values of λ t urns to be quite useful for throughput optimizatio n. Obtained by Bianchi [2] under the hypothesis of satu rated network, and considering only collisions among t he stations, in our more general model such a maxim um can be estimated in two steps. First, rewrite the through put in (5) as a function of τ by using the relation s th at define P t and P s in terms of th e probabil ity τ . Then, equate to zero t he deriva tive of the throughput in (5) wit h respect to τ , and obtain a s olution i dentified by τ m . By doing s o, th e value of τ for which t he throughput get s maxi mized is easily o btained: τ m = σ − p σ [ N σ − 2 ( N − 1 )( σ − T c )] / N ( N − 1)( σ − T c ) (10) Finally , e valuate the throughp ut i n (5) o n the solution τ m noticed in (10). Upon foll owing these steps, the maximum throughpu t takes on t he following form S ( τ m ) = S m = E [ P L ] h T s − T c 1 − P e + T e P e 1 − P e i + ( σ − T c )(1 − τ m ) N + T c N τ m (1 − τ m ) N − 1 (1 − P e ) (11) 8 The critical value of λ acts as a transition threshold between two o perating re gions. In the fir st region, i.e., for λ ∈ [0 , λ c ] , t he transm issions are affected by relati vely small equi valent error probabilities, P eq . In this op erating region 4 , collisi ons among stati ons occur rarely ( P col is small) because of the reduced traf fic load of t he contending stati ons, and the station s experience go od channel quality ( P e is very small). For any λ ≤ λ c , the n etwork is not congest ed, and the N contending stations are able to t ransmit data below the link capacity lim it denoted by S m . This is the reason for which the aggregate th roughput grows linearly with the traffi c load λ . On th e o ther hand, the aggregate throughp ut tends to be upperbounded by S m in (11) for λ ≥ λ c . The reason i s simp le: the aggregate throughput in this region 5 is affected either by th e increasingl y ef fects of the coll isions among t he stations, or by worse channel condi tions as e xemplified by P e ≫ 0 . Further insights on t his st atement can be gained by the results discussed below in con nection wit h t he curves shown in Fig. 4. The criti cal value of λ can be found as th e absciss a where the linear model of the throug hput in (7) equates to S m in (11): λ c = h N T s − T c 1 − P e + T e P e 1 − P e + ( σ − T c )(1 − τ m ) N + T c τ m (1 − τ m ) N − 1 (1 − P e ) i − 1 (12) The procedure for obtaining λ c , is clearly highlight ed in all the four su bplots of Fig. 2. Let us inv estigate th e b eha vior of the critical value λ c in (12) against some key n etwork parameters. Fig. 3 shows the beha vior of λ c as a function of the p acket size E [ P L ] , for t wo different values of N as noti ced in t he respective legends. Some observations are in order . λ c decreases for longer packet sizes E [ P L ] , as well as for in creasing number of contending statio ns, N . The reason relies on the fact that for increasing p acket sizes, each station t ends to occupy the channel longer . Such a beha vior is clearly emphasized in Fig. 4, where the aggregate throughput for a s ample scenario com prising 10 contendi ng stations transm itting wi th the packet sizes not iced in the legend, is considered. As long as t he packet size increases, the aggregate throu ghput shows an increasing slo pe in the linear region characterized by traffic loads λ ∈ [0 , λ c ] , as suggested by the theoretical model i n (9). Mo reov er , the value of λ c tends to decrease b ecause each station tends to occupy the channel longer . The three 4 In what follows, this operating region will be identified by the acronym BLC, short f or Below L ink Capacity region. 5 In what follows, this operating region will be identified by the acronym LC, short for Link Capacity region. 9 lower thick curves, labeled by P L = 1 28 bytes, are associated to three differe nt v alues of packet err or probabilities, P e . Note that the value of λ c decreases for increasing values o f P e , thus reducin g th e re gion characterized by small equi valent error probabilities. As long as P e → 1 , both λ c and S m tend to zero, making the aggregate through put vanishingly small. Similar considerations may b e deri ved from the beha vior of λ c versus N noticed in Fig. 5. Roughly speaking, for fixed v alues of the packet size, λ c tends to reduce by a half as far as the number of contending stations N doubles. The reason relies on the fact that the probabili ty of col lision increases as long as more stati ons try to contend for the channel. I V . T H RO U G H P U T O PT I M I Z A T I O N The considerations deduced in Section III are at the very basis of an optimization strategy for maximizing the aggregate throughput of t he network depending o n t he traf fic load λ . T o this end , we define two optimizatio n strategies: Content ion W indow Opti mization and MAC P ayload Size Optimi zation . The first strategy i s applied when the cont ending stations operate in the LC region, approaching the link capacity S m , whereas the second one is u sed for opt imizing t he aggre gate t hroughput when the stations operate within the BLC region. The next two subsection s address separately the two optim ization strategies, while Section V presents the opti mization algorit hm jointl y im plementing t he two strategies. A. Link Capacity r e gi on: Contention W indow Optimizati on The first o ptimization strategy proved to be ef fecti ve for im proving the aggregate throu ghput in the LC region, i.e., for λ > λ c . The key idea here i s to force t he contending stations to transmit with a probabil ity τ equal t o th e one that m aximizes the aggre gate throughpu t S ( λ ) . In this respect, the probability τ m in (10) plays a key role. Upon consi dering saturated condit ions, i.e., impos ing q → 1 in (2), the probabili ty τ can be rewritten as: τ = 2(1 − 2 P eq ) ( W 0 +1)(1 − 2 P eq )+ W 0 P eq (1 − (2 P eq ) m ) (13) 10 By substi tuting τ = τ m in (3), P eq can be rewritten as: P eq = 1 − (1 − τ m ) N − 1 + P e − P e [1 − (1 − τ m ) N − 1 ] = 1 + ( P e − 1)(1 − τ m ) N − 1 = 1 − X ( P e , τ m ) (14) whereby X ( P e , τ m ) = (1 − P e )(1 − τ m ) N − 1 . Finally , by equating (13) to τ m in (10) , and solvin g for W 0 , we obtain the optimal min imum contentio n window size in terms of t he key network parameters: W O P = 1 − 2 τ − 1 m + X ( P e ,τ m ) ( 4 τ − 1 m − 2 ) 2 X ( P e ,τ m ) − 1+(1 − X ( P e ,τ m ))[1 − 2 m (1 − X ( P e ,τ m )) m ] (15) This relation yields the value of the minimum cont ention window W 0 that maximizes the aggregate throughput when the num ber of contending stations N , the packet error rate over the channel P e , and the number of backoff stages m , are given. As a note aside, notice that, u sing W O P , the maxi mum throughput equates to the link capacity S m in (11). Moreover , we no tice that for m = 0 , i.e., no exponential backof f is employed, W O P in (15) can be simplified as follows: W O P = 2 τ m − 1 Considering τ m as a function of N , and neglecting the multiplicative constant terms, it is simple to notice that τ m in (10) go es roughly as 1 / N when N ≫ 1 . Therefore, the opt imal contention window W O P grows linearly wit h the number of contending stati ons N (when N ≫ 1 ) in order to mitigate the eff ects of the collisions due t o an increasing num ber of contendi ng st ations in the network. In th e following, we present simul ation results accomplished i n NS-2 for v alidating the theoreti cal m od- els, as well as the result s presented in thi s section. The adop ted MA C layer parameters for IEEE802.11b are sum marized in T able I [1]. The m ain si mulation result s are presented i n Figs . 2 and 6 i n connection to t he s et of parameters noticed in the respective labels. Some observa tions are in order . Let us focus on the results s hown in Fig. 2. A quick comparis on amo ng the l eftmost and the rightm ost subplots of Fig. 2 re ve als that the choice W 0 = W O P in (15) guarantees improved performance for any λ > λ c , thus making the aggregate throughput equal S m . Throughput penalties due to the use of an subopt imal W 0 , are in th e order of 1 00 kbps. 11 Notice also th at the value of λ c is independent from the minim um contention window chosen. The key observation from the subplots of Fig. 2 concerns the fact that the aggregate throu ghput of th e optimized network can be modeled as fol lows: S ( λ ) | W O P = N · E [ P L ] · λ, λ ≤ λ c S m , λ > λ c As emphasized by the curves in Fig. 2, this model shows a very good agreement with both theoretical and simul ation resul ts. Once again, notice that the aggregate throughput may be predicted quite accurately without resortin g to simulati on. Let us focus on the results shown in Fig. 6, where the saturation throug hput represented by continuous curves, is deriv ed as a function of the minimum cont ention wi ndow size W 0 . The curves are p arameterized with respect to the th ree d if ferent v alues of P e noticed in the legend. The simulated scenario considers N = 10 con tending stations transmi tting packets of size E [ P L ] = 10 24 bytes. Shown in t he same figure is the th eoretical throughput in (5) represented by dashed curves. The saturation t hroughput in each s imulated scenario reaches a maximum corresponding t o the absciss as W 0 = W O P predicted by (15) and noticed beside each maxim um. W e notice that W O P tends to be qui te insensitive from t he packet error rate P e , whose main effect corresponds to a reduction of the maximum achie vable throughp ut. B. Below Link Capacity r e gion: P ayload Si ze Optimizati on The analysis of t he aggregate throughpu t in Section III revea led t he basic fact t hat for traf fic loads λ less than λ c , the network is not congest ed, and each st ation achie ves a throughput roughl y equal to E [ P L ] · λ (the aggregate throu ghput is thus S ( λ ) = N · E [ P L ] · λ ). W e note in passing that the t hroughput does not depend on t he minim um contention window W 0 in the LC region. Therefore, given N contendi ng stations, the throughp ut can only be improved by increasing the payload size E [ P L ] when t he traffic load satisfies the relation λ ≤ λ c . Before proceeding any furth er , let us discuss two im portant issues in connection with the choice of the packet size E [ P L ] . 12 As long as the erroneous bi ts are independently and identically d istributed over the received packet 6 , the packet error probabil ity P e can be ev aluated as P e = 1 − [1 − P e ( P LC P )] · [1 − P e ( D AT A )] (16) where, P e ( P LC P ) = 1 − [1 − P b ( B P S K )] P H Y h , (17) and P e ( D AT A ) = 1 − (1 − P b ) M AC h + E [ P L ] (18) In the pre vious relations, M AC h and P H Y h are, respecti vely , the sizes (in bit s) of the MA C and PLCP 7 headers, and E [ P L ] is the si ze of the data payload in bits. Equ. (18) accounts for the fact th at a packet containing the useful data, is considered erroneous when at least one bit is erroneously recei ved. Relation (16) is obtai ned by noting that a packet is recei ved erroneously when the errors occur either in the PLCP part of t he packet, or in t he information data. W e not ice that the relations (16) th rough (18) are valid either with the use o f con v olutional coding, whereby the bit error rate p erformance does not depend on the code block s ize [24], or for protocols that do not em ploy chann el encoding at the physical layer . From (18) it is q uite e vident that the higher the payload size, the higher the pack et error rate; and vicev ersa. As a note aside, we notice that this behavior does no t hold when concatenated con v olutional channel codes [25]-[27], as well as low-density parity-check codes, are employed as channel codes. Indeed, for these codes the packet error rate depends on the size of th e encoded block of data, wit h longer packets having small er p robability of error compared to sh orter packets. The second issue to be cons idered during th e choice of E [ P L ] is related to the critical value λ c , which depends on t he packet error probability ( P e defined in (16)), and consequently on th e payload size. Given a traf fic load λ , any change in E [ P L ] could affec t the network operating region, wh ich might move from the BLC region to the LC region. 6 W e notice that wireless transceiv ers make use of interleaving in order to break the correlation due to the f requenc y selectiv ity of the transmission channel [ 24]. 7 PLCP is short for Physical Layer Con ver gence P rotocol. 13 Let us discuss a simple scenario in order to revea l this issue 8 . Consider a network (identified in the following as scenario A) where N = 10 contending stations wi th t raf fic l oad λ = 8 pkt/s transmit packets of size E [ P L ] = 1024 byt es. Assume that the bit error probability due t o the channel conditions is P b = 10 − 5 , wh ich correspond s t o a packet error rate P e = 8 . 248 · 10 − 2 (from (16)). Upon using t he network parameters summarized i n T able I, the critical load in (12) correspond s to λ c = 9 . 61 pkt/s. Since λ < λ c , the net work is in the BLC operating region. If the s tations increase the payl oad size up to E [ P L ] = 2048 bytes, the packe t error rate increases to the value P e = 1 . 5 46 · 10 − 1 , wit h t he side ef fect of decreasing λ c to 4 . 71 pkt/s. Therefore, for t he given traffic load λ = 8 pk t/s, the network starts operating into the L C region. Based on the considerations dedu ced in the scenario A, the propo sed op timization techniq ue aims to optimize the payload size in two consecuti ve steps. In the first st ep, we find the size of the p ayload i n such a way that the critical threshold λ c equals the actual traffic load λ , in order for the network not to operate beyond the BLC region. The second step verifies whether the packet error rate associated to t his payload size, is belo w a predefined PER-target (identi fied by PER t ), which d efines th e maximum error le vel im posed by th e application layer . First of all, given an estimated bi t error probability at the physical layer , s olve (18) for E [ P L ] . Then, solve (16) for 1 − P e ( D AT A ) , and substit ute the relation in pl ace of 1 − P e ( D AT A ) . Considering P e = PER t , the following maximum payload size fol lows: E [ P L ] max | P E R t = & ln( 1 − P E R t 1 − P e ( P LC P ) ) ln(1 − P b ) − M AC h ' (19) whereby ⌈·⌉ is the ceil of the enclosed number . Let us consider again the scenario A di scussed previously with the appli cation of this algorithm . Consider 10 stat ions t ransmitting packets of s ize E [ P L ] = 1024 bytes at the traffi c load λ = 5 pkt/s . Assume that the bit error rate imposed by the s pecific channel conditions is P b = 10 − 5 , yielding P e = 8 . 248 · 10 − 2 and λ c = 9 . 6 pkt/s . Moreover , assume a t ar get PER equal to 9 PER t = 8 · 1 0 − 2 . Since λ < λ c , after t he first step, th e algorithm selects the optimal size E [ P L ] ∗ 1 = 1938 byt es, which 8 Where not otherwise specified, we employ the network parameters summarized in T able I. 9 This is the maximum PE R specified in t he IE EE 802.11b standard [1 ], guaranteed at the receiv er when the receiv ed power reaches the recei ver sensitivity . 14 moves the working point near the link capacity and leads to the actual packet error rate P e = 1 . 4 7 · 10 − 1 . Since the constraint P e ≤ PER t is not satisfied, the proposed m ethod estimates the size E [ P L ] i n order to attain the PER t constraint. Th e pack et size becomes e ventually E [ P L ] ∗ 2 = 99 1 bytes (from (19)), yielding a packe t error rate P e ≃ 8 · 10 − 2 and a λ ∗ c = 9 . 92 pkt/s, thus lea ving the working poi nt in the BLC region. Finally , the opt imal payload size is: E [ P L ] = min { E [ P L ] ∗ 1 , E [ P L ] ∗ 2 , P L max } = E [ P L ] ∗ 2 where P L max = 23 12 bytes is the maximum packet size imposed by the standard [1]. Simulation resul ts o f a sam ple network employing the algorith m described above, are presented in the next s ection, along with a sampl e code fragment summarizing the key steps of the optimization technique. V . S I M U L A T I O N R E S U L T S In this section, we present sim ulation resul ts for a network of N = 10 contending stati ons, em ploying the opti mization strategies described in Section IV. The basic steps of the proposed optimization algorithm are summ arized in T able VI. Let us spend a few words about the implementation of the proposed algorithm in a WLAN setti ng employing the infrastructure mode, wh ere an Access Point (AP) moni tors t he transmis sions of N contending stations. The e v aluation o f the critical value λ c in (12) re quires the estimation of three ke y parameters of the network: the nu mber of cont ending stations N , the packet error rate P e , and t he value of the o ptimal τ m , which depends on N . Each station can estim ate the numb er of contending stations by resorting to o ne of the algorithm s propos ed in [28]-[30]. On the other hand, the packet error probability P e , may be ev aluated through (16), once the bit error probabil ity P b at the physi cal layer is estimated. W e recall that P b can be estimated by employing p roper t raining sequences at the physical layer of the wireless recei ver [24]. Finally , the value of the opti mal W O P can be ev aluated by each stati on with the parameters N and P e . A simi lar reasoning applies for th e estimatio n of the optimal packet size. W e have realized a C++ sim ulator i mplementing all the basic directive s of t he IEEE 802.11b protocol with the 2-way hands haking mechanism, nam ely exponential backoff, waiting times, post-backof f, and so on. In o ur si mulator , the opt imization algorithm is dy namically executed for an y s pecified scenario. For the s ake of analyzing the ef fects o f the optimization, the in stantaneous network throughp ut is ev aluated 15 over the whole simulation. The aggregate throughputs obtained in the in vestigated scenarios are shown in Fig. 7. In the first scenario, we considered a congested network in whi ch 10 station s transmit packet of fixed size 1028 bytes at the packet load λ = 1000 pkt/s and bit rate 1 Mbps. Ot her parameters are W 0 = 32 , and m = 5 , whereas the channel condi tions are ass umed to be ideal. As shown in Fig. 7 (curve labeled LC region with asterisk-marked poi nts), t he aggregate throughpu t is about 7 . 6 × 10 5 bps. After 40 s, 5 out of the 10 stat ions turn t heir traffi c off. Between 40s and 80s , the aggregate through put increases to abo ut 8 . 2 × 10 5 bps because o f the reduced effect o f the collisions among the con tending st ations. After 80 s, the 5 stations turn on again and the aggregate throughput decreases t o 7 . 6 × 10 5 bps. Consider again the same scenario over a time interval of 120 s, whereby the contend ing stations adop t the optimal contention window . Upon using (15), the optimal contention wi ndow i s W 0 − 40 O P = 27 5 when 10 stati ons transmit over the network, and W 40 − 80 O P = 130 during the interval in which on ly 5 stations contend for the channel. The aggregate throug hput in t he optimi zed scenario is about 8 . 6 × 10 5 bps, as noticed by the star- marked curve in the same figure. W e not ice that the optimized throughput is quite constant ov er the whole sim ulation independently on t he number of contending s tations in the network, approaching the theoretical maximum t hroughput S m = 8 . 6 × 10 5 bps obt ained from (11). M oreove r , notice that th e two curves S m related to both N = 5 and 10 are almost sup erimposed. Consider anot her scenario differing from the pre vious one in that t he contendi ng station s operate in t he BLC re gion. As abo ve, 10 stations contend for t he channel in the time interv als [0 , 40] s and [80 , 120] s , while during the tim e int erv al [40 , 80] s 5 out of the 10 station s turn of f. The traffic load i s λ = 8 pkt/s , and the packet inter-a rriv al times are exponenti ally di stributed. Let us focus on the aggregate t hroughput d epicted in Fig. 7. The curves related t o th e scenario at hand are identified by the labels λ = 8 pkt/s. As a result of the application of the proposed algorithm to the choice of the packet size, we obtain E [ P L ] 0 − 40 opt = 1383 bytes for the ca se when 10 stations are transmittin g, and E [ P L ] 40 − 80 opt = 2312 bytes in t he other scenario wi th 5 active station s. Simulation results s how that the proposed algorit hm guarantees improved through put performance on the order of 16 0 kbps when 1 0 stations are active , and about 400 kb ps when only 5 stations contend for 16 the channel. W e notice in passi ng t hat, desp ite t he opti mization, t he aggregate t hroughput coul d not reach the maxim um S m because of t he low traffic lo ad. Indeed, the capacity li nk S m could be achiev ed by using a packet size lon ger t han either t he one impos ed by the st andard [1], and th e value obtained from (19). For the sake to verify th at the optim ization of the minim um contention win dow does not affec t the aggregate t hroughput in the B LC region, Fig. 7 also sho ws t he aggre gate throughput obtained by si mulation using a minimu m contention window equ al to W O P . Noti ce that the related curve is superimposed to th e one related to the scenario in which the contendi ng stations employ the min imum contenti on window W 0 = 32 suggested by the standard [1]. V I . C O N CL U S I O N S This paper proposed an optimi zation framework for m aximizing th e throughput of the Distributed Coordination Function (DCF ) basic access mechanism at the data link layer of IEEE 80 2.11 protocols. Based on the th eoretical deri v ations, as well as on simulation results, a si mple model of the optimi zed DCF throughput has been derived. Such a mo del t urns to be quite useful for predicting the aggregate throughput of the DCF in a variety of network con ditions. For throughpu t model ing, we considered general operating cond itions accounti ng for both non-saturated and saturated traffi c in the p resence of transmission channel errors identified b y the packet error rate P e . Simulation results closely matched the theoretical deriv ations, confirming the effe ctiv eness of both the proposed DCF m odel and the cross-layer optimizatio n algorit hm. R E F E R E N C E S [1] IEEE Standar d for W ir eless LAN Medium Access Contr ol (MAC) and Physical L ayer (P HY) Specifications , Novemb er 1997, P802.11 [2] G. Bianchi, ”Performance analysis of the IE EE 802.11 distributed coordination function”, IE EE JSAC , V ol.18, No.3, March 2000. [3] F . Daneshgaran, M. Laddomada, F . Mesiti, M. Mondin, and M. Zanolo, “S aturation throughput analysis of IEEE 802.11 in presence of non ideal transmission channel and capture effects, ” to appear on IEEE T rans. on Communications, July 2008. [4] Q. Ni , T . Li, T . T urletti, and Y . Xiao, “Saturation throughput analysis of error-prone 802.11 wireless networks”, W ile y J ournal of W ir eless Communications and Mobile Computing , V ol. 5, No. 8, pp. 945-956, Dec. 2005 . [5] P . Chatzimisios, A.C. Boucouva las, and V . V itsas, “Influence of channel BER on IEEE 802.11 DCF ”, IEE Electr onics Letters , V ol.39, No.23, pp.1687-16 89, Nov . 2003. [6] Y . Zheng, K. Lu, D. W u, and Y . Fang, “Performance analysis of IEEE 802.11 DCF in imperfect channels, ” IEEE Transa ctions on V ehicular T ech nology , V ol. 55, No. 5, pp. 1648-1656 , Sept. 2006. 17 [7] H.C. Lee, “Impact of bit errors on the DCF throughpu t in wireless LAN over ricean fading channels”, In Proc. of IEEE ICDT ’06 , 2006. [8] L. Y ong Shyang, A. Dadej, and A. Jayasuriya, ”Performance analysis of IEEE 802.11 DCF under limited load”, In Pro c. of A sia-P acific Confer ence on Communications , V ol.1, pp.759 - 763, 03-05 Oct. 2005. [9] D. Malone, K. Duffy , and D.J. Leith, ”Modeling the 802.11 distributed co ordination function in non-saturated heterogeneous conditions”, IEEE-ACM T ran s. on N etworking , vol. 15, No. 1, pp. 159-172, F eb . 2007. [10] F . Daneshgaran, M. L addomada, F . Mesiti, and M. Mondin, “On the linear behav iour of the throughput of IEEE 802.11 DCF in non-saturated conditions”, IEEE Communications Lett ers , V ol. 11, No. 11, pp. 856-858, Nov . 2007. [11] G. R. Cantieni, Q. Ni, C. Barakat, and T . T urletti, “Performance analysis under finite load and improv ements for multir ate 802.11 , ” Computer Communication s, E lsev ier , vol.28, No.10, pp.1095 -1109, June 2005. [12] F . Daneshgaran, M. Laddomada, F . Mesiti, and M. Mondin, “Unsaturated t hroughp ut analysis of IEE E 802.11 in presence of non ideal transmission channel and capture effects, ” IEEE T rans. on W ireless Communications, V ol. 7, No. 4, pp. 1276-1286, A pril 2008. [13] F . Daneshgaran, M. Laddomada, F . Mesiti, and M. Mondin, “ A model of t he I EEE 802.11 DCF in presence of non ideal transmission channel and capture effects, ” In Proc. of IEEE Globecom 07, W ashington DC, November 2007. [14] D. Qiao, S. Choi, and K.G. Shin, “Goodput analysis and link adaptation for IEEE 802.11a wireless LANs”, IEEE T r ans. On Mobile Computing , V ol.1, No.4, Oct.-Dec. 2002 . [15] F . Cali, M. Conti, and E. Gregori, ”Dynamic tuning of the 802.11 protocol to achiev e a theoretical throughput limit”, IE EE T rans. on Networking , vol. 8, pp. 785799, Dec. 2000. [16] A. Khalaj, N. Y azdani, and M. Rahgozar , ”The effect of decreasing CW size on performance in IEEE 802.11 D CF”, Pr oc. of IE EE ICCN , vol. 1, pp. 521525, Nov . 2005. [17] A. Khalaj, N . Y azdani, and M. Rahgozar , “Effect of the contention windo w size on performance and fairness of the IE EE 802.11 standard”, W ir eless P er sonal Comm., V ol. 43, No. 4, pp. 1267-1278, Dec. 2007. [18] S . Choudhury and J. D. Gibson, “Throughput optimization for wi reless LANs in the presence of pack et error rate constraints”, IEEE Communications Letters, V ol.12, N o.1, pp.11-13, January 2008. [19] H. Anouar and C. Bonnet, “Optimal constant-windo w back of f scheme for I EEE 802.11 DCF in single-hop wireless networks under finite load conditions”, W i r eless P er sonal Comm., V ol. 43, No. 4, pp. 1583-1 602, Dec. 2007. [20] Y . Peng, SD Cheng, and JL Chen, “RSAD: A robust distributed contention-based adaptiv e mechanism f or IE EE 802.11 wireless LANs”, J ournal of Computer Science and T echnolo gy , V ol. 20, No. 2, pp. 282-288, March 2005. [21] Q. Xia and M. Hamdi, “Contention windo w adjustment f or IEEE 802.11 WLANs: A control-theoretic approach”, In Pr oc. of IEE E ICC 2006, V ol. 9, pp.3923 - 3928, June 2006. [22] S . Choudhury and J. D. Gibson, “Payload length and rate adaptation for multimedia communications in wi reless LANs”, IEE E JSAC, V ol.25, No.4, pp.796 -807, May 2007. [23] Wu Xiuchao, ”Simulate 802.11b chann el within NS-2”, av ailable online at www.comp.nus. edu.sg/˜wuxiuc ha/research/ reactive/repo rt/80211Channe linNS2_new.pdf [24] P roakis, J. G., “Digital Communica tions, ” McGraw Hil l , Fourth Editi on, Ne w Y ork, 2001. [25] F . Daneshgaran and M. L addomada , “Optimized prunable single cyc le interleav ers f or turbo codes, ” IEEE T rans. on Communications, vol.52, no.6, pp.899-909, June 2004. 18 [26] F . Daneshgara n and M. Laddomada, “Reduced complexity interleaver gro wth algorithm for turbo codes, ” IEEE Trans. on W ireless Communications, vol.4, no.3, pp.954-964, May 2005. [27] F . Daneshgaran , M. Laddo mada, and M. Mondin, “Interleaver design for serial ly concatenated con v olutional co des: Theory and application, ” IEEE T rans. on Information Theory , V ol.50, No. 6, pp. 1177-1188, June 2004. [28] A. L. T oledo , T . V ercauteren, and X. W ang , ”Optimizing IEEE 802.11 DCF using bayesian estimators of the network state”, P r oc. IEE E ICASSP’05 , V ol. 5, 18-23 March 2005, pp. 933-936. [29] G. Bianchi and I. Tinnirello, ”Kalman filter estimation of the number of competing terminals in an IEEE 802.11 network”, Pr oc. IEEE INFOCOM’03 , V ol. 2, 30 March-3 April 2003, pp. 844-852. [30] K. Jang-Sub, E. S erpedin, and D.-R. Shin, ”Improve d particle filtering-based estimation of the number of competing st ations i n IEEE 802.11 networks”, to appear on IEEE Sign. Pro cess. Letters, pp. 87-90. A v ailable on IEEExplorer . 19 P eq /W m m,1 m, W -1 m 1 1 1 1 1 1 1 1 1 ... ... P /W eq 1 m,0 (1-q ) (1-q)(1-P) eq q/W 0 q q(1-P) eq P eq /W m-1 m-1,1 m-1,0 m-1, W -1 m-1 ... ... ... ... ... ... ... ... ... 0,0 0,1 0,W -1 0 ... I q(1-P) eq (1-q)(1-P) eq ... P /W eq m ... (1-q)(1-P) eq q(1-P) eq Fig. 1. Marko v chain for the contention model accounting f or unsaturated traffic conditions. The model considers m backof f stages. P eq is the probability of failed transmission, accounting for both collisions and channel errors affe cting the transmitted packets. 20 0 10 20 30 0 2 4 6 8 10 x 10 5 λ [pkt/s] Throughput [bps] 0 10 20 30 0 2 4 6 8 10 x 10 5 λ [pkt/s] Throughput [bps] 0 10 20 30 0 2 4 6 8 10 x 10 5 λ [pkt/s] Throughput [bps] 0 10 20 30 0 2 4 6 8 10 x 10 5 λ [pkt/s] Throughput [bps] P e =0.1,W 0 =32,NS2 P e =0.1,W 0 =32,Thr P e =0.1,W OP =358,NS2 P e =0.1,W OP =358,Thr P e =0,W 0 =32,NS2 P e =0,W 0 =32,Thr P e =0,W OP =407,NS2 P e =0,W OP =407,Thr S( λ )=E[PL] ⋅ N ⋅ λ S M λ c Fig. 2. Throughput for the 2-way mechanism as a function of the packet rate λ , for N = 10 , m = 5 , packet size E [ P L ] = 2312 bytes, and different va lues of P e and W 0 as noticed in the respecti ve legends. Continuous straight lines refer to the linear model of the throughput S ( λ ) = N · E [ P L ] · λ deriv ed in (7), while t he horizontal line corresponds to S m noticed in (11). Dashed lines, labeled Thr , refer to the theoretical throughput in (5), while dash-dotted lines l abeled NS2 identify the simulation results obtained wit h ns-2. 21 0 500 1000 1500 2000 2500 0 20 40 60 80 100 120 140 160 180 PL [byte] λ c [pkt/s] λ c , N = 5 λ c , N = 10 Fig. 3. Behavior of λ c in (12) as a function of the packet size E [ P L ] , for two different values of N as noticed in the respecti ve legends. Other parameters are as follo ws: W 0 = 32 , m = 5 , and P e = 0 . 22 0 10 20 30 40 50 60 70 80 90 100 0 1 2 3 4 5 6 7 8 9 10 x 10 5 λ [pkt/s] Throughput [bps] PL=128 bytes PL=256 bytes PL=512 bytes PL=1024 bytes PL=2312 bytes λ c S m PL=128b, P e =0 PL=128b, P e =0.51 PL=128b, P e =0.76 Fig. 4. Behavior of the aggregate throughpu t as a function of λ , for fiv e different values of the pack et size as noticed in the legend. In each simulated scenario there are N = 10 contending stations transmitting at 1 Mbps. Other parameters are as follows: W 0 = 32 , P e = 0 , and m = 5 . The v alues of λ c are noticed on t he abscissa, whereas the horizontal lines, labeled by S m , represent the maximum aggregate throughpu t (link capacity) ev aluated t hrough (11) in each considered scenario. Al l the thick curves refer to E [ P L ] = 128 bytes, and various packe t error probabilities as noticed in the figure. 23 0 5 10 15 20 25 30 35 40 0 20 40 60 80 100 120 140 160 180 N λ c [pkt/s] λ c , PL = 1024 bytes λ c , PL = 256 bytes Fig. 5. Beh avior of λ c in (12) as a function of the number of contending stations, N , for two different values of E [ P L ] as noticed in the respecti ve legends. Other parameters are as follo ws: W 0 = 32 , m = 5 , and P e = 0 . 24 0 200 400 600 800 1000 1200 1400 1600 1800 2000 6.5 7 7.5 8 8.5 9 x 10 5 W 0 Saturation Throughput [bps] P e = 0 P e = 10 −2 P e = 10 −1 W OP =274 W OP =271 W OP =240 Fig. 6. Saturation throughput (continuous curves) as a function of the minimum contention windo w size W 0 , for three different values of P e as noticed in the legend. The other parameters are as follows: N = 10 , m = 5 , and E [ P L ] = 1024 bytes. The dashed curves represent the theoretical throughput in (5) for the chosen set of parameters. Notice that such curv es are superimposed to the results obtained with NS-2. 25 10 20 30 40 50 60 70 80 90 100 110 120 3 4 5 6 7 8 9 10 x 10 5 t [s] S(t) [bps] Link C − W 0 =32 Link C − W OP λ =8, W 0 =32 λ =8, W OP λ =8, opt. E[PL] λ =8 pkt/s, BLC region λ =8 pkt/s, BLC region W OP LC region S m Fig. 7. Aggreg ate throughput of a network with a maximum number of stations equal to 10, tr ansmitting at the fixed bit rate 1Mbps. T he other network parameters are described in the paper . 26 T ABLE I T Y P I C A L N E T WO R K PA R A M E T E R S MA C header 24 bytes Slot time σ 20 µs PHY header 16 bytes SIFS 10 µs A CK 14 bytes DIFS 50 µs τ p 1 µ s EIFS 300 µs W 0 32 A CK timeout 300 µs m 5 CTS timeout 300 µs 27 T ABLE II O P T I M I Z A T I O N A L G O R I T H M AC C O M P L I S H E D B Y E V E RY C O N T E N D I N G S T A T I O N . 1. do 2. E stimation of PE R and N 3. E v aluate λ c from (12) 4. while(IDLE) 5. // Request t o Send from Upper Layers: 6. if ( λ > λ c ) 7. // Link Capacity Operating Reg ion: 8. T he station ev aluates W opt from (15) 9. else 10. // Belo w Link Capacity Operating R egion : 11. compute E [ P L ] ∗ 1 gi ven λ c 12. compute E [ P L ] ∗ 2 gi ven P e 13. select E [ P L ] opt = min( E [ P L ] ∗ 1 , E [ P L ] ∗ 2 , P L max ) 14. end 15. send packet
Original Paper
Loading high-quality paper...
Comments & Academic Discussion
Loading comments...
Leave a Comment