Mining a medieval social network by kernel SOM and related methods
This paper briefly presents several ways to understand the organization of a large social network (several hundreds of persons). We compare approaches coming from data mining for clustering the vertices of a graph (spectral clustering, self-organizing algorithms. . .) and provide methods for representing the graph from these analysis. All these methods are illustrated on a medieval social network and the way they can help to understand its organization is underlined.
💡 Research Summary
The paper presents a comprehensive workflow for analyzing a medieval social network derived from agrarian contracts recorded in the South‑West of France between 1260 and 1340. From roughly one thousand contracts the authors construct a weighted undirected graph with 615 vertices (peasants, lords, notaries, etc.) and 4 193 edges, where each edge weight equals the number of contracts linking the two individuals. The goal is to uncover the underlying community structure, reduce the visual complexity of the graph, and provide historians with interpretable insights about temporal, geographical, and familial relationships.
Clustering approaches.
Two classical graph‑clustering techniques are first applied: (i) spectral clustering, which computes the Laplacian of the graph, extracts the p smallest eigenvectors, projects the vertices into this low‑dimensional Euclidean space and runs k‑means; (ii) kernel k‑means, which replaces the Laplacian by the diffusion (heat) kernel (K_{\beta}=e^{-\beta L}) (β = 0.05) and performs k‑means in the associated reproducing‑kernel Hilbert space (RKHS). Both methods are forced to produce 50 clusters and are evaluated with the q‑modularity measure (Q=\sum_{j}(e_j-a_j^2)). Spectral clustering yields Q = 0.4195, kernel k‑means Q = 0.4246. In both cases a few very large clusters contain more than half of all vertices, indicating an imbalance that limits interpretability.
Kernel Self‑Organizing Map (SOM).
To simultaneously achieve clustering and a meaningful layout, the authors employ a batch kernel SOM on a 7 × 7 rectangular grid (49 neurons). Each vertex is first mapped into the RKHS defined by the diffusion kernel, and the SOM learning is performed using the kernel trick. The resulting map contains 35 clusters, with a markedly higher q‑modularity of 0.551. The U‑matrix (a SOM‑specific visualization of inter‑neuron distances) reveals three clearly separated macro‑regions: top‑left, top‑right, and bottom‑right. By annotating each region with the average contract date (and standard deviation) and the geographical distribution of the peasants, the authors discover that the top‑left region corresponds to the oldest contracts (≈1270 AD) and is concentrated around the small village of Divilhac, whereas the top‑right region contains the most recent contracts (≈1330 AD) and is linked to the larger settlement of St Julien 3. The bottom‑right region bridges the two and includes families that act as social connectors.
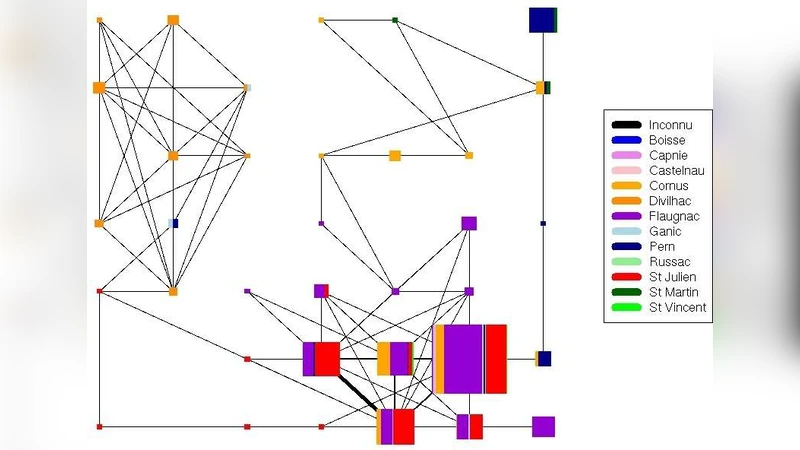
Graph visualization.
Using the well‑organized SOM as a scaffold, a force‑directed layout algorithm with location constraints is applied to the original graph. This produces a readable global picture where clusters appear as glyphs whose size reflects the number of vertices and whose edge thickness reflects inter‑cluster interaction weight. The visualization highlights a few key individuals: Pierre Fornie, already known to historians, sits at the interface between the top‑left and bottom‑right macro‑regions, confirming his role as a bridge between two major social circles. The Aliquier family similarly links the top‑right and bottom‑right areas, underscoring its importance for network cohesion.
Insights for historians.
The combined methodological pipeline yields several substantive historical findings: (1) the network exhibits a “rich‑club” core of two large, densely interconnected clusters, surrounded by many tiny, peripheral groups; (2) temporal evolution is evident, with older contracts clustering geographically in one area and newer contracts in another; (3) certain families (e.g., the Fornie and Aliquier) serve as crucial connectors across villages, suggesting they played a pivotal role in maintaining social cohesion during and after the Hundred Years’ War; (4) the analysis uncovers duplicate entries and ambiguous name spellings, prompting further data cleaning.
Conclusion.
The study demonstrates that kernel‑based SOM outperforms both spectral clustering and kernel k‑means in terms of modularity, cluster balance, and interpretability. By integrating clustering, dimensionality reduction, and graph drawing within a single framework, the authors provide historians with a powerful tool to explore large medieval social networks, trace generational and geographical patterns, and identify influential actors. The work exemplifies successful interdisciplinary collaboration among mathematicians, computer scientists, and historians, and sets the stage for future investigations into the evolution of medieval societies across major historical disruptions such as the Hundred Years’ War.
Comments & Academic Discussion
Loading comments...
Leave a Comment