Characterizing Video Responses in Social Networks
Video sharing sites, such as YouTube, use video responses to enhance the social interactions among their users. The video response feature allows users to interact and converse through video, by creating a video sequence that begins with an opening v…
Authors: Fabricio Benevenuto, Fern, o Duarte
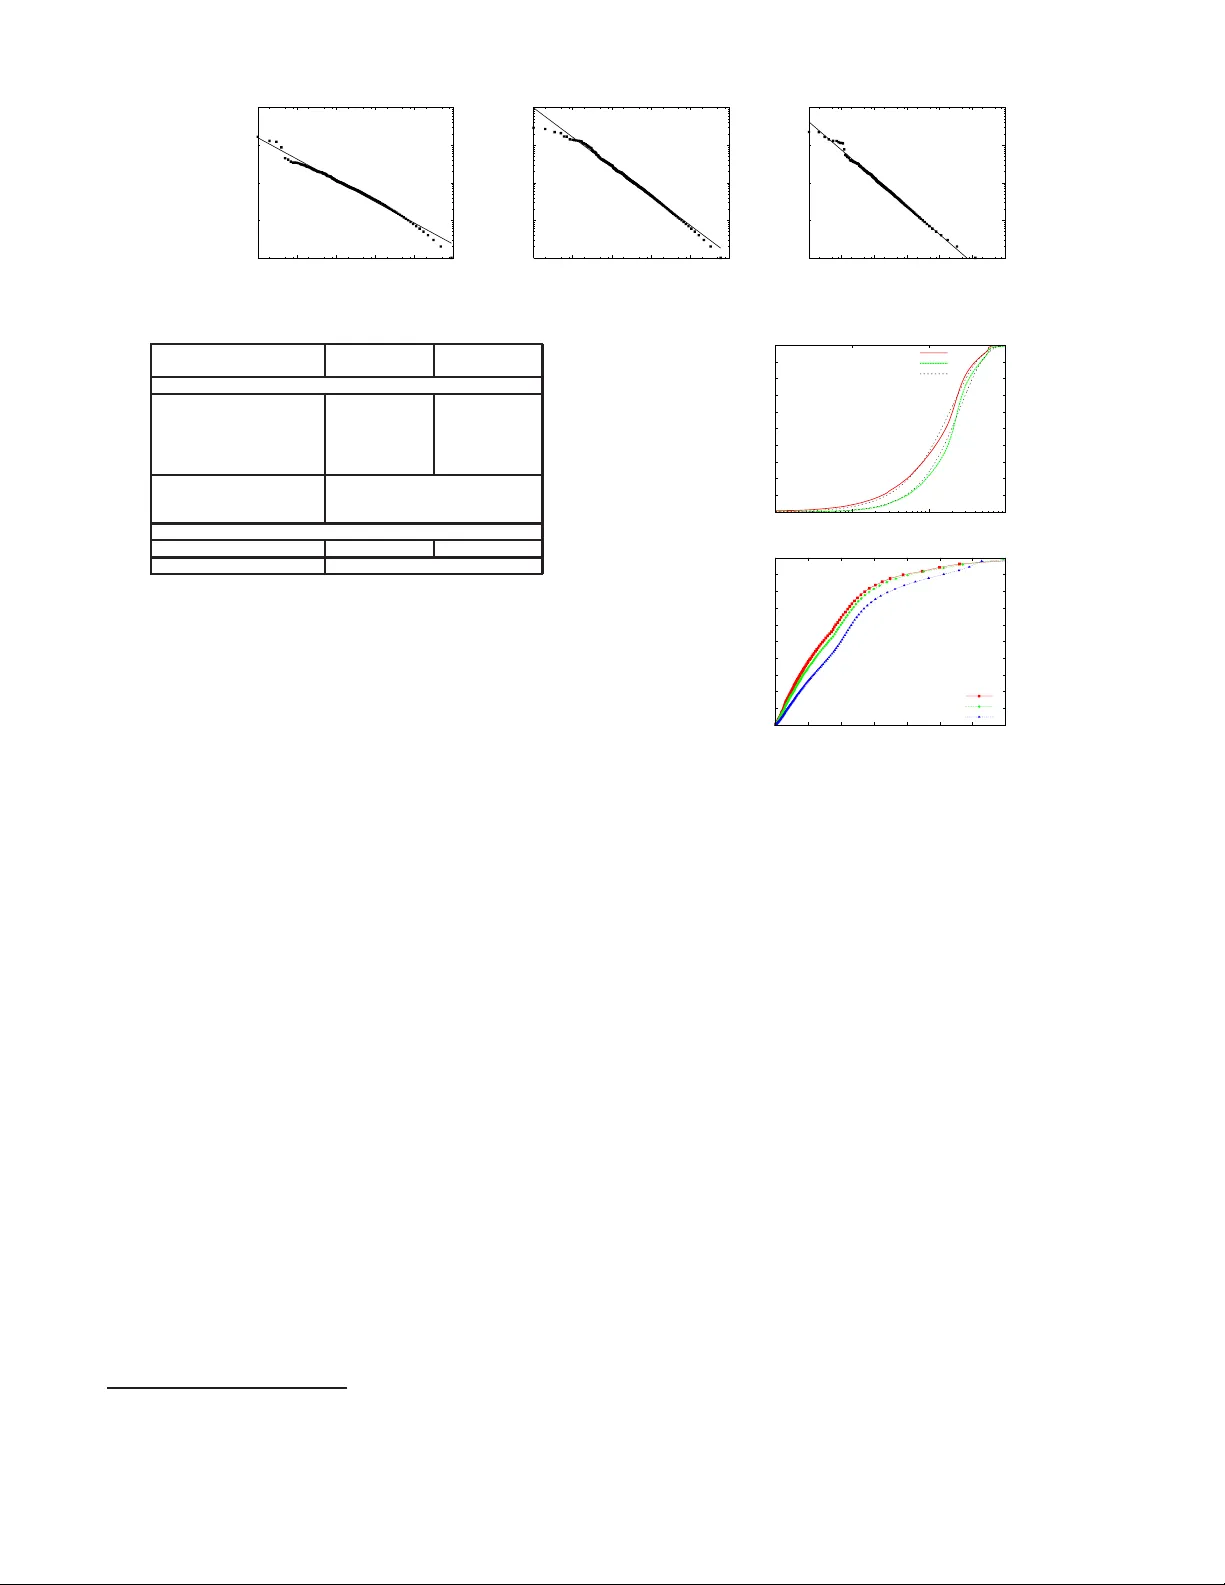
Characterizing Video Responses in Social Netw orks F A B R I C I O B E N E V E N U T O ‡ F E R N A N D O D UA RT E ‡ T I A G O R O D R I G U E S ‡ fabricio@dcc. ufmg.br fernando@dcc. ufmg.br tiagorm@dcc.ufmg.br V I R G I L I O A L M E I D A ‡ J U S S A R A A L M E I D A ‡ K E I T H R O S S † virgilio@dcc. ufmg.br jussara@dcc.ufmg.br ross@poly.edu ‡ Computer Scienc e Departmen t, Federal Univ ersity of Minas Gerais, Brazil † Polytec hnic Uni versity , Brooklyn, NY , USA ABSTRA CT V ideo sharing sites, such as Y ouT ube, use video responses to enhance the social interactions among their users. The video re- sponse feature allo ws users to interact and con verse through video, by creating a v ideo seq uence that beg ins with an open ing video and follo wed by video r espo nses from other u sers. Our characterization is ov er 3.4 mill ion videos and 400,000 video responses collected from Y ouT ube during a 7-day period. W e fi rst analyze the charac- teristics of the video responses, such as popularity , d uration, and geography . W e then examine the social n etworks that emerge from the video response interactions. 1. INTR ODUCTION Online social video networking sites allow for video-based communication among their users. V ideo-base d functions are of- fered as alternativ e to text-based ones, such as video revie ws for products, video ads and video responses [13]. A video response feature allo ws users to interac t and con v erse through video, by cre- ating a video sequence that begins with an opening video followed by video responses from other users. In this paper, we present a thorough characterization of video response in a social networking site, namely Y ouT ube. Streaming ov er 3.4 billi on videos a month (as of December 2007) according to ComScore, Y ouT ube is the most popular social v ideo-based me- dia network today generating high-volumes of Internet traffic. Our characterization of over 3.4 million videos spanning a one week period is done at two differen t l e vels. At the bottom lev el, video responses are characterized in terms of t heir popularity , duration, geographica l origin, and other featu res. At the top lev el, social net- works created by the interactions among users and videos are ana- lyzed. Such a characterization is of interest f or three reasons. The first i s a technical reason, stemming from the necessity to under- stand video-based communication, in order to ev aluate new pro- tocols and design choices for video services. The second reason is t he volume of traffic generated by video responses. The total number of views of the videos analyzed in our data set exceeds 20 billion and 14% of this total refer to views of video r espo nses. The t hird reason is sociological, relating to social networking is- Permission to make digital or hard copies of all or part of this work for personal or classroom use is grante d without fee provide d that copies are not made or distribut ed for profit or commercial adva ntage and that copies bear this notice and the full cita tion on the first page . T o cop y otherwise, to republi sh, to post on se rvers or to red istribut e to lists, requi res prior specific permission and/or a fee. Copyri ght 200X A CM X-XXXXX-XX-X/XX/XX ...$5.00. sues that influence the behavior of users i nteracting primarily with stream objects, instead of textual content traditionally av ailable on the W eb . 1.1 Contrib utions Based on an extensi ve sample collected from Y ouT ube, a dataset that consists of ov er 3.4 million videos collected ov er a one-week period, we prov ide a statisti cal analysis of video responses and a network analysis of ho w users mak e use of this functionality in so- cial networking en vironment. The principal contributions of our study can be summarized as follo ws: • The distri b utions of video responses across responsi ve and re- sponded users and responded videos follow po wer laws. This means that the majority of the video-based interactions in Y ouT ube occur between a small fraction of users. Moreo ver , the majority of the video responses are concentrated on a small fraction of the videos. • The durations of responded videos and video responses follow W eibull distributions, although the duration of responses are more ske wed towards shorter values. Moreo ver , there is a strong corre- lation between the duration of the responded video and the av erage duration of its responses. • A si gnificant fraction (27%) of responses to a video are actually uploaded t o Y ouTub e before the original video is uploaded. Ho w- e ver , about 42% of all responses are posted within one month after the original video, and 17% are posted at l east 100 days after it. Thus, for some videos, new user i nteractions are init iated longer after it was ex pected. • The vast majority ( 99% ) of the responded videos t riggered i n- teractions for which each user participated only once, resembling what occurs i n a guest-book. Nev ertheless, a few videos triggered very liv ely interactions, wi th each responsi ve user participating at least 3 times. • 40% o f the respon ded videos hav e a p ercentage of r espo nses from the same country superior to 60%, which may be exploited in the design of content distribution mec hanisms. • 35% of the responded videos receiv e at least one self-response, that is, a respon se posted b y the user who posted the original v ideo. Ho wev er , the correlati on between the number of video responses and the number of views of a responded video is weak. • The community structure of t he social network formed by video responses possesses a small strongly connected component (S CC) and large number of small communities (up to 20 members) and singletons (one degree nodes). W e found that the network created by users of a SCC is tightly connected, with an average clustering coef ficient equal to 0.137, which is much greater than 0.04 of the whole network. Our fi nding s suggest that the community structure de veloped b y video responses is at an early stage, for the size of the SCC is around 5% of the network size. 1.2 Related W o rk Giv en the nov elty of video response, it is natural to ask whether its characteristics are similar to traditional videos an d other objects of the web. Indeed, ove r the last few years, there has been a num- ber of studies that explored the va rious aspects of social network- ing sit es. For example, the works in [2, 10, 4] explored the overall scope, structure, and r elation patterns of the popular online social networks: Flickr , Y ouTu be, LiveJo urnal, and Orkut. A study of Y ouT ube is presented in [2]. Reference [5] studies temporal ac- cess and social patterns in Facebook. The authors analyze content characteristics and sys tem issues that ca n be used to improve video distribution mechanisms, such as caching and peer-to-peer distri- bution schemes. Such studies are i mportan t because they allow us to understand characteristics of dif ferent types of on line social net- works. Anoth er i mportan t consideration relates to the patterns of accesses targeting social networks and in parti cular how such ac- cess patterns impact the portion of web traffic induced by social networking s ites. Unli k e these studies, our analysis of Y ouT ube fo- cuses on characterizing video responses in online social networks. T o the best of our knowledge , this is the first effort tow ards under- standing the video response functionality in social network. 1.3 Pape r O utline The rest of the paper is organized a s follows. N e xt section de- scribes ho w we crawled and sampled Y ouT ube. Section 3 presents a statistical characterization of video responses. In the following sec- tion we present a c haracterization o f vid eo interactions i n the social network formed by relationships between users. W e conclude and present directions for future research in Section 5. 2. CRA WLING A SOCIAL NETW ORK T o collect data, we visit pages on the Y ouTub e site (that is, crawl) and gather information about Y ouT ube video responses and their co ntributors. Every Y ouT ube v ideo po st has a si ngle contribu- tor , who i s a registered Y ouT ube user . W e say a Y ouTu be video is a r esponded vi deo if i t has at l east one video response. A responded video has a sequence of video responses listed chronologically in terms of when they were created. W e say a Y ouT ube user is a r e- sponded user if at least one of its contributed videos is a responded video. F inally , we say that a Y ouT ube u ser is a r esponsive user if it has posted at least one video response. A natural user graph emer ges from video responses. At a gi ven instant of time t , let X be the union of a ll responded users and responsi ve users. The set X is, of course, a subset of all Y ouT ube users. W e denote the video r esponse user graph as the directed graph ( X, Y ) , where ( x 1 , x 2 ) is a directed arc in Y if user x 1 ∈ X has responded to a video contributed by user x 2 ∈ X . In gen- eral, the video respon se user graph hav e mu ltiple weakly connected componen ts. Some components may have thousands of users, and some components may have only two users. Ideally , we would like to obtain the complete video r espo nse user graph ( X , Y ) . Al- though Y ouT ube prov ides lists of the 100 most responded videos of al l time, it does not currently provide a means t o systematically visit all the resp onded videos. In particular , it is dif ficult to find the users in the small components in the graph ( X, Y ) . Instead, we design a sampling procedure that al lo ws us to ob- tain a large representati ve subset A of X . For a give n sampled subset A of X , let ( A , B ) be the directed graph, where ( a 1 , a 2 ) is a directed arc in B if user a 1 ∈ A has responded to a video contributed by user a 2 ∈ A . Note t hat sampled graph ( A , B ) is a sub-graph of ( X , Y ) . It is desirable that the sampled set of users A has the f ollo wing properties: 1) Each connected component in ( A, B ) is a connected component in ( X , Y ) ; t hat is, the sampled input : A list L of users (seeds) for each User U in L do 1.1 Collect U ’ s info using the Y ouTube AP I; 1.2 Collect U ’ s video list using the API; 1.3 for each V ideo V in the video list do 1.4 Copy the HTML of V ; 1.5 if V is a responded video then 1.6 Copy the HTML of V ’s video responses; 1.7 Insert the responsive users in L; 1.8 end 1.9 if V is a video r esponse then 1.10 Insert the responded user in L; 1.11 end 1.12 end 1.13 end 1.14 Algorithm 1 : Crawler subgraph ( A, B ) consists of (entire) connected components from ( X, Y ) . This property is i mportan t in order to analyze the social networking interactions engendered by video responses. 2) The subset A cov ers a l ar ge fraction of X (at least 60%). Our sample would then include the majority of the responded and responsiv e users. 3) The most responded users are i nclud ed i n A . T his prop- erty ensures that we are i ncludin g the most i mportant users, and only neg lecting users who hav e fe w responded videos. T o this end, we designed the sampling procedure described in Algorithm 1. Starting with any seed set, the abov e algorithm ensures that our resulting sample graph ( A, B ) has the first property listed above, namely , ( A, B ) consists of (some of the) connected componen ts from t he entire video response user graph ( X , Y ) . W e discuss the other properties subsequently . W e ran this sampling procedure with two different seed sets. Our first seed set uses the contributors of the all -time top-100 re- sponded videos. Our second seed set is based on the r and om sam- pling technique described in Algorithm 2. Let ( A, B ) be the sample graph determined with seed set con- sisting of the all-time top-100 most responded videos. W e now verify that our sampling procedures have Properties 2 and 3 in ad- dition to P roperty 1. Of the 100 random seed users, we find that 67 of those u sers belong to A . Thus, our sampling scheme satisfies Property 2. T o verify Property 3, we use the second data set (gen- erated with the 100 rand om seeds), and rank order the 10 most, 100 most and 1000 most responded users. W e find that our sampled graph ( A, B ) contains all 10 of t he 10 most responded users, 98 of the 100 most responded users, and 951 of 1000 most responded users. Thus, Property 3 is verified as well. The basic statisti cs of our t wo crawl are provided in T able 1. T o summarize, our all -time top-100 video crawler collected data about 3.4 million videos and 160 thousand s users. W e n ow discuss the data i n more detail, focusing first on the video crawl, and then on the user crawl. input : A list of words from a dictionary Select a random word from the dictionary; 2.1 Search tag using Y ouTu be API, using the word as tag; 2.2 for each Contributor C of the videos found do 2.3 if C is a responded OR a responsive user then 2.4 Add user to list; 2.5 end 2.6 end 2.7 Randomly select 100 users fr om the final list ; 2.8 Algorithm 2 : F ind rand om seeds 10 0 10 1 10 2 10 3 10 4 10 0 10 1 10 2 10 3 10 4 10 5 Number of Video Responses Responsive User Rank α = 0.568 fit, R 2 = 0.986 10 0 10 1 10 2 10 3 10 4 10 0 10 1 10 2 10 3 10 4 10 5 Number of Video Responses Responded User Rank α = 0.782 fit, R 2 = 0.991 10 0 10 1 10 2 10 3 10 4 10 0 10 1 10 2 10 3 10 4 10 5 10 6 Number of Video Responses Responded Video Rank α = 0.741 fit, R 2 = 0.995 Figure 1: Number of V ideo Responses per Responsive User , Respond ed User and Responded V ideo characteristic top-100 random Period of sampling 09/21-09/26/07 10/21-10/24/07 video-data # videos collected 3,436,139 3,974,579 # video responses 417,759 485,716 # views 20,645,583,524 24,380,755, 065 # views of responses 2,826,822,374 3,309,004,711 # videos without response 3,225,560 3,729,522 Common videos 3,112,660 Common responded videos 200,113 Common video responses 372,566 User-dat a # users collected 160, 765 182,725 Common users 146,799 T ab le 1: Summary of Crawled Data Sets 3. VIDEO RESPONSE CHARA CTERISTCS Figure 1 (left) sho ws the distribution of the number of video responses posted by different users. Note that the 20% most re- sponsi ve users contributed wit h 65% of all video responses whereas 84% of all responsi ve users posted, each, less than 5 video re- sponses. In fact, the distribution is well fitted by a po wer-law dis- tribution (Prob(i posts a video response) ∝ 1 /i α ) with α = 0 . 568 . Similarly , Figures 1 (middle) and (right) sho w the distributions of the numbers of video responses per responded user and responded video, respecti vely . Both d istributions are also well fitted by po wer- laws with α = 0 . 782 and α = 0 . 741 , respectiv ely . Thus, most interactions are initiated by a few (responsi ve) users, inv olve few (responded) users and concentrate around a few video s. Figure 2 (top ) sho ws the distrib utions of video durations, con- sidering, separately , only responded videos and only video resp onses. Both distributions are very ske w ed, with 80% of all samples being under 5 minutes. In fact, both follow W eib ull distributions 1 , with parameters α = 0 . 0023 and β = 1 . 15 , for video responses, and α = 0 . 00054 and β = 1 . 35 for responded videos. Howe ver , video responses hav e du rations slightly more sk ewed toward s shorter v al- ues. Moreov er , we found that, although the duration o f a responded video has a small impact on the number of responses it receiv es (correlation coefficient C = − 0 . 008 ), there is a strong correlation between the duration of the responded video and the av erage dura- tion of it s responses ( C = 0 . 51 ). Longer responded videos tend to receiv e longer responses. Mo reove r, Figure 2 (bottom) sho ws that, considering only the i th responses of videos that had at least i responses, the duration distribution becomes more ske wed as i increases. These results mimic the expected pattern in real-life hu- man interactions, whereas longer (but interesting) expositions tend to trigger longer replies, initi ally . Howe ver , replies tend to become shorter as the interaction prog resses, and the discussion dies do wn. Interestingly , we found that 25% of all video responses are self-responses, i. e., responses posted by t he user who posted the 1 The pdf for W eibull distribution is given by: f ( x ) = ( β /α ) − β ( x/β ) ( β − 1) e ( − x/α ) β 0 0.1 0.2 0.3 0.4 0.5 0.6 0.7 0.8 0.9 1 1 10 100 1000 P(x <= X) Duration(seconds) video responses only responded videos only weibull fitting 0 0.1 0.2 0.3 0.4 0.5 0.6 0.7 0.8 0.9 1 0 100 200 300 400 500 600 700 P(x <= X) Duration(seconds) 10th response 5th response 1st response Figure 2: Distributions of Du ration of Responded V ideos and V ideo Responses original video. Roughly 35% of the responded videos receive d at least one self-response, and aroun d 12% of th em receiv ed only self- responses. Whereas some of these responses might be replies to other respon ses, others might be an attempt at self-promotion, aim- ing at gaining visibili ty in o rder to place vide o and user in the mo st- responded lists. Thus, a question that arises is whether a user can exploit the video response feature to raise its video popularity , i.e., if a video re ceives many r esponses, is it also viewed many times? The correlation coefficient between the number of responses and the number of views of a responded video sho ws t his is not of- ten the case ( C = 0 . 16 ). If we disregard all responded videos with at least one self-r espo nse, the correlation increases some what ( C = 0 . 24 ), but remains lo w , i ndicating that the popularity of a video can not be artificially increased by simply adding video re- sponses to i t. In other words, posting (self-)responses ai ming at (self-)promotion does not necessarily pay off in Y ouT ube. A user can post a video response in one of t hree ways: 1) di- rectly from the user’ s webcam; 2) choose a video from one of the user’ s own, pre-existing Y ouT ube contributions; 3) upload a video from the user’ s disk drive . Unfortunately , Y ouT ube does not pro- vide a means to automatically determine in which manner a video was created. W e thus propose t o categorize video r espo nses based on the time it was uploaded to Y ouT ube, relati ve to the upload time of the responded video. W e define t he V ideo-Respo nse-Interv al (VRI) as t he upload time of the response minus the upload t ime of the responded video. The cumulativ e distribution of the VRIs is shown in Figure 3 (left). About 27% of responses correspond to videos uploaded be- 0 0.1 0.2 0.3 0.4 0.5 0.6 0.7 0.8 0.9 1 -800 -600 -400 -200 0 200 400 600 800 P(VRI <= X) Video Response Interval - VRI (days) 10 0 10 1 10 2 10 3 10 4 10 5 10 6 10 7 10 0 10 1 10 2 10 3 10 4 10 5 10 6 Number of Views Video Rank Responded Videos Video Responses Figure 3: Distribution of VRIs and Rank Distribution of the Number of V iews for Responded V id eos and V i deo Responses for e the responded video, and thus, were certainly not crea ted as responses to it. This might be explained by the video content itself. For instance, we observed that one of the responded videos having many previously uploaded responses explicitly actually requested existing Y ouT ube videos for responses. On the other hand, it might also be the result of users uploading existing (and not necessar- ily related) videos as self-responses. Moreo ver , 42% of responses are added wi thin the first month after the r espo nded video was up- loaded, indicating a prompt reaction from responsi ve users. Nev- ertheless, a non-ne gligible fraction ( 17% ) of responses are added long after the responded video appeared i n the system (i.e., VRI ≥ 100 days), meaning that some videos exhibit long-term popularity , and ne w interactions are initiated long aft er it was uploade d. 3.1 V ideo Response Popularity Distrib ution Figure 3 (righ t) shows the rank distribution of responded videos and video responses in terms of number of views i n Y ouT ube. W e observ e th at the total numbers of vie ws for responsiv e and responded videos are not dominated by a very small number of very popular videos. From F igure. 3 (r ight), we calculated that there are more than 33,000 v ideo responses and 57,000 resp onded videos that have been viewed more t han 10,000 times each. The median number of views for the video responses and responded videos is 508 and 2,028 respectiv ely , while 90% of video responses and responded videos we crawled were viewed more than 61 and 129 times, re- specti vely . This in turn raises interesting questions about the con- sumption behavior of Y ouT ube. Note that t he number of views reported include both co mplete and incomplete vie ws (where u sers stopped vie wing after a few seconds or more). W e conjecture t hat due to the low effort and cost of viewing a video and the rich in- terconnections between videos on the site, there is a large amount of fairly random surfing and exploration where visitors and users serendipitously explore videos. This could explain t he large num- ber of vie ws o f even unpopular v ideos and contrasts with traditional W eb content, dominated by Z ipf ’ s beha vior . One may conjecture that a video service that charges ev en a small amount per video started would exh ibit a very differen t behavior . 3.2 V ideo Response G eographical Di strib ution An important que stion that is often ask ed regarding web char- acterization studies has to do with t he geograph ical representati ve- ness of the sample. Geography and f riendsh ip have been used to build real social network models [9]. As evident fr om Figure 4 (left), t he sample we characterize is fairly large i n terms o f the num- ber of countries (as identified by the country described in the user profile) and the number of video responses and responded videos uploaded by users of differen t countries. Using the country i denti- fication, we are able to map the contributo r population to over 236 countries. The top fiv e countries in our sample account for 76.8% of total video responses uploaded to Y ouT ube. The plots suggest a power law-like profile, with parameter α = 2 . 12 ( R 2 = 0 . 92 ) and α = 2 . 22 ( R 2 = 0 . 93 ) for video responses and responded 10 0 10 1 10 2 10 3 10 4 10 5 10 6 1 10 100 1000 Number of videos Country Rank Video Responses Responded Videos 0 0.1 0.2 0.3 0.4 0.5 0.6 0.7 0.8 0.9 1 0 0.1 0.2 0.3 0.4 0.5 0.6 0.7 0.8 0.9 1 P(x <= X) Fraction of Local Responses Figure 4: Distribution of V ideo Responses ov er Countries videos, respectiv ely . W e also defined the percentage of l ocal video responses as the rati o of video responses from the same country of the responded video to the total number of video responses. Fig- ure 4 (right) sh ows the cumu lative d istribution of th e percentage of local video responses ov er all responded videos of our sample. W e notice that more than half of the “video con versations ” in volv es at least some participants from the same country of the original con- tributor . For example, 40% of responded video has a percentage of local responses superior to 60%, which may be useful information for designing content distribution mechan isms. 3.3 V ideo-Based Interactions Our characterization of user interactions at the video lev el con- sists of examining the sequence of video responses follo wing a Y ouT ube video. For each responded video V i , let n i denote the number of video responses, and denote the sequence of responses as { V R i, 1 ; V R i, 2 ; ... ; V R i,j ; ... ; V R i,n i } , where V R i,j is the j th video response. A user may add multiple video responses in sequence t o the same video. W e define a sequence of responses S i,k as a series of consecutive responses from the same user to video V i . Thus, the ordered list of video responses to video i can also be exp ressed as { S i, 1 ; S i, 2 ; ...S i,s i } , 1 ≤ s i ≤ n i , where S i,k is the sequence { V R i,j ; V R i,j +1 ... } of c onsecutive responses from user U i,k . Note that the same user may post multiple (non-consecu tiv e) sequences of responses to the same video V i , i. e., we may have U i,k = U i,j for k 6∈ [j- 1,j+1]. In the follo wing e xample, video V i recei ved 7 video resp onses grouped into 4 sequences, posted by 3 users ( U 1 , U 2 and U 3 ): V i ; S i, 1 z }| { V R i, 1 , V R i, 2 | {z } U 1 , S i, 2 z }| { V R i, 3 | {z } U 2 , S i, 3 z }| { V R i, 4 , V R i, 5 , V R i, 6 | {z } U 1 , S i, 4 z }| { V R i, 7 | {z } U 3 Our characterization focuses on a simple metric, defined as the ra- tio U/S of the N umber of Unique Responsive Users to t he Number of S equences of Responses . In the above example, this ratio is 0.75. A video-based interaction with a ratio U/S close to 0 indicates an asynchron ous video dialogue between a relativ ely small n umber of highly active users, who keep the discussion alive with multiple (not necessarily consecuti ve) responses to each other . This type of interaction is akin to the exchanges and debates in a parlor or pub lic forum, in which the communication underscores a many -to-many dialogue between participants. At the other extreme, when the ra- tio approaches one, there may be two types of interaction. One type occu rs when the numb er of u nique respon siv e users equ als the number of sequences of responses, resembling a register , petition or guest-book, for which the communication is many-to-one, and the purpose of a video resp onse is to record a comment (or supp ort a petition, etc.). The other type has just one user posting a single sequence. Figure 5 sho ws the ratio U/S versus t he number of sequences of responses for each responded video in our data set. Dif ferent types of interactions can b e seen across all responde d videos, char - Figure 5: T ypes of video-based interactions acterized by a wide rang e of U/S v alues. Howe ver , only a r elati vely small number of videos triggered l i vely interactions, with each re- sponsi ve user adding on average at least 3 sequences of responses. In fact, the vast majority of the responded videos (99%) triggered interactions with only one sequence of responses per responsi ve user (i.e., r atio equal to 1). In fact, Figure 5 shows t hese interac- tions occur among groups of res ponsiv e users of v arying sizes (i.e., number of sequences). 4. NETWORK CHARA CTERISTICS Out o f the se veral n etworks that emer ge from the user interac- tions enabled by Y ouTub e features, we select the user graph ( A, B ) (see S ection 2) for an in-depth analysis. T able 2 presents the main statistics of the network built from the all-time top-100 d ata set and for its largest strongest con nected component. 4.1 Degr ee Distribution The ke y characteristics of the structure of a directed network are the in-degree ( k in ) and the out-degree ( k out ) distributions. As sho wn in Figure 6, the distr ib utions of the degrees for the entire graph follow po wer laws P ( k in,out ) ∝ 1 /k α in,out in,out , with expo nent α in = 2 . 096 and α out = 2 . 759 with the following coefficient of determination: R 2 = 0 . 98 and R 2 = 0 . 97 . The scaling expone nts of t he whole network l ie in a range of 2.0 and 3.4, which is a very common range for social and communication networks [3]. Our results agree with pre vious measurements of many real-world net- works that exhibit po wer law distributions, i nclud ing t he W eb and social networks defined by blog-to-blog links [8]. The in-degree exponent i s smaller than the exponent of the out-deg ree distribution, indicating that there are more users with larger in-degree than out-degree. This fact suggests a li nk asym- metry in t he directed interaction network. Unlike other social net- works that exhibit a significant degree of symmetry [10], the user interaction network sho ws a structure similar to the W eb graph, where pages with high in-degree tend to be authorities and pages with high out-degree act as hubs directing users to recommended users [ 7]. In order to inv estigate this point further , Figure 7 (left) sho ws the cumulativ e distribution of ratios between in-degree and Characteristic Dataset Largest SCC # nodes 160,074 7,776 # edges 244, 040 33,682 A vg Clustering Coef ficient 0.047 0.137 # nodes of largest SCC 7,776 7,776 # components 149,779 1 r -0.017 0.017 A vg distance 8.40 8.40 A vg k in (CV) 1.53 (9.38) 4.33 (3.14) A vg k out (CV) 1.53 (1.717) 4.33 (1.28) A vg k 3.06 8.66 T ab le 2 : Summary of the Network Metrics out-deg ree for the user interaction network. The network has 60% of the users with out-degree higher than in-degree and 5% of the users wit h significantly higher in-degree than out-de gree. This is e vidence that a few users act as “authorities” and “hubs”. Interest- ingly , we have observ ed in our dataset that authority-like users (that is, highly responded users), with high in-degree, are typically me- dia companies t hat upload professional content, including sports, entertainment video and T V series. This type of node in our net- work receive s video response from many Y ouT ube users. Nodes with very high out-deg ree may indicate either very activ e users or spammers, i. e., users that distribute content (i.e., video responses) that ¸ Slegitimate ˇ T users ha ve not solicited. According t o [12], assortativ e mixing and high clustering co- efficien t are two graph theoretical quantities typical of social net- works. W e now i n vestigate assortative mixing. Clustering Coeffi- cient is analyzed in the next section. A network is said to exhibit assortativ e mixing if the nodes with many connections tend to be connected to other nodes with many connections. Social networks usually sho w assortativ e mixing. The assortati ve (o r disassortati ve) mixing is e valuated by the Pearson coefficient r , which is calcu- lated as follows. [11]: r = P i j i k i − M − 1 P i j i P i ′ k i ′ p [ P i j 2 i − M − 1 ( P i j i ) 2 ][ P i k 2 i − M − 1 ( P i k i ) 2 ] , (1) where j i and k i are the excess in-de gree and out-deg ree of t he v er- tices that the i th edge leads into and out of, respectiv ely , and M is the total number of edges in the graph. T able 2 sho ws v alues o f r for the directed graph of the interac- tion network. T he video-response network has a disassortati ve mix- ing r = − 0 . 017 , where high degree nodes preferentially connect with low degree ones and vice versa. By contrast social networks hav e significant assortative mixing, which accords with the notion of social communities. S o, the entire user interaction graph does not sho w evidence of the formation of a large so cial community . 4.2 Clustering Coefficien t It has b een suggested in the literature that soc ial networks pos- sess a topological structure where n odes are o rganized into commu- nities [12], a feature t hat can account for the values for the cluster- ing coefficient and degree correlations. The clustering coefficient of a node i , cc ( i ) is the ratio of the number of existing edges over the number of all possible edges between i ’ s neighbors. The clus- tering coefficient of a network, C C , is the mean clustering coef- ficient of all nodes. The av erage CC over t he whole network is C C = 0 . 047 , w hereas the mean clustering coef ficient for a ran- dom graph wit h identical degree distribution but random l inks is C C = 0 . 007 , which sho ws the presence of small communities in the video-respon se network. The leftmost part of Figure 8 sho ws the cumulativ e distr ib ution of the clustering coef ficient. The net- work contains a significant fraction of their nodes with zero clus- tering coef ficient. Specifically , 80% of all nodes i n the entire user interaction netw ork ha ve C C = 0 . T his feature indicates that there is a clear difference on average between cl ustering in the entire 10 0 10 1 10 2 10 3 10 4 10 5 10 0 10 1 10 2 10 3 10 4 Count In-degree α = 2.096 fit, R 2 = 0.987 10 0 10 1 10 2 10 3 10 4 10 5 10 6 10 0 10 1 10 2 10 3 Count Out-degree α = 2.759 fit, R 2 = 0.987 Figure 6: In-Degree and Out-Degr ee Distributions. network and the components of the network. The right part of the figure shows ho w the clustering coef ficient v aries with t he node out-deg ree. Higher values of the clustering coefficient occur among lo w d egree-nodes, sug gesting the lack of l ar ge communities arou nd high-de gree nodes. Our conjecture is that highly responsi ve users do not necessarily have social links with the contribu tors of the videos that they are respon ding to. T herefore, there may not e xist a sense of community among the users that receive video responses from a single respon siv e user . Lo w degree nodes might e xplain the formation of very small communities, composed of a few people like a family or a group of friends that share videos and i nteract through video responses. T able 2 shows the size of the largest strongly connected com- ponent (SCC) and t he total number of other strongly connected componen ts of the video response user graph ( A , B ). Figure 7 (right) sho ws the distribution of the size of t he networked compo- nents sorted from the largest component to the smallest one. T he distribution suggests a general structure that includes the largest SCC, the middle components (i.e., 1974), and a large number of componen ts with just one node (i.e., 147805). As we are working with a directed graph, these componen ts with size one are nodes with links in only one direction. The mi ddle componen ts are tightly connected groups of users, representing small size communities (e.g., fa milies and groups of friends) th at e xpress their interests and establish communication via video r espon ses. The largest SCC rep- resents about 5 % of the nod es, but it is considerably larger than the others. It concentrates 10% of the views and 22% of t he video re- sponses and deserves further analysis. Although it includes about 5% of the nodes, its size is comparable to the size of SC C in other networks, derived from blogosphere samples [1]. T he differen ces in size of connected components may be due to time factors, that account fo r the adoption by users of specific features ( i.e., video re- sponse) in social networking en vironments. In order t o understand its characteristics, we in vestigate network properties of the giant componen t in the video response user graph. The av erage cluster- ing coefficient of the giant compone nt is C C = 0 . 137 , t hree times greater than the clustering coef ficient of the entire network. Thus, user interactions captured by the giant component might form a more tightly connected community . 5. CONCLUSION W e crawled Y ouTub e to obtain a large representativ e subset of t he video response user graph. Our characterization was done from two perspecti ves: video response view and interaction net- work view . I n addition to providing statistical models for various characteristics (popularity profiles, duration, geographical, etc.), our study has un v eiled a number of interesting findings. For exam - ple, the characteristics of social video sharing services are signifi- cantly different from those of traditional stored object workloads, based on text and image. Part of the differen ce stems from the change from textual communication to stream-based communica- 0 0.1 0.2 0.3 0.4 0.5 0.6 0.7 0.8 0.9 1 0.01 0.1 1 10 100 1000 10000 P(x <= X) Ratio Out-degree/In-degree In-degree/Out-degree Figure 7: CDF of in-degree to ou t-degr ee ratio (left). Compo- nent Size vs Rank (right). 0 0.2 0.4 0.6 0.8 1 0 0.2 0.4 0.6 0.8 1 Cumulative Probability Node Clustering Coefficient (cc(i)) 0 0.01 0.02 0.03 0.04 0.05 0.06 10 0 10 1 10 2 10 3 Average CC Out-degree Figure 8: Distribution of C C (left) and avg . C C node out- degree (right). tion, creating a ne w paradigm for online communication. Our current and future work i s foc used on le veraging many of the fi nding s a nd conclusions prese nted in this paper along a number of dimensions. First, we are looking into using the characteristics found in this paper as models to be used for d esigning mechanisms for content distr ib ution (i. e., pre-fetching, replication and caching) based on social network characteristics. For in stance, if a pa rticular stream is posted by a user , then for a distri b ution server at a partic- ular location, we can associate that stream wit h the social commu- nity of t hat i ndi vidual, identified by t he video-response network. Second, we are ev aluating the use of network node characteristics (i.e., degree distribution, degree correlation, etc) to identify spam in online social network s [6]. 6. REFERE NCES [1] N. Ali-H asan an d L . Adam ic. Expressing social relationships on the blog through links and comments. In Int’l. Conf. on W eblogs and Social Media , 2007. [2] M. Cha, H. Kwak, P . Rodriguez, Y . Ahn, and S . Moon. I tube, you tube, ev erybody tubes: Analyzing the world’ s largest user generated content video system. In Pr oc. of IMC , 2007. [3] H. Ebel, L. Mielsch, and S. Bornholdt. Scale-free topology of e-mail netwo rks. Physical Review E , 66:035 103, 2002. [4] P . Gill, M. Arlitt, Z. Li, and A. Mahanti. Y outube traffic characterization: A view from the edge. In Pr oc. of IMC , 2007. [5] S . Golde r, D. W i lkinson, and B. Huberma n. Rhythms of social interaction: Messaging wit hin a m assiv e online network. Pr oc. of the Int’l. Con f. on Communities and T echn ologies , 2007. [6] P . Heyman n, G. Koutrika, and H. Garcia-Molina. Fighting spam on social web sites: A survey of approach es and future challenges. IEEE Internet Computing , 11(6):36–45 , 2007. [7] J. Kleinberg. Hubs, authorities, and communities. ACM Computing Surve ys , 31, 1999. [8] R. Kumar , J. Nov ak, P . Raghav an, and A. T omkins. On the bursty e vo lution of blogspace. In Proc. o f WWW , 2003. [9] D. Liben-Nowell, J. Nov ak, R. Kumar , P . Ragha va n, and A. T omkins. Geographic routing in ocial network. In Pr oc. of National Academy of Sciences , 2005. [10] A. Mislove, M. Marcon , K. Gummadi, P . Druschel, and B. Bhattacharjee. Measuremen t and analysis of online social networks. In Pr oc. of IMC , 2007 . [11] M. Newman. Assortati ve mixing in netwo rks. P hys. Re v . Letters , 89:20 8701, 2002. [12] M. Newman and J. Park. Why social networks are dif ferent from other types of netw orks. Phys. Rev . E , 68:036122 , 2003. [13] M. Shannon. S hakin g hands, kissing babies, and...blogging? Communications of the ACM , 5 0, 2007.
Original Paper
Loading high-quality paper...
Comments & Academic Discussion
Loading comments...
Leave a Comment