A hidden spatial-temporal Markov random field model for network-based analysis of time course gene expression data
Microarray time course (MTC) gene expression data are commonly collected to study the dynamic nature of biological processes. One important problem is to identify genes that show different expression profiles over time and pathways that are perturbed…
Authors: Zhi Wei, Hongzhe Li
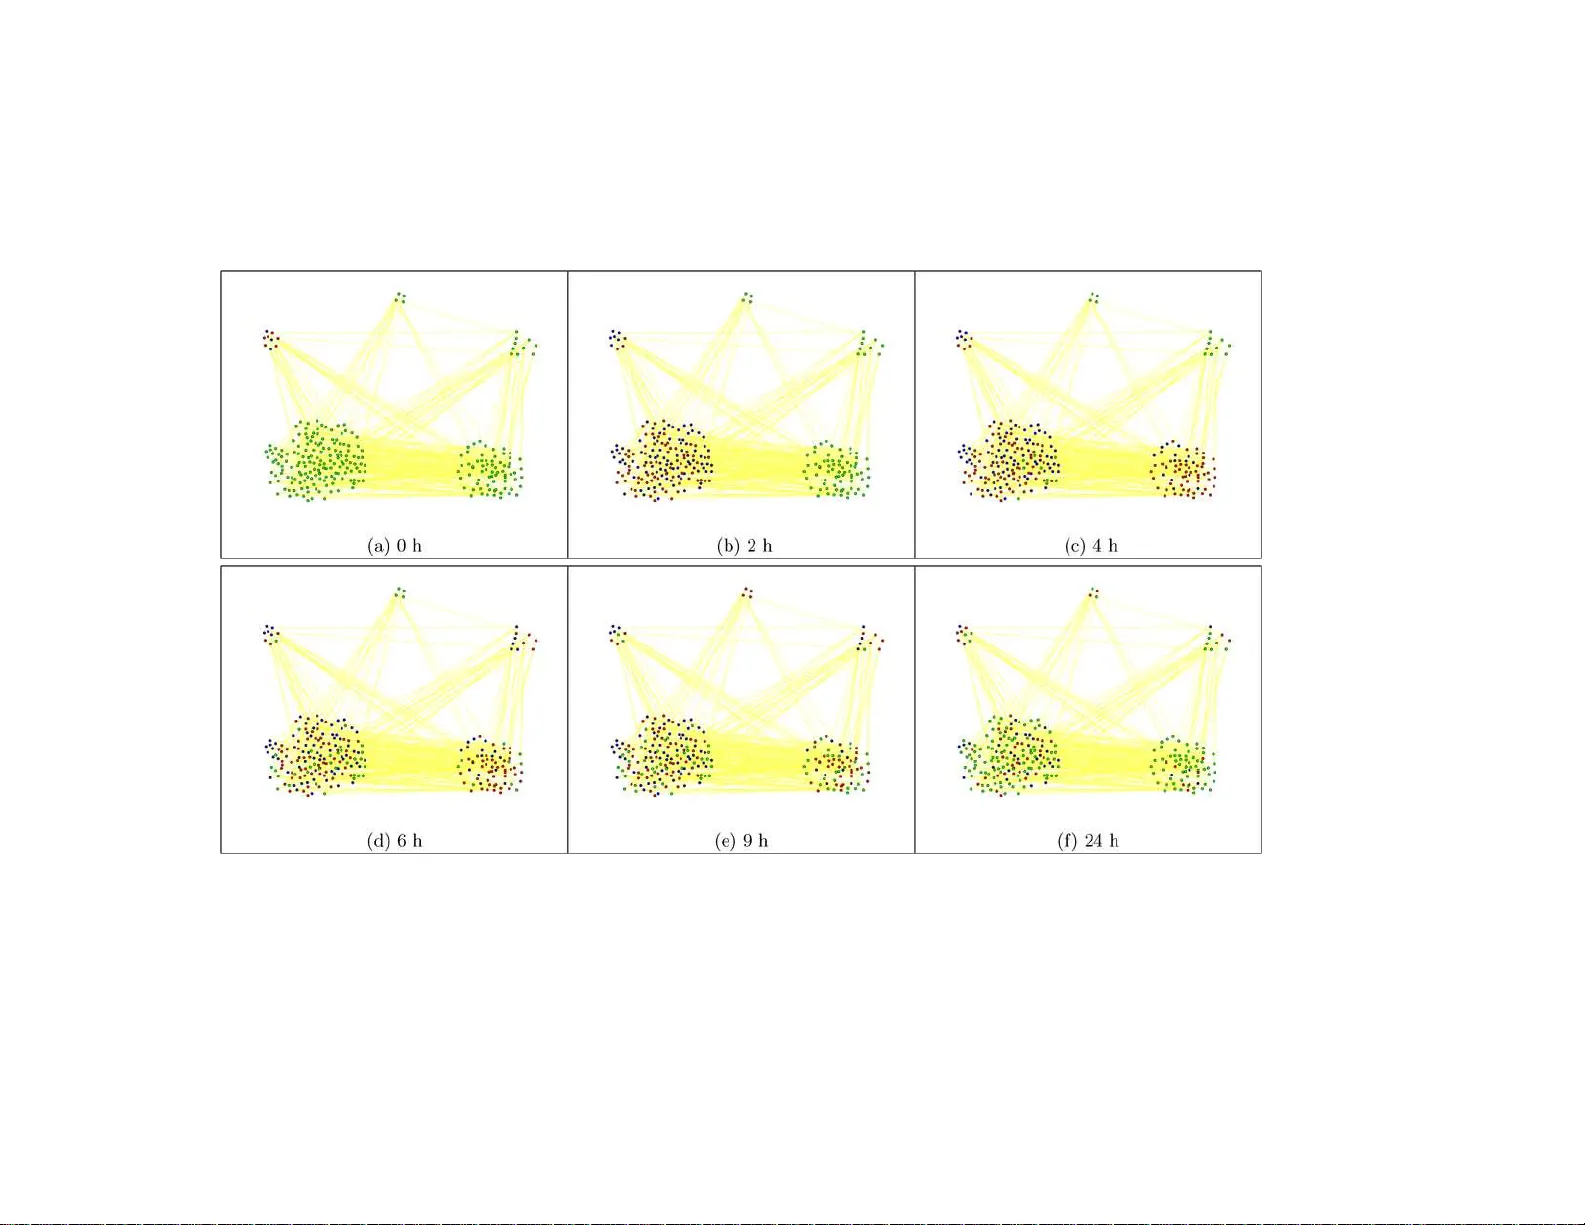
The Annals of Applie d Statistics 2008, V ol. 2, No. 1, 408–429 DOI: 10.1214 /07–A OAS145 c Institute of Mathematical Statistics , 2 008 A HIDDEN SP A TIAL-TEMPORAL MARK OV RANDOM FIELD MODEL F OR NETW ORK-BAS ED ANAL YSIS OF TIME COURSE GENE EXPRESS ION D A T A 1 By Zhi Wei and Hon gzhe Li University of Pennsylvania Scho ol of Me dicine Microarra y time course (MTC) gene expression d ata are com- monly collected to study the dynamic nature of biological pro cesses. One imp ortant problem is t o identif y genes that show differen t ex- pression profiles ov er time and pathw ays that are p erturb ed during a giv en biological pro cess. While metho ds are a va ilable to identify the genes with differential expression levels o ver time, there is a lack of metho d s that can incorp orate the pathw a y information in identifying the pathw ays being mo dified/activ ated du ring a biolo gical pro cess. In this paper w e devel op a hidden spatial-temporal Marko v rand om field (hstMRF)-based metho d for identifying genes and subnetw orks that are related to biologica l pro cesses, where t h e dep en dency of the dif- feren tial exp ression patterns of genes on t he netw orks are mo deled o ver time and ov er the n etw ork of p athw ays. Simulation studies in- dicated that the metho d is quite effective in identifying genes and mod ifi ed subnetw orks and has higher sensitivity than the commonly used procedu res th at do not use th e p athw a y structu re or time de- p endency information, with simila r false disco very rates. Application to a microarra y gene expression study of systemic inflammation in humans identified a core set of genes on the KEGG pathw ays that sho w clear differential expression patterns ov er time. In addition, the metho d confirmed th at th e TOLL-like signaling pathw ay plays an imp ortant role in immune response to endotoxins. 1. In tro d uction. Cellular activities are often d ynamic and it is therefore critical to study the gene exp ression patterns o v er time in biology . With the adv ances in high thr oughput gene expression profiling tec hnologies, mi- croarra y time course (MTC) exp eriments remain a common to ol to cap- Received May 2007; revised Octob er 2007. 1 Supp orted by NI H Grant CA127334 and a grant from the Pennsylv ania D epartment of Health. Key wor ds and phr ases. Iterative conditional mo des, pathw a y , undirected graph, d if- feren tial expression. This is an elec tronic reprint of the o riginal a rticle published b y the Institute of Mathematical Statistics in The Annals of Applie d S tatistics , 2008, V ol. 2 , No. 1 , 4 08–42 9 . This repr in t differs from the original in pagination and typo graphic detail. 1 2 Z. WEI AND H. LI ture the gene expression patterns o v er time in a genomic scale. Th is is evi- denced by the fact that such MTC data accoun t for more than one th ir d of gene expression studies in the Gene Expression Omnibu s, a database rep os- itory of high throughpu t gene expression data hosted by the National Cen - ter for Biotec hnology Inform ation ( http://w ww.ncbi.n lm.nih.gov/geo/ ). One imp ortan t application of such MTC gene expr ession exp eriments is to iden tify genes that are temp orally differen tially expr essed (TDE) b et w een t wo MTC exp erimen ts and the pathw a ys or n et wo r ks that are p erturb ed or activ ated du r ing a giv en b iologic al pro cess. Compared to gene expression studies at one time p oin t, suc h MTC studies can p otent ially identi fy more genes that are differen tially expressed [Y uan and Kendziorski ( 2006 ), T ai and Sp eed ( 2006 ) and Hong and Li ( 2006 )]. One imp ortant feature of th e MTC gene expr ession data is that the data are exp ected to b e dep enden t o v er ti me. Efficien tly u tilizing suc h dep en- dency can lead to a gain in efficiency in identifying the TDE genes. Sev eral new statistical metho ds h a ve b een develo p ed for identifying th e TDE genes to accoun t for suc h d ep endency . Storey et al. ( 2005 ) dev elop ed a metho d us- ing b asis function expansion to charac terize the time-course gene expression data and prop osed to dev elop gene-sp ecific summary statistics and the corre- sp ondin g p v alues based on th e fi tted sm o oth curve s. Y uan and Kendziorski ( 2006 ) prop osed to use a h idden Marko v mo del to iden tify TDE genes in order to utilize the dep endency of different ial expressions of genes across time p oin ts. T ai and Sp eed ( 2006 ) dev elop ed the empirical Ba y es method treating the observ ed time-course gene expression data as m u ltiv ariate v ec- tors. Hong and Li ( 200 6 ) d ev elop ed a fu nctional empirical Ba y es metho d using B-splines. Although these new metho d s can b e used to identify th e TDE genes, they often do not provide direct information on which k ey molecular mec hanism s are inv olv ed in the biological pro cess or w hic h biological pathw a ys are b e- ing activ ated or mo dified d uring a giv en biological pro cess. It is therefore imp ortant to deve lop nov el statisti cal metho ds for iden tifying these TDE genes in the con text of known biological pathw a ys. Information ab out gene regulatory dep end en ce has b een accumulat ed from many y ears of biomed- ical exp eriments and is summ arized in the form of pathw a ys a nd assem- bled into pathw a y databases. Some well- kno wn p ath wa y d atabases include KEGG [Kanehisa and Goto ( 2002 )], Reacto m e ( www. reactome. org ), Bio- Carta ( www.bioc arta.com ) and BioCyc ( www.bio cyc.org ). Sev eral meth- o ds ha ve r ecen tly b een dev elop ed to incorp orate the path wa y structures in to analysis of microarra y gene expression data. Subr amanian et al. ( 2005 ) de- v elop ed a gene set enric hment analysis pro cedur e to accoun t for the group structure of genomic data and to ident ify pathw a ys that are related to d is- eases or biologica l pr o cesses. Rahnenf ¨ uhrer et al. ( 2004 ) d emonstrated that the sensitivit y of detecting relev an t pathw a ys can b e impro v ed by integrat ing NETW ORK-BAS ED ANAL YSIS OF GENOMIC D A T A 3 information ab out p ath wa y top ology . In Siv ac henko et al. ( 2005 ) a net w ork top ology extracted from th e literature w as used join tly with microarra y data to find significan tly affec ted path wa y regulators. Nacu et al. ( 2006 ) p rop osed an int eresting p erm u tation-based test for identifying subnet works from a kno wn net wo r k of genes that are relat ed to phenot yp es. Rap ap ort et al. ( 2007 ) prop osed to fi rst smo oth the gene exp ression data on the n et wo rk based on the sp ectral graph theory and then to use the smo othed data for classification. Ho wev er, none of these explicitly mo dels the MTC expression data. W ei and Li ( 2007 ) ha v e recen tly dev elop ed a hidd en Mark o v r andom field (hMRF) mo del for iden tifying the subn et wo rks that sho w differentia l ex- pression patterns b et w een tw o conditions, and h av e demonstrated that the pro cedure is m ore sensitive in identi fying the differen tially expr essed genes than those p ro cedures that do n ot utilize the path wa y str ucture information. In this p ap er, to efficien tly identify th e TDE genes in the MTC exp eriments, w e dev elop the hMRF mo del [W ei and Li ( 2007 )] further in to th e hidden spatial-temp oral MRF (hstMRF) to sim ultaneously consid er the spatial and temp oral dep en d encies of d ifferen tial exp ression states of genes. The k ey of our approac h is that the information of a known net w ork of path w ays is ef- ficien tly utilized in the analysis of MTC exp ression d ata in ord er to id en tify more biologica lly interpretable results. W e also presen t an algorithm that com bines the features of the iterativ e conditional mo d es (ICM) algorithm of Besag ( 1986 ) and the Viterbi algorithm [Rabiner ( 1989 )]. W e in tro du ce th e hstMRF m o del in Section 2 and pr esen t an efficien t algorithm for parameter estimation by the ICM algorithm and the Viterbi algorithm in Section 3 . W e p resen t results fr om simulation studies in Sec- tion 4 to d emonstrate the application of the hs tMRF mo del, compare with existing metho ds and to ev aluate the sensitivit y of the m etho d to missp ec- ification of the netw ork structure. In S ection 5 , for a case study , we apply the hstMRF mo del to analyze the MTC data of a systemic in flammation study in humans [Calv ano et al. ( 2005 )]. W e present a br ief discussion in Section 6 . 2. Statistical mo dels and metho ds. Consider the MTC gene expression data measured under t wo different conditions o v er time p oint s 0 , 1 , 2 , . . . , T . Let y t b e a p × ( m + n ) matrix of expression v alues for p genes with m + n arra ys at time t , wh ere the fir st m columns are the expression d ata measured under the first condition ov er m indep endent samples and the second n columns are the expr ession data measured und er the second cond ition o ver n indep en d en t samples. The full set of observ ed expression v alues is then denoted by Y = ( y 0 , y 1 , . . . , y T ) . 4 Z. WEI AND H. LI With sligh t abu se of notation, let y g denote one r o w of this matrix con taining data for gene g o ve r time, y g t denote expr ession data for gene g at time t o ver m + n samples, and y g tc denote the exp r ession level for gene g at time t in sample c . Supp ose that we ha ve a netw ork of kno wn path wa ys whic h can b e r epresen ted as an u ndirected graph G = ( V , E ), w h ere V is the set of no des that represen t ge nes or proteins co ded by genes and E is the set of edges linkin g t wo genes with a regulatory relatio nship. As an example, Figure 1 sho ws the T oll-lik e receptor signaling path wa y in the KEGG d atabase, wher e the squares are th e genes (or, m ore precisely , th e gene pr o ducts) or gene clusters and the directed lines b etw een tw o genes indicate s ome regulatory relationships b et ween them. I n this pap er we do not consider the direction of the edges and only treat this p ath wa y as an undirected graph . Some comp onen ts of this path wa y are also comp onen ts of other path wa ys suc h as the MAPK and JAK-ST A T signaling pathw a ys. I n the current K EGG database, there are a total of 33 suc h r egulatory pathw a ys that form a regulatory net work. Let p = | V | b e th e n u m b er of genes that this net wo rk conta ins. Note the gene set V is often a su bset of all the genes that are pr ob ed on the gene expression arra ys . If we wan t to in clude all the genes that are prob ed on the expr ession arr a ys, we can exp and the netw ork graph G to includ e iso- lated n o des, whic h are those genes that are pr ob ed on the arra ys but are not p art of the kno wn biological net w ork. F o r t wo genes g and g ′ , if there is a kno w n regulatory relationship, w e write g ∼ g ′ . F or a giv en gene g , let N g = { g ′ : g ∼ g ′ ∈ E } b e the s et of genes that ha ve a regulatory r elation- ship w ith gene g . Our goal is to ident ify the genes on the netw ork G that are different ially expressed at eac h time p oin t du ring the time cours e of a giv en biologica l experiment. Let X g t b e the random v ariable that assigns a differentia l expression state (DES) to gene g at ti me t , taking a v alue of 1 if the g th gene is differentiall y expr essed (DE) at time t or a v alue of 0 if it is equally exp ressed (EE) at time t . L et X = ( x 0 , . . . , x T ), where x t = ( X 1 t , . . . , X pt ) ′ . W e denote X ∗ as the true but unkno wn differen tial ex- pression state and in terpr et this as a particular r ealiza tion of th e rand om matrix X . Our goa l is to reco v er the true bu t unobser v able X ∗ from the observ ed data Y . Using the Ba yes form ula, we prop ose to estimate X ∗ that maximize P r ( X | Y ) ∝ P r ( Y | X ) P r ( X ), the p osterior densit y for the gene expression states X , giv en the gene expr ession leve ls Y wh ere P r ( Y | X ) rep- resen ts the evidence from the microarray exp erim ents and the prior P r ( X ) represent s our prior kno wledge on gene regulation as p r o vided by the gene net work G . In the follo wing, we first sp ecify p robabilit y mo dels for P r ( X ) and P r ( Y | X ). NETW ORK-BAS ED ANAL YSIS OF GENOMIC D A T A 5 Fig. 1. Structur e of the KEGG T ol l-like r e c eptor (TLR) signaling p athway and the gene expr ession states of the genes at 4 h after the administr ation of endotoxin, wher e the EE genes ar e dark-sh ade d and the DE genes ar e light-shade d. In this p athway, the r e ctangles r epr esent gene pr o ducts, mostly pr oteins, but also including RNAs and the r ounde d r e ctangles i ndic ate other p athways that ar e r elate d to the TLR p athway. F or the e dges, a solid arr ow b etwe en two pr oteins me ans activation, while a dashe d arr ow me ans i ndir e ct effe ct, and the “+p” sign on the arr ow further sp e cifies that activations ar e achieve d by Phosphorylation. In addition, a r e ctangle p oi nting to a smal l cir cle, which p oints to another r e ctangle, me ans gene expr ession r elationship. F or example, the tr an- scription factor ST A T1 c ontr ols the mRNA expr ession of MIG. Final ly, the two ver- tic al lines on the left r epr esent the c el l membr anes that sep ar ate cytoplasm and extr a- c el l ular c omp onents and t he ve rtic al dashe d li ne on t he right r epr esents the c el l nu- cle ar membr ane. Mor e detaile d exp lanations of the KEGG p athways c an b e found at http: // www. genome. jp/ kegg/ document/ help_ pathwa y. html . 2.1. A sp atial-temp or al MRF mo del for the prior Pr ( X ) on the network. In ord er to d efine our prop osed hstMRF mo del, we first sp ecify the probabil- it y m o del for the laten t differen tial expr ession states X , taking in to account b oth temp oral dep en d ency o ver time and the spatial dep endency o v er the net work. Sp ecifically , for the initial time p oin t 0, we define an auto-logistic mo del [Besag ( 1972 , 1974 )] as P r ( X g 0 | X g ′ 0 , g ′ ∈ N g ) = exp { X g 0 F 1 ( X g 0 ) } 1 + exp { F 1 ( X g 0 ) } , (2.1) where F 1 ( X g 0 ) = γ 0 + β 0 P g ′ ∈ N g (2 X g ′ 0 − 1), and γ 0 ∈ R and β 0 ≥ 0. Th is mo del, whic h is equiv alen t to that assumed in W ei and Li ( 2007 ), assumes that at the initial time p oin t 0, the conditional differen tial expression state 6 Z. WEI AND H. LI of a giv en gene g dep ends only on the differen tial expression states of its neigh b oring genes N g . F or the follo win g time p oin ts, we mo d el { x t : t = 1 , 2 , . . . , T } by a p -dimens io- nal v ector Mark o v c h ain with the follo wing tr ansition probabilit y: Pr ( x t | x t − 1 ) = 1 c t exp ( γ p X g =1 X g t + β 1 X g ∼ g ′ ∈ E ( X g t ⊕ X g ′ t ) (2.2) + β 2 p X g =1 ( X g t ⊕ X g ( t − 1) ) ) , where c t is the normalizing constan t, ⊕ is the XNOR op erator in the logic circuit, namely , it outpu ts 1 if the tw o inpu ts are the same, and 0 other- wise, γ ∈ R and β 1 ≥ 0 and β 2 ≥ 0 are the parameters that ind u ce spatial and temp oral dep end en cies of the differen tial expr ession states. F rom this transition probabilit y , we can deriv e (see the App end ix for details of the deriv ation), for eac h gene g , th e conditional d istribution of X g t as Pr ( X g t | x 0 , x 1 , . . . , x t − 1 , X g ′ t , g ′ 6 = g ) = exp { X g t F 2 ( X g t ) } 1 + exp { F 2 ( X g t ) } , (2.3) where F 2 ( X g t ) = γ + β 1 X g ′ ∈ N g (2 X g ′ t − 1) + β 2 (2 X g ( t − 1) − 1) . Note that this conditional probability dep ends on th e DES of its n eigh b or- ing genes and the DES of this gene at the previous data p oint. T ogether, the initial d istribution ( 2.1 ) and the conditional probability ( 2.3 ) define the probabilit y d istribution with p arameter Φ = ( γ 0 , β 0 , γ , β 1 , β 2 ) for the laten t differen tial expression states. 2.2. Gamma–G amma mo del for observe d gene expr ession data Y . T o finish the sp ecification of the hstMRF mo d el, we also n eed to defin e the densit y fu nction of the obser ved data Y giv en the laten t DES s X , h ( Y | X ). W e mak e the follo wing conditional indep endence assumption: h ( Y | X ) = T Y t =0 p Y g =1 f ( y g t | X g t ) , (2.4) where f ( y g t | X g t ) is the conditional d en sit y f unction of the observed expres- sion v alues of m + n samples for gene g at time t giv en the differential state X g t . F rom th e biological p oin t of view, it is plausible to think that the dif- feren tial expression states are more lik ely to b e dep endent o ver time. W e NETW ORK-BAS ED ANAL YSIS OF GENOMIC D A T A 7 therefore assume that the gene expression lev els o ver time are indep enden t giv en the different ial expression state s, whic h indu ce dep enden cy of the gene expression lev els o ver time. The same assu m ption wa s also made in Y uan and Kendziorski ( 2006 ) in their HMM formulat ion. In order to sp ecify f ( y g t | X g t ), w e pr op ose to u se the Gamma–Gamma (GG) mo del for gene exp r ession d ata [Newton et al. ( 2001 ) and Kendiziorski et al. ( 2003 )]. The same probabilit y mo d el was also us ed in W ei and Li ( 2007 ). Und er suc h a Gamma–Gamma mo d el, w e assume that the obser- v ation y g tc is a sample from a gamma distribution h a ving shap e parameter α > 0 and a mean v alue µ g , th us , with scale parameter λ i = α/µ i . F ollo win g Newton et al. ( 2001 ) and Kendiziorski et al. ( 2003 ), fixing α , w e assume that the qu an tit y λ i = α/µ i has a gamma distribution with shap e parame- ter α 0 and scale parameter v . Let Θ = ( α, α 0 , v ) b e the parameters used to sp ecify these t w o distributions. Und er this hierarchica l mo d el, Ken dziorski et al. ( 2003 ) deriv ed the follo win g conditional density fu nction for the gene expression data: f ( y g t | X g t ; Θ ) = K 1 K 2 ( Q m + n j =1 y g tj ) α − 1 ( v + y g t.m ) mα + α 0 ( v + y g t.n ) nα + α 0 , if X g t = 1, K ( Q m + n j =1 y g tj ) α − 1 ( v + y g t.m + y g t.n ) ( m + n ) α + α 0 , if X g t = 0, (2.5) where y g t.m = m X j =1 y g tj , y g t.n = m + n X j = m +1 y g tj and K 1 = v α 0 Γ( mα + α 0 ) Γ m ( α )Γ( α 0 ) , K 2 = v α 0 Γ( nα + α 0 ) Γ n ( α )Γ( α 0 ) , K = v α 0 Γ(( m + n ) α + α 0 ) Γ m + n ( α )Γ( α 0 ) . T ogether, mo dels ( 2.1 ), ( 2.2 ) and ( 2.4 ) define a hs tMRF mo del for MTC gene expression data with parameters Φ and Θ . Sim ilar to the HMM ap- proac h of Y uan and Kend ziorski ( 200 6 ), the mo del also assumes that the expression states of one particular gene o v er time follo w a h idden Marko v c hain. While all genes in the HMM approac h follo w the same HMM mo del, eac h gene in the hstMRF mo del has its o w n sp ecific HMM determin ed by its regulatory neighborin g genes. T h e hstMRF mo del r educes to the HMM when all the genes in the net works are indep en d en t. It is also clear that the hMRF mo del in W ei and Li ( 2007 ) is a sp ecial case of the h s tMRF mo d el, when there is only one time p oint . 8 Z. WEI AND H. LI 3. P arameter estimation using ICM and Viterbi algorithms. W e p rop ose the follo wing algorithm based on the ICM algorithm of Besag ( 1986 ) and the Viterbi algorithm [Rabiner ( 1989 )] to estimate the Φ p arameter in the hidden spatial-temp oral MRF mo del and the Θ parameter in the Gamma– Gamma mo del. The algorithm in volv es the follo w ing iterativ e steps: 1. Obtain an initial estimate ˆ X of the tr ue state X ∗ , using s imple t wo sample t-tests at eac h time p oin t. 2. Estimate Φ by the v alue ˆ Φ whic h m aximizes the follo wing pseudolik e- liho o d lik eliho o d [Besag ( 1974 )] l ( ˆ X ; Φ ) b ased on the cur ren t ˆ X : l ( X ; Φ ) = p Y g =1 exp { X g 0 F 1 ( X g 0 ) } 1 + exp { F 1 ( X g 0 ) } × T Y t =1 p Y g =1 exp { X g t F 2 ( X g t ) } 1 + exp { F 2 ( X g t ) } . Maximizing this equ ation could b e pr o cessed to obtain the estimate ˆ Φ by a standard logistic regression soft ware routine suc h as glm in R. Th e rationale of using th e pseudolik eliho o d for u p dating the parameter Φ is that it is diffi- cult to ev aluate th e full lik eliho o d due to an unknown normalizing constan t in the lik eliho o d function. 3. Estimate Θ b y the v alue ˆ Θ , w hic h maximizes the conditional lik eliho o d h ( Y | ˆ X ; Θ ) [equation ( 2.4 )]. 4. Up date ˆ X based on the curr en t ˆ Φ and ˆ Θ using a com b ination of the ICM algorithm and the Viterbi algorithm [Rabiner ( 1989 )]. Sup p ose that ˆ X is the cur ren t estimate of the true X ∗ ; our goal is to up d ate the curren t DES X g · ≡ ( X g 0 , X g 1 , . . . , X g T ) of gene g in ligh t of all av ailable information. Sp ecifically , we up date X g · b y maximizing the conditional probabilit y w ith resp ect to X g · , giv en the observ ed data Y and th e cur ren t DES of all other genes ˆ X V \ g . This conditional probabilit y can b e w r itten as Pr ( X g · | Y , ˆ X V \ g ) ∝ f ( Y g | X g · ) Pr ( X g · | ˆ X V \ g ) . F or a giv en gene g , the most probable X g · can b e obtained us ing the Viterbi algorithm with the trans ition probabilit y d efined as in equation ( 2.3 ). When applied to eac h gene in turn, this pro cedure d efines a sin gle cycle of the ICM algorithm. 5. Go to step 2 for a fixed num b er of cycles or until appro ximate con v er- gence of ˆ X . As n oted b y Besag ( 1974 ), since Pr ( ˆ X | Y ) = Pr ( ˆ X g · | Y , ˆ X V \ g ) Pr ( ˆ X V \ g | Y ) , Pr ( ˆ X | Y ) nev er decreases at an y stage and ev ent ual conv ergence is assur ed. In our implemen tation, w e stop the iteratio n s when the maximum of the relativ e c hanges of the parameter estimates is smaller than a small v alue ǫ , NETW ORK-BAS ED ANAL YSIS OF GENOMIC D A T A 9 whic h is set to b e 0.01 for simulatio n s and 0.002 for the real data analysis. The con verged ˆ X are th en taken to b e the estimate of the true differential expression states. Th ese estimate s can then b e mapp ed bac k to th e net- w ork to id en tify the sub net works at a give n time, wh ic h are defined as those connected genes that sh o w differen tial expressions b et we en the t w o exp eri- men tal conditions. W e can then examine these DES o ver time to obtain a temp oral view of the s ubnet w orks with resp ect to the differential expression states. 4. Sim ulation study . 4.1. Performanc e an d c omp arisons with other metho ds. W e condu cted sim u lation studies to ev aluate the p rop osed pro cedure and to compare the results with other pr o cedures, includin g the HMM approac h [Y uan and Kendziorski ( 2006 )], whic h only tak es into accoun t the time dep end en cy of differential expression states, and th e hMRF mo del [W ei and Li ( 2007 )], whic h only tak es into accoun t th e dep enden cy of the differen tial expression states on th e net w ork. W e simulated data based on the regulatory n et wo rk of path wa ys provi ded b y KEGG. Sp ecifically , 33 human regulatory path- w ays w ere obtained f r om the KEGG database [Decem b er (2006)] includ ing only the gene–gene regulatory relations an d exclud ing comp ound–gene and comp ound–comp oun d relations. The r emainin g gene–gene regulatory data w ere repr esented as an und irected graph where eac h no d e represents a gene and t wo no des are connected by an edge if there is a regulatory relation b e- t wee n them. L o ops (no des connected to themselv es) w er e eliminated. This resulted in a graph with 1668 n o des and 8011 edges. Our first simulation follo w s that of Y uan and Kendziorski ( 2006 ) where only the d ep endency of the d ifferen tial expression states o ve r time was s im- ulated. Sp ecifically , the GG mixtu r e mo del is sp ecified at eac h time p oint with p arameter Θ = (10 , 0 . 9 , 0 . 5) and transition probabilities of d ifferen tial states o ver time are d efi ned as Pr ( X g t = D E | X g ( t − 1) = D E ) = 0 . 7 , Pr ( X g t = D E | X g ( t − 1) = E E ) = 0 . 1 for t = 1 , . . . , 5 wh ile for th e fir st time p oin t Pr ( X g 0 = D E ) = 0 . 1 . There are 6 time p oints in total and 3 replicates for eac h condition at eac h time p oin t. W e sim ulated 10 0 suc h datasets and eac h set con tains 1,66 8 genes on the KEGG regulatory n et wo rk. F or the hstMRF and the hMRF approac hes, w e used the KEGG p athw a y structures in our analysis. The a ve rage sensitivit y , sp ecificit y and the observ ed false disco v ery rate (FDR) for the p rop osed h stMRF, HMM and hMRF ov er the 100 simulate d datasets 10 Z. WEI AND H. LI at eac h of the 6 time p oin ts are sh o wn in the first three columns of T able 1 , where the sensitivit y is calculated as the av erage ov er the 100 rep licatio ns of the fraction of DE genes correctly identified by the metho d; sp ecificit y is th e a v er age of the EE genes correctly id en tified; and the false d iscov ery rate (FDR) is the a v erage of the ratio of the n umb er of false p ositiv es to the num b er of the genes id en tified as DE. W e observ ed that the pr op osed hstMRF mo del p erforms almost iden tically to th e HMM mod el in sensitivit y , sp ecificit y and FDR. I n addition, b oth the hstMRF and th e HMM pr o cedure p erformed muc h b ette r than the hMRF mod el; th e increase of sensitivit y can b e more than 10% dep ending on the time p oin ts. F u rther, the increase in sensitivit y do es not greatly increase the observ ed FDR; the difference among differen t metho ds is within 2%. The second sim u lation is similar to that in W ei and Li ( 2007 ), where only the spatial d ep endency of the DES wa s simulat ed u sing the hMRF mo del. F or eac h time p oint, we r an d omly c hose 9 path wa ys, initialize d the genes in these path w ays to b e DE and the rest of the genes to b e EE, and then we p erformed s amp ling fiv e times iterativ ely conditional on the current sample of gene s tates to ac hiev e the fi nal sample of gene states acco rding to equation ( 2.1 ) w ith γ 0 = − 2 and β 0 = 2 . Again, the GG mixture mo del with parameter Θ = (10 , 0 . 9 , 0 . 5) is assum ed w ith three replicates in eac h cond ition. The results from differen t pr o cedures are presented in the second thr ee columns of T able 1 . W e observed that the hstMRF mo del p erform s similarly to the hMRF mo del an d b oth pro cedures outp erform the HMM in sensitivity at all time p oin ts and the increase of s en sitivit y can b e as large as 14% dep ending on the time p oin ts. The increase in sens itivit y do es not inv olv e an increase in the FDR. Th e hstMRF pr o cedure has either considerably lo we r FDRs (time p oin ts 0, 1, 2 and 5) than HMM or comparable FDRs (time p oints 3 and 4). The last simulati on aims to sim ulate the differen tial states with b oth sp a- tial and temp oral dep endencies. In particular, for the 33 KEGG path wa ys, w e randomly pic ked 8 path w ays at th e 1st time p oint (time p oint 0) to b e the DE path w ay in wh ich all the genes we re in itially set as DE genes. F or time p oin ts 1 to 5, the DE/EE pathw a ys w ere sim ulated according to the follo wing transition probabilities: Pr (path wa y it = D E | pathw a y i ( t − 1) = E E ) = 0 . 1 , Pr (path wa y it = D E | path wa y i ( t − 1) = D E ) = 0 . 7 . Then for eac h sim ulated d ataset, for eac h time p oin t, w e first set all genes in the DE pathw a ys to b e DE and then p erformed sampling fiv e times based on the current gene states, according to equation ( 2.1 ) with γ 0 = − 2 and β 0 = 2. Th e r esu lts from different pro cedur es are presented in the last three columns of T able 1 . W e observ ed th at the hstMRF mo del resulted in h igher NETW ORK-BAS ED ANAL YSIS OF GENOMIC D A T A 11 T able 1 Comp arison of p erformanc e in terms of sensitivity (SEN), sp e ci fici ty (SPE) and f al se disc overy r ate (FDR) of thr e e differ ent pr o c e dur es b ase d on 100 r eplic ations f or thr e e differ ent sc enarios. Standar d err ors r ange fr om 0. 018 to 0.07 with a me dian of 0. 027 for the sensitivity, fr om 0.001 to 0.004 with a me dian of 0.003 f or the sp e cificity and f r om 0.005 to 0. 023 with a me dian of 0.009 for the FDR [ se e Supplementary materials for details, W ei and Li ( 2008 )]. hstMRF: pr op ose d hi dden sp atial-temp or al Markov r andom field mo del; HMM: hidden Markov mo del; hM R F: hidden Markov r andom file d mo del T emp oral dep en dency Spatial dep enden cy Spatial-temp oral dep end e ncy hstMRF HMM hMRF h stMRF H MM hMRF hstMRF HMM hMRF t0 0 . 66 0 . 67 0 . 62 0 . 85 0 . 71 0 . 85 0 . 90 0 . 72 0 . 88 S t1 0 . 71 0 . 71 0 . 63 0 . 76 0 . 71 0 . 73 0 . 79 0 . 79 0 . 67 E t2 0 . 74 0 . 74 0 . 63 0 . 73 0 . 70 0 . 76 0 . 82 0 . 81 0 . 80 N t3 0 . 75 0 . 75 0 . 64 0 . 75 0 . 71 0 . 71 0 . 82 0 . 77 0 . 77 t4 0 . 75 0 . 75 0 . 65 0 . 80 0 . 69 0 . 79 0 . 82 0 . 80 0 . 69 t5 0 . 71 0 . 71 0 . 66 0 . 78 0 . 72 0 . 83 0 . 79 0 . 76 0 . 69 t0 1 . 00 1 . 00 1 . 00 1 . 00 0 . 99 1 . 00 0 . 99 0 . 99 1 . 00 S t1 1 . 00 1 . 00 1 . 00 1 . 00 0 . 99 1 . 00 0 . 97 0 . 96 1 . 00 P t2 0 . 99 0 . 99 1 . 00 0 . 99 0 . 99 0 . 99 0 . 99 0 . 98 1 . 00 E t3 0 . 99 0 . 99 1 . 00 0 . 99 0 . 99 0 . 99 0 . 97 0 . 99 0 . 99 t4 0 . 99 0 . 99 1 . 00 0 . 99 0 . 99 1 . 00 0 . 99 0 . 99 1 . 00 t5 0 . 99 0 . 99 1 . 00 0 . 99 0 . 99 0 . 99 1 . 00 0 . 99 1 . 00 t0 0 . 021 0 . 025 0 . 016 0 . 007 0 . 026 0 . 009 0 . 016 0 . 027 0 . 013 F t1 0 . 027 0 . 028 0 . 020 0 . 012 0 . 024 0 . 012 0 . 089 0 . 127 0 . 018 D t2 0 . 031 0 . 031 0 . 018 0 . 01 5 0 . 025 0 . 019 0 . 014 0 . 031 0 . 009 R t3 0 . 030 0 . 030 0 . 017 0 . 028 0 . 026 0 . 016 0 . 060 0 . 023 0 . 027 t4 0 . 030 0 . 028 0 . 017 0 . 026 0 . 028 0 . 020 0 . 036 0 . 039 0 . 014 t5 0 . 026 0 . 025 0 . 017 0 . 011 0 . 025 0 . 019 0 . 020 0 . 028 0 . 014 sensitivit y and similar sp ecificit y in ident ifying the DE genes o ver time, as compared to the HMM or the h MRF mo d els. The FDR rates are comparable to the HMM pro cedure w ith a sligh tly higher FDR rate at time p oin t 3, 0.06 v ersu s 0.023 and 0.027 for HMM and hMRF metho ds , resp ectiv ely . 4.2. Sensitivity to missp e cific ation of the network structur e. Due to the fact th at our cu rrent kno wledge of biologica l net works is n ot complete, in practice, it is p ossible that the net w ork structures that w e use for net work- based analysis are missp ecified. The missp ecificat ion can b e du e to either the true edges of the net w orks b eing m iss ed or the wron g ed ges b eing in clud ed in the net work, or b oth of th ese t w o scenarios. W e p erform ed sim u lation studies to ev aluate ho w sensitiv e the results of the hstMRF approac h are to these three t yp es of missp ecificatio ns of the net work structures. W e used the same d atasets of 100 replicates as in th e previous section (last 3 column s of 12 Z. WEI AND H. LI T able 1 ), b ut used different missp ecified n et wo rk s tr uctures when we fitted the hstMRF mo del. F or the first scenario, we randomly remo ve d 801 (10%), 2403 (30%) and 4005 (50%) from the 8011 true edges f r om the true KEGG net wo rks wh en w e fit the hstMRF mo del, resp ectiv ely . F or th e s econd scenario, we randomly added app ro ximately 801, 2403 and 4005 n ew edges to the KEGG n et wo rk, resp ectiv ely . Finally , for the third scenario, we randomly selected 90%, 70% and 50% of th e 801 1 true edges and also randomly add ed appro ximately 801, 2403 and 4005 new edges to the net w ork, resp ectiv ely , so that the total n u m b er of edges r emained appro xim ately 8011 . The results of the simula- tions ov er 100 replications are summarized in T able 2 . As exp ected, sin ce the true num b er of DE genes is sm all, the s p ecificities of the hs tMRF pro cedu re remain v ery high and are the same as wh en the true net work stru ctur e was used. W e also observed that the FDR rates also remained almost the same as when the true structure wa s used (see T able 1 ). How ev er, we observed some decreases in sensitivit y in id en tifying th e true DE genes, esp ecially at time p oint t 0 . This is exp ected, since results in T able 1 indicate that, for the d ata w e sim u lated, the net work structure p ro vides the most information for the DES at time p oint t 0 . F or other time p oin ts, temp oral dep endency con tribu tes most of the in formation. It is worth p oin ting out that ev en wh en the net w ork structure is largely m iss p ecified as in scenario 3, the results f rom the hstMRF mo d el are still comparable to those obtained from the HMM approac h w h ere the netw ork structure is not utilized (see column 8 of T able 1 ). These s im ulations seem to indicate that the results of the h s tMRF m o del are not to o sensitiv e to the missp ecificatio n of the n et wo rk structure unless the structure is greatly missp ecified. 5. Application to systemic inflammation gene expression study in h u- mans. W e presen t results f rom an analysis of th e systemic infl ammation time course gene expression data in human whole blo o d leukocytes rep orted in Calv ano et al. ( 2005 ), includ ing time cours e gene expression profiles on eigh t health y male and female sub jects b etw een 18 and 40 y ears of age. Using Affymetrix c hips, Calv ano et al. ( 2005 ) p rofiled the gene exp r ession lev els in h uman leukocytes immediately b efore (0 h) and at 2, 4, 6, 9 and 24 h after the in tra ve nous administration of bacterial endoto xin for f our health y h u man s u b jects ( m = 4, one female and three males). F our additional sub- jects ( n = 4, one female and thr ee males) without endoto x in adm inistration w ere also profiled under identic al conditions and w ere used as the con trols. The robust m u lti-arra y (RMA) p ro cedure [Ir izarry et al. ( 2003 )] w as used to obtain the gene exp r ession measures. T o p erform n et wo rk-based analysis of the data, w e merged the gene expr ession data with the 33 KEGG regulatory path wa ys and identified 1533 genes on the Hu133A chip that can b e found in the 1668-nod e KEGG netw ork of 33 pathw a ys. Instead of considering all the NETW ORK-BAS ED ANAL YSIS OF GENOMIC D A T A 13 T able 2 Comp arison of p erformanc e in terms of sensitivity (SEN), sp e ci fici ty (SPE) and f al se disc overy r ate (FDR) of the hstMRF pr o c e dur e b ase d on 100 r eplic ations when the network structur e i s missp e cifie d. Standar d err ors r ange fr om 0. 018 to 0.031 with a me dian of 0.024 for the sensitivity, fr om 0. 002 to 0.007 with a me dian of 0.004 for the sp e cificity and fr om 0.006 to 0.026 with a me dian of 0.011 for the FDR [ se e Supplementary materials for details, W ei and Li ( 2008 )]. DEL: r andomly deleting 10%, 30% and 50% of the true e dges of the network; ADD: r andomly adding appr oxim ately 801 (10%), 2403 (30%) and 4005 (50%) new e dges to the network; DEL + ADD: r andomly cho osing 90%, 70% and 50% of the true e dges and r andomly adding 10%, 30% and 50% new e dges to the network 10% 30% 50% DEL ADD DEL + ADD DEL ADD DEL + ADD DEL ADD DEL + ADD t0 0 . 8 9 0 . 88 0 . 88 0 . 88 0 . 86 0 . 82 0 . 86 0 . 84 0 . 78 S t1 0 . 79 0 . 79 0 . 79 0 . 79 0 . 78 0 . 78 0 . 79 0 . 78 0 . 78 E t2 0 . 8 2 0 . 82 0 . 82 0 . 82 0 . 81 0 . 81 0 . 81 0 . 81 0 . 80 N t3 0 . 82 0 . 82 0 . 82 0 . 82 0 . 82 0 . 81 0 . 81 0 . 82 0 . 79 t4 0 . 8 2 0 . 82 0 . 82 0 . 82 0 . 82 0 . 82 0 . 82 0 . 82 0 . 81 t5 0 . 7 9 0 . 79 0 . 78 0 . 79 0 . 78 0 . 77 0 . 78 0 . 77 0 . 75 t0 0 . 9 9 0 . 99 0 . 99 0 . 99 0 . 99 1 . 00 0 . 99 0 . 99 0 . 99 S t1 0 . 97 0 . 97 0 . 97 0 . 97 0 . 98 0 . 97 0 . 97 0 . 98 0 . 97 P t2 0 . 9 9 0 . 99 0 . 99 0 . 99 0 . 99 0 . 99 0 . 99 0 . 99 0 . 99 E t3 0 . 9 7 0 . 97 0 . 97 0 . 97 0 . 97 0 . 97 0 . 97 0 . 97 0 . 98 t4 0 . 9 9 0 . 99 0 . 99 0 . 99 0 . 99 0 . 99 0 . 99 0 . 99 0 . 99 t5 1 . 0 0 1 . 00 1 . 00 1 . 00 1 . 00 1 . 00 1 . 00 1 . 00 1 . 00 t0 0 . 0 16 0 . 015 0 . 015 0 . 017 0 . 013 0 . 013 0 . 017 0 . 012 0 . 015 F t1 0 . 0 90 0 . 088 0 . 088 0 . 093 0 . 082 0 . 084 0 . 094 0 . 079 0 . 090 D t2 0 . 014 0 . 014 0 . 014 0 . 014 0 . 014 0 . 016 0 . 015 0 . 015 0 . 018 R t3 0 . 06 0 0 . 060 0 . 059 0 . 059 0 . 058 0 . 054 0 . 056 0 . 057 0 . 043 t4 0 . 037 0 . 036 0 . 036 0 . 037 0 . 036 0 . 037 0 . 038 0 . 036 0 . 040 t5 0 . 020 0 . 020 0 . 020 0 . 021 0 . 020 0 . 020 0 . 022 0 . 020 0 . 022 14 Z. WEI AND H. LI genes on the Hu133A c h ip, we only fo cus analysis on these 1533 genes and aim to ident ify whic h genes and whic h s ubnet w orks of the KEGG netw ork of 33 pathw a ys are p erturb ed or activ ated d uring the resp ons e to endoto xin. 5.1. R esults f r om the hstMRF mo del. The hstMRF mo del iden tified 35, 260, 326 , 292, 258 an d 127 DE genes at time p oints 0 h, 2 h, 4 h, 6 h , 9 h and 24 h, resp ectiv ely . The p arameter estimates were γ 0 = − 3 . 76, β 0 = 0 . 000 01, γ = − 0 . 71, β 1 = 0 . 013 and β 2 = 2 . 14, indicating stronger time dep end ency than netw ork d ep endency of gene d ifferen tial expression states. Th e od ds ratio in f av or of b eing a DE gene is exp(2 × 0 . 013) = 1 . 02 if one of its neigh b or genes is DE v ersus EE and exp (2 × 0 . 013 × 10) = 1 . 30 if 10 of its n eigh b oring genes are all DE ve rsus all EE, conditional on the rest of the graph and assuming that all other DES are the same. I n contrast , the o dds ratio in fav or of b eing a DE gene is exp(2 × 2 . 14) = 72 . 24 if this gene is a DE gene v ersu s a E E at the previous time p oin t assuming that the DES of its n eigh b orin g genes remain the same. A total of 362 unique DE genes w ere different ially expressed at least once at one of the six time p oin ts. Among these 362 DE genes, 262 o f them are linke d to at least one other g ene on th e KEGG net work and 100 are isolated. The 32 6 DE ge nes at time p oin t 4 h are from 31 out of the 33 pathw a ys, indicating that the resp onse to endoto xin administration in blo o d leukocytes can b e v iewed as an in tegrated cell-wide resp onse. D A VID’s enrichmen t analysis [Dennis et al. ( 2003 )] sho w ed that the thr ee most significant ly enriched pathw a ys at time 4 h are the T oll- lik e r eceptor (T L R) signaling pathw a y , the Ap optosis pathw a y and the T cell receptor signaling p ath wa y with the p -v alues of 4.2 × 10 − 5 , 8.1 × 10 − 4 and 2.1 × 10 − 3 , resp ectiv ely . As a comparison, at the 2 h time p oint, T L R path wa y wa s rank ed only 6th with a p -v alue 0 . 065. Suc h a n increase in the T L R signaling pathw a y’s signifi cance is consisten t with its w ell-known critical role in innate immunit y [Ad er em and Ulevitc h ( 2000 ), T ak eda et al. ( 2003 ) and Han an d Ulevitc h ( 2005 )]. T o d emonstrate the sp atial d ep endency of the DES of genes on th e TLR path wa y , Figure 1 p resen ts the structur e of the KEGG TLR p athw a y and the DES of the genes on this pathw a y at 4 h after the endoto xin administration, in wh ich the DE genes are lab eled in ligh t shade. On this pathw a y , in v ad- ing b acterial factors s uc h as lip opolysacc h arides (LP S , endoto xin ) activ ate innate imm unit y , as well as stimulat e the antig en -sp ecific immune resp onse and trigger the in flammatory resp onse [T ak eda et al. ( 2003 )]. The signals stim ulated b y these factors are recognize d by CD14, whic h in turn activ ates TLR4. MD-2 is a secreted protein that binds to the extracellular domain of TLR4 and is im p ortan t in its signaling [T ak eda et al. ( 2003 ) and Barto n and Medzhito v ( 2003 )]. Ou r analysis indicated that these thr ee genes are d iffer- en tially expressed together with TLR2 receptor. It is no w un dersto o d th at NETW ORK-BAS ED ANAL YSIS OF GENOMIC D A T A 15 all TLRs activ ate a common signaling path wa y that culminates in the activ a- tion of n u clear factor κ B (NF- κ B), as w ell as the mitogen-act iv ated protein kinases (MAPKs) extracel lular signal-regulated kinase (ERK), p 38 and c- Jun N-terminal kinase (JNK) [Barton and Medzhito v ( 2003 )]. This fact is clearly demonstrated by our analysis results: we obser ved that MKK36, NF- κ B, p38 and JNK we re all differentia lly expressed. After th e signals arriv e at the transcriptional factors AP-1 and NF- κ B, they are activ ated and translo- cated into the nucleus. W e observed that the do wn -stream genes of these transcription factors, includ ing inflammatory cytokines (IL-1 β , RANTES, MIP-1 α , MIP-1 β ), costim ulatory molecules (C D86) w ere different ially ex- pressed, consisten t w ith the activ ation of innate immunit y after administra- tion of endoto xin [Aderem and Ulevitc h ( 2000 ), T ak eda et al. ( 2003 ) and Han and Ulevitc h ( 2005 )]. Ho we v er, we did not observe differentia l expr ession of genes of the IL-1 receptor-associated kinase (IRAK) f amily , in clud ing th e serine–threonine ki- nases IRAK1 and IRAK4 whic h are inv olv ed in the phosphorylation and acti- v ation of tumor necrosis f actor (TNF) receptor-asso ciated factor 6 (TRAF6), whic h w as also not differen tially expressed. Analysis of cells f r om mice lac k- ing MyD88 has d emonstrated that TLR4 is capable of inducing certain sig- naling p athw a ys indep enden t of the MyD88 adaptor [T ak eda et al. ( 2003 ) and Barton and Medzhito v ( 2003 )]. It is in teresting to n ote that our analy- sis in dicated that the T oll/in terleukin-1 receptor (TIR) domain-con taining adaptor-inducing IFN- β (TRIF), whic h functions downstream of TLR4 [Bar- ton and Medzhito v ( 2003 )], w as differentia lly expressed. TRIF is kn own to b e r esp onsible for the ind uction of in terferon (IFN)- α and IFN- β genes [Bar- ton and Medzhito v ( 2003 )], b oth of whic h w ere observ ed to b e differen tially expressed. The indu ction of IFN α/β genes by TLR4 further leads to acti- v ation of a k ey transcription factor interferon r egulatory factor 3 (IFR3), whic h in turn led to differen tial exp ressions of the c hemokines (IP-10 , I- T A C). Th is s u ggests that the TRIF path wa y m ay play an imp ortan t role in resp onse to endoto xin. T o fur th er explore the temp oral changes in KEGG s ubnet w orks, we fo- cused our analysis on th e 262 connecting DE genes. W e divid ed these 262 genes in to n ono verla pping group s b ased on the fi r st time p oin t at w hic h th e gene b ecame DE b et w een the t wo groups, that is, the genes in group 1 are DE on 0 h, those in group 2 were DE on 2 h but not on 0 h, and those in group 3 we re DE on 4 h but n ot on 0 h or 2 h. Other groups can b e similarly d efi ned. The genes th at w ere DE at 24 h w ere also DE at least once at the previous time p oin ts. In add ition, 9 DE genes we re to b e consis- ten tly ov er-expressed or un d er-expressed in th e treatmen t group across all the time p oints. The r emaining 253 genes includ e 9 , 160 , 70 , 10 and 4 genes that w ere observ ed to firs t b ecome DE at time p oints 0 h, 2 h, 4 h , 6 h and 9 h, resp ecti v ely . W e mapp ed these genes bac k to th e K EGG gene net w ork 16 Z. WEI AND H. LI Fig. 2. T emp or al changes of gene expr ession levels in blo o d leuko cytes on subnetworks of the KEGG p athways, showing a pr op agating and r esolving pr o c e dur e over time [0 h , 2 h , 4 h , 6 h , 9 h and 24 h fr om (a) to (f ) ]. Up-r e gulate d genes in the endotox in gr oup ar e shown i n r e d, down-r e gulate d genes in the endotoxin gr oup ar e shown in blue and e qual ly expr esse d genes ar e shown in gr e en. NETW ORK-BAS ED ANAL YSIS OF GENOMIC D A T A 17 and sho wed the temp oral r esp onse of gene exp ression in Figure 2 on the KEGG subn et wo rk. A clear temp oral netw ork resp onse can b e observed by highligh ting the transien t and self-limiting nature of this resp onse. A large n u m b er of genes are differen tially expressed from time p oin t 2 h and the time p oin t 4 h had the most num b er of the DE genes, which rep r esen ts a quic k resp ons e of the human immune system to the in tru sion of endoto xin [Aderem and Ulevitc h ( 2000 ) and C alv ano et al. ( 2005 )]. W e also observ ed that a num b er of transcrip tion factors we re differentia lly expressed dur in g time p erio d 4–6 h after endoto xin in jection, including b oth those that activ ate and th ose that inhibit the in nate imm une resp ons e. T he activ ating genes included th e signal transd ucer and activ ators of trans cr ip - tion genes (ST A T1, S T A T3, S T A T4, S T A T5A, ST A T5B) and the inhib iting genes included the suppr essor of cytokine signaling genes (S OCS1, SOC S2, SOCS3). Th ere w as al so a dela y (4–6 h ) in increased m R NA a bund an ce of secreted and membrane-associated p roteins inv olv ed in the inflammatory resp onse, including IL1RAP , IL1R2, IL1A, IL1B and IL1R1. T ogether, the temp oral mo du lation of these DE genes con trols the in nate imm une resp onse in human leuk o cytes that progresses f rom an acute proinfl ammatory phase to un en cum b ered counter regulation, concluding with almost full reco very and a normal cellular state [Calv ano et al. ( 2005 )]. 5.2. Comp arison with the r esults fr om the HMM . As a comparison, the HMM assumin g h omogeneous transition probabilities ident ified 45, 227, 355 , 342, 302 and 123 DE genes on the KEGG netw ork at time p oin ts 0 h, 2 h, 4 h, 6 h, 9 h and 24 h, resp ectiv ely . Th e DE genes iden tified at th e 0 h and the 24 h are very similar b et w een the t w o differen t approac h es. T able 3 sho w s the n umber of DE and EE genes iden tified by the h stMRF and the HMM metho ds at 2 h , 4 h, 6 h and 9 h . While the sets of DE genes iden tifi ed b y the h stMRF and the HMM methods largely o v erlap, whic h is w h at we should exp ect b ecause of th e strong temp oral effect, there are some d ifferences in DE/EE genes identified, indicating th e KEGG net work structure in d eed has imp act on identi fying th e DE genes. A t the 2 h after endoto xin administr ation, the hstMRF m o del id en tified 35 DE genes that w ere missed b y the HMM. Plots of the a verage expr ession lev els of these 35 genes at 0 h , 2 h and 4 h , ind icating that most of them are differen tially expressed at the 2 h [see Supp lemen tary m aterials , W ei an d Li ( 2008 )]. As an example, Figure 3 sho ws the a v erage expr ession lev els of four of these genes at 0 h, 2 h and 4 h. One reason that the HMM did not id en tify these genes is that all these genes were at the EE state at time 0 h and the estimated transition pr obabilit y from the EE state to DE state is only 0.06. I n cont rast, at the time p oint s 4 h, 6 h and 9 h, there w ere 32, 49 and 43 DE genes identified by the HMM but missed by the h stMRF mo del, resp ectiv ely . Ho wev er, we observ ed that the HMM p osterior probabilities of 18 Z. WEI AND H. LI T able 3 A c omp arison of the numb ers of D E and EE genes identifie d by hstMRF and HMM at the 2 h , 4 h , 6 h and 9 h of the systemic inflamm ation gene expr ession exp eriments hstMRF 2 h 4 h 6 h 9 h EE DE EE DE EE DE EE DE EE 1271 35 117 3 5 1191 0 1231 0 HMM DE 2 225 32 323 49 29 3 43 259 b eing a DE gene for these genes are r elativ ely small, with a m edian v alue of 0.64, 0.64 and 0.67, resp ectiv ely . In addition, w e also obs er ved that more than 75% of the neigh b oring genes of th ese DE genes are EE. The h stMRF mo del to ok in to accoun t the differentia l exp r ession states of the neigh b oring genes in estimating the p osterior probabilities and inferred these DE genes as the EE genes. T o fur th er demonstrate the d ifferences in genes id en tified by th e HMM and the hstMRF metho ds, we p erformed analysis f or d ata measur ed at the 0 h, 2 h and 24 h. Th e parameter estimates for the hstMRF mo del were β 1 = 0 . 037 and β 2 = 0 . 37, ind icating less s tr onger temp oral effects than our previous analysis. The hstMRF mo del id en tified 57 more DE genes at th e 2 h than the HMM, of whic h 56 were EE at the 0 h and 24 h. Plots of the av erage expression profiles indeed sho w that all these 56 genes see m to sho w differentia l expression patterns at th e 2 h and equally expr ession patterns at the 0 h and 24 h [see Supp lemen tary materials , W ei and Li ( 2008 )]. Under the h stMRF mo d el, the DE neigh b oring genes increased the p osterior probabilit y of b eing a DE gene for these 56 genes. On av erage, these 56 DE genes ha ve 2.4 more DE neigh b oring genes than w hat the EE genes ha ve . Finally , it is interesti ng to n ote that 32 out of these 57 genes w ere iden tified as DE by the HMM if data from all the time p oin ts w ere used. 6. Conclusion and discussion. W e ha ve prop osed a hidden spatial-temp oral MRF mo del that utilizes the gene regulatory net works and temp oral infor- mation sim u ltaneously to ident ify DE genes in the analysis of microarray time course gene exp ression data. S im u lation studies sho w that our metho ds outp erform those m etho ds capturin g only regulatory dep endence or captur - ing only time d ep endence in sensitivit y , sp ecificit y and false disco v ery rate. W e applied our metho d to analyze th e MTC data of systemic inflammation in h u mans. The subpath w ays/subnet wo r ks we identi fied at different time p oint s s ho w that the innate immune resp onse in a human mo del pr ogresses NETW ORK-BAS ED ANAL YSIS OF GENOMIC D A T A 19 Fig. 3. Aver age gene expr ession me asur es fr om the RMA pr o c e dur e (in log 2 sc ale) ( ± 1 SE) (y-axis) at the 0 h , 2 h and 4 h (x-axis) for the four DE genes that wer e identifie d by the hstMRF mo del but m isse d by the HMM mo del. ∆ : gr oup r e c eiving the endotoxin administr ation; o : c ontr ol gr oup. from an acute proinfl ammatory phase to unencumbered counte r regulation, concluding w ith almost fu ll reco v ery and a n ormal cellular state, consis- ten t with the kn o wn characte r istics of the human inn ate imm un e resp onse [Aderem and Ulevitc h ( 2000 ), T akeda et al. ( 2003 ) and C alv ano et al. ( 2005 )]. Our analysis also confir med the cr itical role of the T oll-lik e receptor path wa y in innate immune resp on s e and suggested that th e signaling path w ay du r- ing the human resp on s e to endoto xin migh t b e through the TRIF pathw a y [Barton and Medzhito v ( 2003 ]. 20 Z. WEI AND H. LI In this pap er we analyzed the systemic inflammation MT C data using KEGG path wa ys and aimed to iden tify the KEGG path wa ys affected b y administration of endoto xin. Ho w ever, th e prop osed metho ds c an b e ap- plied to an y other net w ork of pathw a ys. An imp ortan t question is to decide whic h path wa ys one should use in analyzing the MTC d ata. This p artially dep ends on the scien tific questions to b e addressed. If an inv estigator is only in terested in a particular pathw a y , the prop osed m etho d can b e applied to that particular path wa y . If an in vestig ator is in terested in fully exploring his/her data and all av ailable pathw a ys, one should use a large collection of path w a ys, for exa mple, the pathw a ys collect ed by P athw a y C ommons ( http://w ww.pathwa ycommons. org/pc/ ) or bu ild the net w ork of path w ays using some existing net work construction to ols [Basso et al. ( 2005 )]. I t should also b e noted that our prop osed m etho ds can in clude all the genes prob ed on microarra y b y simp ly addin g isolated no d es to the graphs. Another related issue is that our kno wledge of path wa ys is not complete and ca n p ote n- tially include err ors or missp ecified edges on the n et wo rks. Although our sim u lations d emonstrate that our metho ds are not too s ensitiv e to the mis- sp ecification of th e net work structures, the effects of m issp ecification of the net work on the results deserv e fu rther researc h. One p ossible solution to this problem is to fi rst c hec k the consistency of the p ath wa y structure using the data av ailable. F or examp le, if the correlation in gene exp r ession leve ls b et ween t w o neighboring genes is v ery small, we m a y w ant to remov e th e edge fr om the path wa y structure. Alternativ ely , one can bu ild a set of new path wa ys using v arious data sources and compare these path w ays with those in the pathw a y databases in order to id en tify the most plaus ib le p ath wa ys for use in the prop osed h stMRF metho d. I mp ortant fu ture researc h will in- clude h o w to represent and assess the uncertain ty of the inference of the true differen tial expression states. The prop osed metho d s can b e extended in sev eral wa ys. First, b esides the neigh b oring information, the p ath wa ys may p ro vide additional biologically relev ant information, such as inhib ition and activ ation effects of genes and whic h genes are the transcrip tional factors. The pr op osed metho ds treat all no des and edges in the net works equally and use t wo p arameters, β 1 and β 2 , to charact erize th e spatial and temp oral d ep endency of the differentia l states. One p ossible extension of the pr op osed metho d s is to incorp orate the additional in formation ab out the pathw a ys in to data analysis. F or ex- ample, w e ma y attac h more w eigh t to transcription factors b ecause of their immediate impact on mRNA pro d uction. S econd, it is also p ossible to in- corp orate the promotor sequences and bind ing motif inform ation of kno wn transcription factors into the definition of the n eigh b ors in our d efi nition of the MRF mo dels. Finally , since man y n et wo rks are giv en by directed graphs, it is also p ossible to extend th e MRF mo del to incorp orate the direction of gene regulations. NETW ORK-BAS ED ANAL YSIS OF GENOMIC D A T A 21 In conclusion, microarra y time course gene expression data are commonly collect ed to inv estigate the d y n amic nature of imp ortant biologica l systems. The prop osed metho ds facilit ate the ident ification of the k ey molecular mec hanisms in volv ed and the cellular path wa ys b eing activ ated/mo d ified during a giv en biological pro cess. As our kno wledge of the biologic al p ath- w ays increases, we exp ect more applications of such metho ds for iden tifying genes and path wa ys th at are related to imp ortan t biological pro cesses. APPENDIX W e provide d etails on d eriv ation of the conditional prob ab ility ( 2.3 ), which follo ws Zhu et al. ( 2005 ). First, from the defin ition of the transition p roba- bilit y ( 2.2 ), for any 1 ≤ t ≤ T , w e h a ve Pr ( x 1 , . . . , x t | x 0 ) = t Y t ′ =1 1 c t ′ exp ( t X t ′ =1 " γ p X g =1 X g t ′ + β 1 X g ∼ g ′ ∈ E ( X g t ′ ⊕ X g ′ t ′ ) (A.1) + β 2 p X g =1 ( X g t ′ ⊕ X g ( t ′ − 1) ) #) . F rom this, w e ha ve Pr ( X g t | x 0 , x 1 , . . . , x t − 1 , X g ′ t , g ′ 6 = g ) = Pr ( x 1 , . . . , x t | x 0 ) Pr ( x 1 , . . . , x t − 1 , X g t = 0 , X g ′ t | x 0 ) + Pr ( x 1 , . . . , x t − 1 , X g t = 1 , X g ′ t | x 0 ) = exp { A + B ( X g t ) } exp { A + B (0) } + exp { A + B (1) } , where A = t X t ′ =1 " γ X g ′ 6 = g X g ′ t ′ + β 1 X g ′ ∼ g ′′ ∈ E \{ g } ( X g ′ t ′ ⊕ X g ′′ t ′ ) + β 2 X g ′ 6 = g ( X g ′ t ′ ⊕ X g ′ ( t ′ − 1) ) # , whic h consists of the terms in the exp onent of ( A.1 ) that d o n ot include X g t , where E \{ g } is the set of the edges that do not include those that linke d to gene g , and B ( X g t ) = γ X g t + β 1 X g ′ ∈ N g ( X g t ⊕ X g ′ t ) + β 2 ( X g t ⊕ X g ( t − 1) ) , 22 Z. WEI AND H. LI whic h consists of the terms th at include X g t . F rom this definition of B ( X g t ), w e h a ve B (0) = β 1 X g ′ ∈ N g (1 − X g ′ t ) + β 2 (1 − X g ( t − 1) ) , B (1) = γ + β 1 X g ′ ∈ N g X g ′ t + β 2 X g ( t − 1) . It is then easy to see that Pr ( X g t | x 0 , x 1 , . . . , x t − 1 , X g ′ t , g ′ 6 = g ) = exp { A + B ( X g t ) } exp { A + B (0) } + exp { A + B (1) } = exp { B ( X g t ) − B (0) } 1 + exp { B (1) − B (0) } = exp { X g t ( γ + β 1 P g ′ ∈ N g (2 X g ′ t − 1) + β 2 (2 X g ( t − 1) − 1)) } 1 + exp { ( γ + β 1 P g ′ ∈ N g (2 X g ′ t − 1) + β 2 (2 X g ( t − 1) − 1)) } = exp { X g t F 2 ( X g t ) } 1 + exp { F 2 ( X g t ) } , whic h is the equation ( 2.3 ). Ac kn owledgmen ts. W e thank four review er s and the editor Dr. Mic hael Newton for man y h elpful commen ts that improv ed the presentat ion of the pap er an d Mr. Edm u nd W eisb erg, MS, at P enn CCE B for editorial assis- tance. SUPPLEMENT AR Y MA TERIAL Details on simulati ons and comparison with the HMM mo d el (doi: 10.121 4/07-A OAS145SUPP ; .p d f ). W e present detailed sim u lation re- sults in T ables 1S-S2, including the standard errors of the s en sitivities, sp eci- ficities and FDRs. W e also present the time course expr ession p rofiles (Fig- ures S 1-S2) of the genes that were iden tified by our metho ds b u t missed b y the HMM metho d and the genes that w ere identified by the HMM metho d but missed b y ou r m etho ds. REFERENCES Aderem, A. and Ulevitch, R. J. (2000). T oll-like receptors in the induction of the innate imm une resp onse. Natur e 406 782–787. Bar ton, G. M. and Med zhitov, R. (2003). T oll-lik e receptor signaling pathw ays. Scienc e 300 1524–1525 . NETW ORK-BAS ED ANAL YSIS OF GENOMIC D A T A 23 Basso, R., Margolin, A. A., S tolo vitzky, G., Klei n, U., Dalla-F a vera, R. and Calif ano, A. (2005). Reverse engineering of regulatory netw orks in human B cells. Natur e Genetics 37 382–3 90. Besag, J. (1972). Nearest-neighbou r sy stems and the auto-logistic model for bin ary data. J. Roy . Statist. So c. Ser. B 34 75–83 . MR0323276 Besag, J. (197 4). Spatial interaction and the statistical analysis of lattice systems. J. R oy. Statist. So c. Ser. B 36 192–22 5. MR0373208 Besag, J. (1986). On the statistical analysis of dirty p ictures. J. R oy. Statist. So c. Ser. B 48 259–302. MR0876840 Cal v ano, S . E., Xi ao , W., Richard s, D. R., Felciano, R. M., Baker, H. V., Cho, R. J., Chen, R. O., Bro wnstei n, B. H., Cobb, J. P., Tschoeke, S. K., Miller- Graziano, C., Molda wer, L. L., Min drinos, M. N., Da vis, R. W., Tompkins, R. G. and Lowr y, S. F. (2005). A netw ork-based an alysis of systemic infl ammation in humans. Natur e 437 1032–103 7. Dennis, G., Sherman, B. T., Hosack, D. A., Y ang, J., Gao, W., Lane, H. C. an d Lempicki, R. A. (2003). DA VI D: Database for annotation, visualization an d integra ted disco very . Genome Biol o gy 4 P3. Han, J. and Ulevitch, R. J. (2005). Limiting inflammatory resp on ses during activ ation of innate immunit y . Natur e Immunolo gy 6 1198–120 5. Hong, F. X. and Li, H. (2006). F unctional hierarc h ical mo dels for identifying genes with different time-course expression profiles. Biometrics 62 534–544. MR2236847 Irizarr y, R. A., Hobbs, B., Collin, F., Beaze r-Barcla y, Y. D., An tonellis, K. J., Scherf, U . and Spee d, T. P. (2003). Exploration, normalization, and summaries of high density oligo nucleo tide arra y prob e level data. Biostatistics 4 249–264. Kanehisa, M. and G oto, S. (2002). KEGG: Kyoto encyclop edia of genes and genomes. Nucleic A cids R ese ar ch 28 27–30. Kendziorski, C. M., Newton, M. A., Lan, H. and G ould, M. N. (2003). On paramer- tic empirical Bay es metho ds for comparing multiple groups using replicated gene ex - pression profiles. Statistics in Me dici ne 22 3899–3 914. Nacu, S., Critchley-Th orne, R., Lee, P. and Holmes, S. (2006). Gene expression netw ork analysis, and applications to immunit y . T echnical rep ort, D ept. Statistics, St an- ford Univ. Newton, M. A., Kendziorski, C. M., Ri chmond, C. S. , B la ttner , F. R. and Tsui , K. W. (2001). On differential v ariabilit y of expression ratios: Improving statistical inference ab out gene expression c hanges from micorarra y data. J. Comput. Bi ol. 8 37– 52. Rabiner, L. R. (1989). A t utorial on hidden Marko v mo dels and selected applications in sp eech recognition. Pr o c. I EEE 77 257–286. Rahnenf ¨ uhrer, J., Domingues, F., Ma ydt, J. and Lenga uer, T. (2004). Calcula ting the statistical significance of changes in pathw ay activity from gene expression data. Statist. Appl. Genet. Mol. Biol . 3 Article 16. MR2101465 Rap apor t, F., Zinovyev, A., Dutreix, M ., B arillot, E. and Ver t, J. P. (2007). Classificatio n of microarra y data using gene netw orks. BMC Bioinformatics 8 35. Siv achenk o, A., Yurie v, A., Daraselia, N. and Mazo, I. (2005). I dentifying local gene expression patterns in b iomolecular netw orks. Pr o c e e dings of 2005 IEEE Computational Systems Bioinformatics Confer enc e , Stan ford, California. Storey, J. D., Xia o, W., Leek, J. T., Dai, J. Y ., Tompkins, R. G. and Da vis, R . W . (2005). S ignificance analysis of time course microarra y exp eriments. Pr o c. Nat. A c ad. Sci. 102 12837–1284 2. 24 Z. WEI AND H. LI Subramanian, A., T a ma yo, P., Moot ha, V. K., Mukherje e, S., Eber t, B . L., Gillette, M. A., P aulo vi ch, A., Pomer oy, S . L., Golub, T. R., Lande r, E. S. and M esiro v, J. P. (2005). Gene set en ric h ment analysis: A knowl edge-based ap- proac h for interpreting genome-wide expression profiles. Pr o c. Natl. A c ad. Sci. 102 15545–1 5550. T ai, Y. C. and Spe ed, T. (2006). A multiv ariate empirical Bay es statistic for replicated microarra y time course data. Ann. Statist. 34 2387–241 2. MR2291504 T akeda, K., Kaisho, T. and A kira, S . (2003). T oll-lik e receptors. A nnual R eview of Immonolo gy 21 335–376. Wei, Z. and Li, H. (2007). A Mark o v random field mo d el for netw ork-based analysis of genomic data. Bioi nformatics 23 1537–1544 . Wei, Z. and Li, H. (2008). S upplement to “A hidd en spatial-temporal Marko v ran- dom field model for netw ork-based analysis of time course gene expression d ata.” DOI: 10.1214/ 07-AO AS145SUPP . Yuan, M. and Ke ndziorski, C. (2006). Hidd en Marko v mo dels for microarra y time course data under multiple biologica l conditions (with d iscussion). J. Amer. Statist. Asso c. 101 1323–1340. MR2307565 Zhu, J., H uang, H.-C. and Wu, J. (2005). Modeling spatial-temp oral b inary data using Mark o v random fields. J. A gricultur al , Biolo gi c al , Envi r onmental Statistics 10 212–225. Genomics and Comput a tional Biology Gradua te Group Dep ar tment of Biost a tistics and Epidemiology University of Pennsyl v ania School of Medicine Philadelphia, Pennsyl v ania 19104 USA E-mail: zhiwe i @mail.med.up enn.edu hongzhe@mail.med.upenn.edu
Original Paper
Loading high-quality paper...
Comments & Academic Discussion
Loading comments...
Leave a Comment