False discovery rate analysis of brain diffusion direction maps
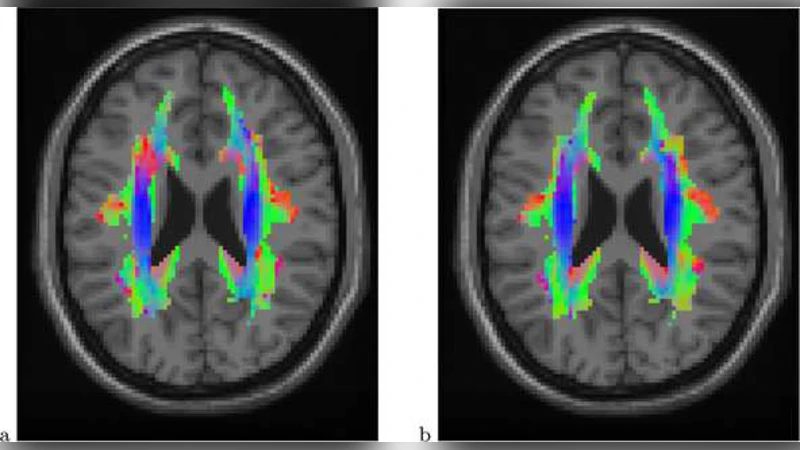
Diffusion tensor imaging (DTI) is a novel modality of magnetic resonance imaging that allows noninvasive mapping of the brain’s white matter. A particular map derived from DTI measurements is a map of water principal diffusion directions, which are proxies for neural fiber directions. We consider a study in which diffusion direction maps were acquired for two groups of subjects. The objective of the analysis is to find regions of the brain in which the corresponding diffusion directions differ between the groups. This is attained by first computing a test statistic for the difference in direction at every brain location using a Watson model for directional data. Interesting locations are subsequently selected with control of the false discovery rate. More accurate modeling of the null distribution is obtained using an empirical null density based on the empirical distribution of the test statistics across the brain. Further, substantial improvements in power are achieved by local spatial averaging of the test statistic map. Although the focus is on one particular study and imaging technology, the proposed inference methods can be applied to other large scale simultaneous hypothesis testing problems with a continuous underlying spatial structure.
💡 Research Summary
This paper presents a comprehensive statistical framework for detecting group differences in brain diffusion direction maps derived from diffusion tensor imaging (DTI). The authors focus on the principal diffusion direction at each voxel, which serves as a proxy for the orientation of underlying white‑matter fiber bundles. Traditional DTI analyses often reduce the tensor to scalar measures such as fractional anisotropy (FA); by contrast, this work treats the direction vectors themselves as the primary data of interest.
The study involves twelve subjects – six typically developing children (controls) and six children diagnosed with dyslexia – each scanned with a 3‑D DTI protocol yielding a 95 × 79 × 68 voxel grid (≈20,931 voxels within a white‑matter mask). After rigorous spatial registration to the MNI template, the principal diffusion direction at each voxel is represented by a unit vector in ℝ³, with the sign ambiguity (x and –x are equivalent) explicitly acknowledged.
To model these axial data, the authors adopt the bipolar Watson distribution, a simple antipodally symmetric distribution on the unit sphere. Its density is proportional to exp
Comments & Academic Discussion
Loading comments...
Leave a Comment