A note on the separability index
In discriminating between objects from different classes, the more separable these classes are the less computationally expensive and complex a classifier can be used. One thus seeks a measure that can quickly capture this separability concept betwee…
Authors: ** *논문 본문에 저자 정보가 명시되어 있지 않으므로, 저자명은 확인할 수 없습니다.* **
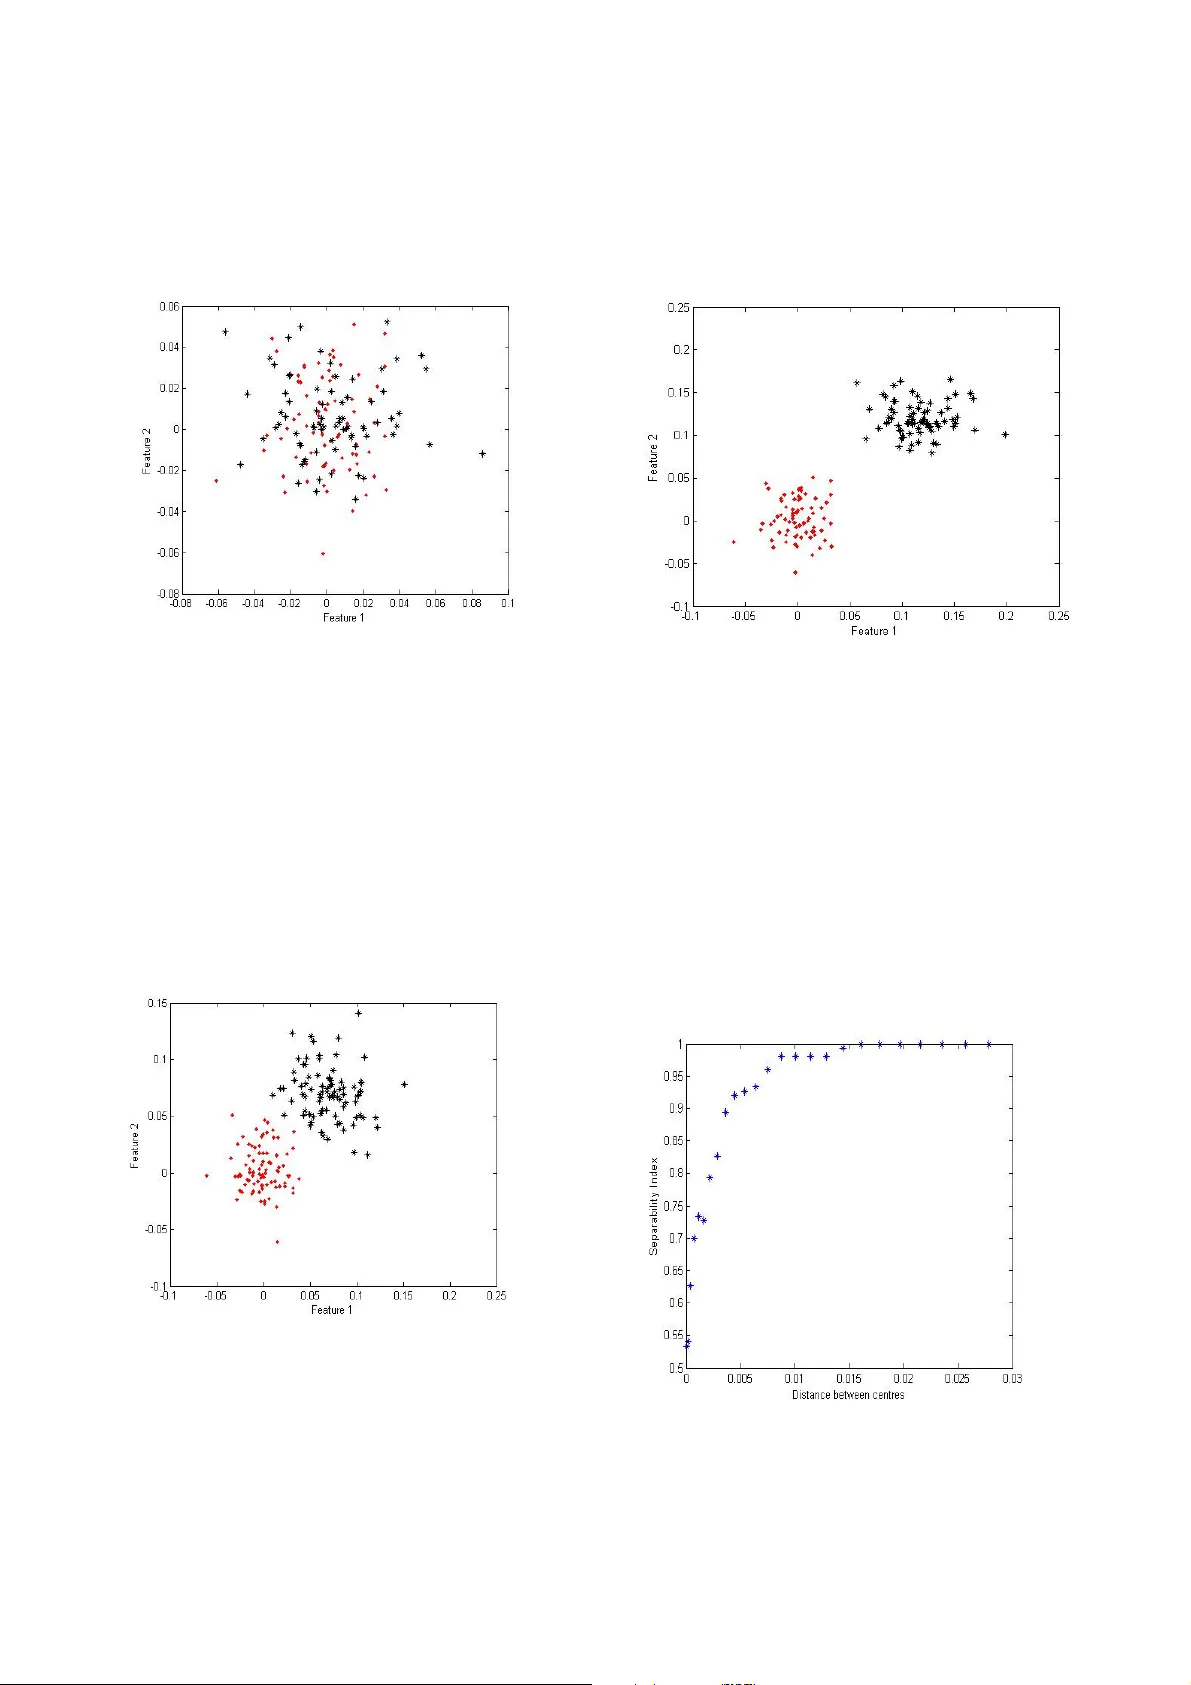
A note on the separability index Linda Mthembu, T shilidzi Mar w ala Depart m ent of Electrica l and Information E ngineering, Unive rsity of the Witwatersra nd Johannesburg, So uth Africa linda.mthembu@s tudent.wits.ac.za , t.marwala@ee.wits.ac. za Abstract In discriminating bet ween objects from different classes, the mor e separable these cla sses are the less computationall y expensive and complex a cla ssifier can be used. O ne thus seeks a measure that can quickly capture this separabilit y concept between cla sses whilst having an intuitive interpr etation on what it is quantifying. A previousl y pro posed separab ility measure, the separab ility index (SI) has been shown to intuitively capture the clas s separability pro perty very well. T his short note highlights t he limitatio ns of this measure and prop oses a slight variation to it b y combining i t with a nother for m of separa bility measure that ca ptures a quantit y not covered by the Separab ility Index. Keywords : Clas sification, separa bility, margins 1. Introductio n In ob ject categoriza tion/classification o ne is given a dataset o f ob jects fro m differe nt classes fro m which to discover a cla ss-distinguis hing-pattern so as to p redict the classification of ne w, pr eviously unseen ob jects [1,7]. This will only be possible if the main justification pillar o f inductio n s ystems which is based on the dictum; “ similar obj ects tend to cluster together” is tr ue. T his p rocess of disco vering a patter n in the dataset is further complicated b y the fact that the dataset often cannot immediately be visualized to determine the class d istribution. This c ould be d ue to the d atasets’ h igh d imensionalit y . Discoveri ng a method that can distil such infor mation, witho ut running multiple sets o f co m putatio nally e xpensive classifiers, would be advantageous. This m ethod should quantify how the classes are distributed with resp ect to each other; are there class overlaps, are there multiple modes within the cla sses and are there many o utliers etc? W e thus seek a simple measure tha t can conci sely c apture so m e of t hese aspects of the classes to gauge t he co mplexity of classifier to b e i m pleme nted. T he notio n of a ‘simpler classifier’ relates to the complexity of the discrimination functio n. A si m pler functio n e.g. li near is preferred over a more comple x polynomial functio n as stated by Oc cam’s razo r. The complexity of a classifier is also d etermined b y the number of irrelevant feat ures in the d ataset. The o riginal dataset input space – defined by the number of e xpertly measured attributes - is o ften not the optimal in terms of producin g clearly sep arable/non-overlappi ng classes. A subset of this space can often produce a substantiall y separab le set o f classes which in t urn results in a simpler discriminating function. Searching for an optimal sub -space can b e consider ed an optimization problem wh ose criterion function is the maximization o f some p redefined separ ability measure. A recent re view and c omment on t his area of research is prese nted in [ 4 and 6]. One m easure, the separabilit y index (SI), that int uitively measures the class overlap was pr eviously introduced in [3, 8 ] and was shown to be efficient in a number of pop ular machine learni ng datasets in [3, 5]. The sep arability index measure estimates the average number of instances in a dataset that ha ve a n earest neighbour with t he sa me labe l. Since this is a fraction the index varies be tween 0 -1 or 0-10 0%. Another separabilit y m easure, based on the class distance or margin is the H ypothesis margin (HM), introduced in [2]. It measures the dis tance bet w een an o bject’s nearest neighbour of th e same class (near -hit) and a nearest neighbour o f the opposing c lass (near-miss) and sums over these. T his means t he lar ger the near- miss distance a nd smaller the near-hit values, t he larger the hypothesis margin will be. This note is only concer ned with the above t w o mentioned m easures’ limitations. In the next section we show w ith a si mple exa mple the beha viour o f bo th the SI and HM. We highlight t he adva ntages a nd disadvantages of SI and HM t hen we propo se a hybrid of the two measures. T he resulting measures ’ pseudo code and behaviour are presented. 2. Separa bility 2.1 B ehaviour of separability meas ures In this section the be haviour o f both m easures is simulated in an exa mple where the sep aration of two Gaussian clusters is incrementally increased. This is taken to simulate the process of sea rching for an optimal feature space in a given hi gh dimensional dataset. Fi gure 1 shows two G aussian cl usters that are initially overlappin g with a SI o f 0.54 or 54 %. Figure 1: T w o initially o verlapping classes These c lusters are incrementa lly separa ted, b y varying one cluster’s centre d istance from the other. Fig ure 2 shows the point where the SI measure is 1or 100%; a quadratic or cubic discrim inator w ill c ertainly be enough to clea nly partition the cl usters whereas a linear classifier might not witho ut misclassification. Figure 3 sho ws a state where the two cl usters are visually more fully separate d than in fig ure 2 and certainly a l inear function will be an ad equate cla ssifier for s uch c lass sep arations. Figure 4 shows the variation o f the separabilit y index with t he increasi ng cluster distance. Figure 2: T he Separability inde x is 100% When t he clas s sepa ration d istance i ncreases beyond 0.015 units the SI still reports a separab ility o f 1. It is clear from this figure that t he SI is limited in capturing extreme class sep arability information whic h c ould result when a feature sub-sp ace with fewer features than that at 100% separabil ity is discovered in the optimization. Figure 3: Increa sed class separab ility The SI measure is infor m ative abo ut the separability o f the clusters b elow full sep arabilit y (<=1) but is no longer infor mative when the classes separate further which can ar ise in pra ctise. This i s to be e xpected si nce the separab ility index do es not measure class distance s per se. T he h y pothesis margin on the other hand, shown i n figure 5, keeps on m easuring w ith n o real informative limit o n the quant ity it is measuring e xcept that the class sep aration dista nce is increasing. What is required is a measure t hat ha s t he abilit y to intuitively inform on t he class separ ability below 100 %, a characteristic of the separ ability i ndex a nd ha s the ability to continue measuring a fter 10 0% class separabilit y, a characteristic of the hypothesis margin. Figure 4: Sepa rability index results on t he two Gaussian clusters a s the centre d istance is increased Figure 5: Hypothe sis margin results o n the two Gaussian clusters a s the centre d istance is increased 3. The Hybrid separability measure Merging t he two meas ures will consist of two parts; the original SI and modified HM parts. The HM is modified by only i nitializing it when the separabilit y index measures a separability of 1. While the SI is belo w 1 the HM is set to zero and once the SI i s equal to 1 the HM is ac tivated. Subseque nt hypo thesis margin di stances are the n calculated as ratios with respect to the H M when the SI w as 1. In this h ybrid measure the SI par t will capture all t he sub-spaces, from feature selection, where the class separabilit y increases until unit y then the modified HM part will capture the fact t hat the cl usters are still separating further. T his wa y the hy brid separ ability measure captures the overall class sepa rability i n ter ms of d istance a nd i nstance o verlap. Figure 5 s hows the pseudo cod e for the proposed algorithm: hm = hypothesi s margin; % original h ypothesis margin si = separa bility index; % sepa rability index if si < 1 hybrid = 100*Si; % hybrid measure eq ual SI when % SI is less t han 1. hm_ratio = 0; % hypothesis ra tio hm = 0; % hypothesis margin counter =0 ; elseif si = 1 counter =c ounter +1; if counter =1 % first time SI is 1 capture the ih = h m ; % h y pothesi s margin distance to be % the reference for subsequent distances end hm_ratio = h m/ih; % hy pothesis ra tio hybrid = 1 00*hm_ratio; % hybrid measure end Figure 5 : P seudo code for h ybrid measure Figure 6: Hybrid measure on the two Gaussian clusters as the centre d istance is increased Figure 6 s hows the beha viour of the hybrid separab ility measure. T he SI part is stil l retained and no w the HM part is incorp orated as a fraction which is c onverted to a percentage so as to integrate w ith t he SI m easure. The hypothesi s margin is n ow a more informative measure of the c lass separa tion. Table 1 below presents a por tion of the above si mulation results. A fter the separabilit y index reache s 1 the hypothesis ratio information i s relayed to the hybrid measure by multiplying b y 100. The sep aration distance can still be extracted fro m the hybrid measure. SI HM HM RATIO Hybrid (%) 0.908 1.5431 0 90.8046 0.9368 1.96 2 0 93.6782 0.954 2.4002 0 95.4023 0.9598 2.8622 0 95.977 0.9828 3.3595 0 98.2759 0.9885 3.8828 0 98.8506 1 4.4158 1 100 1 4 .952 1.1214 112.143 1 1 5.4955 1.2445 124.450 2 1 6.0419 1.3682 136.823 8 1 6.5924 1.4929 149.289 8 1 7.1469 1.6185 161.848 7 1 7.7037 1.7446 174.457 1 8.2627 1.8712 187.116 1 Table 1: A su b-set o f the simulation results Intuitive interpr etation, in the new measure, is not completely lost a nd ca n b e derived fro m t he la st t wo columns o f table 1. Once the hybrid measure re ports separabilities of more than 1 00% then a different perspective on separabilit y can be ind uced; the reporte d quantity will the n be the pe rcentage ratio of the cla ss separ ability d istances. A value o f 124 % can be read to m ean the classes are one point two f our times further apart than the y were when the SI index was 100%. This retains the intuitive notion of average dista nce between clas ses (meas ured by the hypothesis margin (HM)) albeit it is measured from a different reference point, the point at w hich the separability index (SI) measures 100 %. 4. Conclusion This note highlig hts the advantages and d isadvantages of two previously pro posed separability measure s; t he separabilit y index and the h ypothesis margin. A hybrid measure i s formed from t he two and the good prope rties of the individual measures are retained in the new measure which overcomes the limitation s o f the previou s measures. A si mple simulation exa m ple exposes the proble m of the two meas ures and performance results of the ne w measure are presented on the sa me example. So me intuiti ve interpr etation ca n still be develop ed from the new meas ure. 5. Acknowledg ements This r esearch was supp orted by the financial a ssistance of the National Re search Foundatio n of South Africa. 6. Refere nces [1] R.O. Duda, P. E. Har t and D.G. Stork. Pattern Classification ( 2nd editio n) John Wiley and Sons, 2000 . [2] R. G ilad-Bachrach, A. Navot and N. T ishby. Margin based feat ure selection- T heory a nd algorithms. Pro c. 21 st International Co nference o n Machine Learni ng (ICML), Banff, Ca nada 2004. [3] Gr eene J .R. Feature subset selection using Thornton’s separability inde x and its app licability to a number of sparse pro ximity-based classifiers. In proceed ings of the Pattern Recognition Association of South Africa, 20 01. [4] Guyon I a nd Elisseeff A. An Intro duction to Variable and Feature Selection. Journal o f Machine Learning Resear ch 3 pages 1157 -1182 (2003). [5] L. Mthembu a nd J .R Greene. A comparison of three separ ability mea sures. In Pro c of the 15 th Annual symposium of the Pattern Recognition Associatio n o f South Africa (PR ASA), November 2004, Grabouw, South Africa. [6] A. Navot, R. Gilad -Bachrach, Y. Na vot and N. Tishby. Is feature selection still nece ssary? In Saunders C and Grobelnik M and G unn S a nd Shawe - Taylor J. Editors Latent structure and feature selection techniques: Statistical and Opti m isation perspectives workshop (20 06). [7] T. Mitchell. Machi ne Learni ng. P ublished b y McGra w Hill, 199 7, ISBN 00704 28077. [8] C. T hornton. T ruth from Trash: Ho w Learning Makes Sense . Publis hed b y M IT P ress, 2 002, ISBN 026270 0875, 978026270087 0.
Original Paper
Loading high-quality paper...
Comments & Academic Discussion
Loading comments...
Leave a Comment