Spectrum Allocation in Two-Tier Networks
Two-tier networks, comprising a conventional cellular network overlaid with shorter range hotspots (e.g. femtocells, distributed antennas, or wired relays), offer an economically viable way to improve cellular system capacity. The capacity-limiting f…
Authors: Vikram Ch, rasekhar, Jeffrey G. Andrews
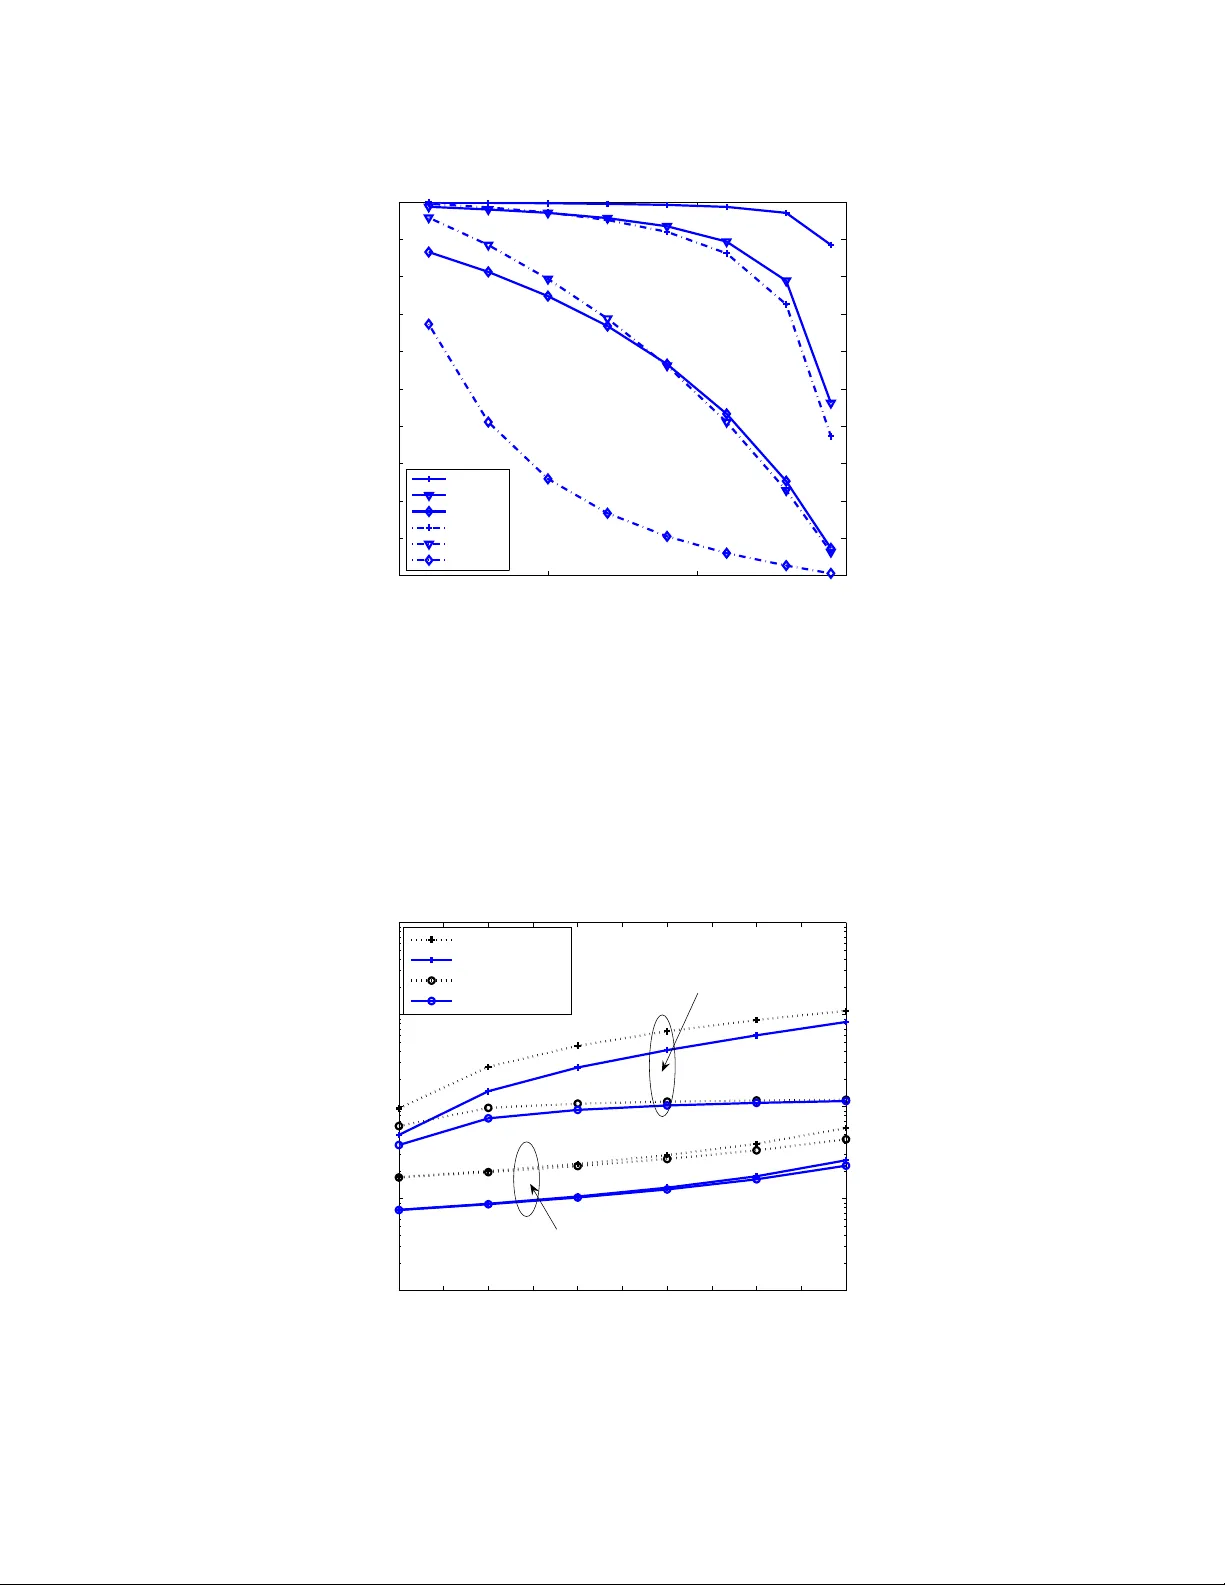
1 Spectrum Allocation in T wo-T ier Netw orks V ikram Chandrasekhar and Jef frey G. Andre ws Abstract T wo-tier networks, comprising a con ventional cellular network overlaid with sh orter range h otspots (e.g. femtocells, distributed antennas, or wire d relay s), offer an econ omically viable way to imp rove cellular system capacity . The capacity-limiting factor in such networks is interferen ce. The cross-tier interfere nce between macrocells and femtocells can suffocate the capacity due to the near-far prob lem, so in practice hotspo ts should use a different frequency chann el than th e po tentially near by high -power mac rocell users. Centralized or coord inated frequen cy planning , wh ich is difficult and ine fficient even in conventional cellular networks, is all but imp ossible in a two-tier n etwork. T his paper p ropo ses and analyz es a n optimu m d ecentralized spectrum allo cation policy f or two-tier n etworks that employ fr equency division multiple access (inc luding OFDMA) . The pro posed allocation is optimal in term s of Area Spectr al Efficiency (ASE), and is subjected to a sensible Qua lity of Serv ice (QoS) requirem ent, which guaran tees that both macroce ll and femtocell users attain at least a prescrib ed data rate. Results show the de penden ce of this allocation on the Qo S requir ement, hotsp ot d ensity and the co- channel interferen ce from the macro cell and surroun ding fem tocells. Design interp retations of this resu lt are provid ed. I . I N T RO D U C T I O N W ireless operators are in the process of augm enting the macrocellular network wi th supplemental infrastructure such as mi crocells [1]–[3], distributed antennas [4] and relays. An alternativ e with lower upfront costs is to i mprove indoor cov erage and capacity u sing the concept of end-consu mer in stalled femtocells or home base st ations [5]. A femtocell serves as a low power , short range d ata access point that provides high qualit y in -building cover age to home users, while backhauli ng their t raf fic over the IP network. The femtocell radio range ( 10 − 50 m eters) is mu ch sm aller than the macrocell radius ( 300 − 2000 m eters) [2]. Users transmi tting t o femtocells experience superior indoo r sig nal reception and lower thei r transmit po wer , consequentl y p rolonging battery life. The im plication is that femtocell s provide higher spatial reuse and cause less cochannel interference (CCI) to ot her users. The principal ar guments in fa vor of femto cells are summarized in [6]. This research has been supported by T e xas Instruments. The authors are with the W ireless Networking and Communications Group, Dept. of Electrical and Computer E ngineering at t he Univ ersity of T e xas at Austin, TX 7871 2-1157. (email:cvikram@mail.ute xas.edu, jandre ws@ece.utexas.edu ), Date: August 6, 2018. 2 In a sh ared spectrum two-tier network (univ ersal frequency reuse), recent research [7] has shown that near -far ef fects arising from cross-tier interference cr eate a fundament al trade-of f: Assuming all femtocell users seek a com mon SIR, the produ ct of all Pareto-optimal macrocell and femtocell SIR tar gets is a const ant dependent only on t he intra- and cross-tier channel powers, irrespective of t he power control s trategy . Perron-Frobenius theory [8] sho ws that any combination of per-tier t ar get SIRs whose product viol ates the above const raint causes the spectral radius of the n ormalized channel p ower matrix to exceed unity; hence, there may no t be a feasible power allocation for all users. The worst-case scenario arise either when a high p ower ed m acrocell user on the cell edge causes interference to nearby femtocells, or when cell interior femtocell users cause unacceptable in terference to the macrocell BS. The papers [7], [9]–[11] hav e suggested addressing this near -far problem by either 1) forcing femtocell users t o decrease their target data rates, or 2) employing interference a voidance (e.g. randomized time hopping) among b oth macrocell and femtocell users i n order t o “av oid” transmit ting in the s ame interval. Both approaches hav e drawbacks because they require either reducing SIR targets at femtocells, or accommodating femtocells by altering the transmission scheme at an existing macrocell in o rder to ensure tolerable performance. The subject of this paper is to moti vate and propos e a spectrum partitioning strategy in a two-tier deployment. A. The Return of FDMA Frequency division mul tiple access (FDMA)’ s resur gence in emerging OFDM A wireless st andards such as the 3GPP ’ s L TE, W iMAX and 3GPP2’ s UMB enabl e the m acrocell to perform flexible rate assignment [12] across frequency su b bands to users and provide interference management by fractional frequency reuse. In femtocell deployments, due to reasons o f scalability , s ecurity and lim ited av ailabilit y of backhaul bandwidth, it is rea sonable to assume the absence of coordination between femtocells and the central macrocell. Further , femtocells are placed opportuni stically or random ly by end users. Therefore, con ventional frequency p lanning strategies will be very difficult in a two-tier network. Assigning orthogonal spectrum resources between t he central macrocell and femtocell BSs eli minates cross-tier in terference. This motiv ates t he orthogonal access spectrum allocation strate gy proposed i n this p aper . Next, t o av oid persi stent collisi ons with neighboring femtocells i n their allotted sp ectrum, thi s paper propos es that each femt ocell accesses a random sub set of the candidate frequency subchannels, wherein each subchannel is accessed with equal probabilit y . W e term thi s spectrum access strategy as F-ALOHA (Frequency ALOHA) 1 . W e motivate F-ALOHA for three reasons. First, F-ALOHA av oids transmissio n delays and increased RF sensitivity requi rements for sensing frequency subchannels in th e 1 Slotted ALOHA, by con vention, implies that the sl ots are in the time domain 3 presence o f channel f ading [10]. Next, F-ALOHA provides randomi zed interference avoidance, s ince neighboring femtocells are unlikely to consistentl y a ccess identical frequenc y subchannels. Finally , such a transmissi on strategy offe rs a decentralized spectrum access by femt ocells–elimin ating backhaul communication cost between femtocells over the internet–and low complexity . F-ALOHA Spectrum Access: If a femtocell transmi ts over all its allo tted subchannels , i t may cause excessi ve i nterference to surrounding femtocells; con versely , acc essing only a fe w subchannels could result in a poor spati al reuse. W ith F-ALOHA, t here shoul d be an op timal fraction of spectrum access for each femtocell in order t o maximize the spatial reuse of spectrum, o r in ef fect the net number of simultaneous transmissions per uni t area [13], [14 ]. The spatial reuse is readily expressible using the Area Spectral Efficiency (ASE) i n b /s/Hz/m 2 [15], whi ch is defined as the network-wide spati ally a veraged throug hput per frequency subchannel d ivided by t he produ ct o f the subchannel bandwidt h and the area ove r which the transmi ssions take place. Based on the stated reasons, we assume (1) do wnlink transmissio ns from the m acrocell and femt ocells are frequency ortho gonal and (2) femtocells transmit using F-ALOHA, and pose the foll owing questions : • What is the expected subchannel throug hput inside the m acrocell [resp. femtocell], as a function of interference from neighboring m acrocells [resp. femtocells], and terrestrial prop agation parameters such as path-loss exponent and lognormal shadowing? • Gi ven the e xpected subchannel throughput, the av erage number of femtocells per cell-site and the number of users associ ated with each BS, how should the bandwidth be partition ed between tiers in order to satisfy a Quality of Service (QoS) requirement in each tier? • W ith this spectrum allocation strategy , ho w much i mprovement i n network-wide ASE does oppor- tunistic channel aw are m acrocell scheduli ng of fer relative to channel blind scheduli ng? B. Related W ork Existing research on hierarchical cellular syst ems has mainly focused on channel assignment in two- tier macrocell/microcell radio systems [16]–[18]. In the cont ext of this paper , a microcell has a much lar ger radio range (100-500 m ) than a femtocell, and generally implies centralized deployment, i.e. by the service-provider . These works typi cally either assu me only a si ngle microcell, or regularly spaced multiple microcells . Such an assumpti on may b e impractical in femtocell networks b ecause of the var iations in their pl acement from one cell s ite t o the next. W e would also like to clarify the differ ing objectives between a femtocell and microcell overlay . A microcell ov erlay allows the operator t o hand off and l oad balance users between each ti er in response to changi ng t raf fic conditions [6]. S o, the operator can pref erentially assign users (e.g high data rate users) by con verting microcells into data access points [16], [17]. In contrast, femtocells are consumer 4 installed and the traffi c requirements at femtocells are user determined without any operator i nfluence. In heterogeneou s n etworks, [19], [20] s uggest providing vertical h andoffs (admission control) and QoS- aw are routing to switch t raf fic between cell ular and ad h oc technol ogies. Howe ver , these approaches may not be viable in t wo-tier femtocell networks because of the lack of coordinatio n b etween macrocell and femtocell BSs; i nstead, decentralized st rategies for interference management and l oad balancing may be preferred. The problem considered i n this paper is related t o Y eung and Nanda [18], who propose frequency partitioning in a microcell/macrocell system based on mobi le speeds and the loading o f users in each cell. Sim ilar dynamic channel allocation schemes have been proposed in [21] and [22]. Their frequency partitioning is deri ved based on choosing h andoff velocity threshol ds and maxi mizing t he overall sys tem capacity , subject to per-tier blocking probability constraints that ig nore co-channel interference (CCI). In contrast, our work determines the spectrum allocation which maximizes the system-wide ASE considering in terference from neighboring BSs, path loss and prev ailing channel conditi ons. In decentralized networks, Jindal et al. [ 23] hav e deri ved the optimal number of fre quency subchannels F for a frequency-hopped ad hoc network assuming a fixed data rate requirement per transmi tter-re ceiv er pair and a target outage probability . Our work, in con trast, ass umes a fixed F (as is the case with OFDMA), allowing for multiple subchannels to be accessed by each BS, wi th variable rate t ransmission per accessed subchannel. In a hy brid network composed of ad-hoc nod es and BS infrastructure nodes, Zemlianov and de V eciana [24] and Liu et al. [25] have derived asymptot ic scalin g la ws relating to the per user t hroughput as th e number of infrastructure n odes increase. In add ition to the hi erarchical nature of our model, th e main diff erence is that thi s paper assumes single-hop communi cation. In WLAN networks, Ba hl et al. [26] ha ve propos ed v ariable c enter frequencies and v ariable channel width per access point for improving the spectrum utilization and fairness for heavily loaded access points (APs). Finally , game-theoretic approaches ha ve been recently in vestigated for both non-cooperativ e [27], [28] and cooperative [29] spectrum sharing in decentralized networks. C. Cont ributions This paper employs a stochastic geometry frame work for modeling the random spatial distribution of femtocells. Hotspo t locations are li kely to vary from one cell si te to another , and b e opportunist ic rather than planned, so an analysis t hat embraces instead of neglecting random ness should provide more accurate results and more plausible insights. T owar ds this end, femtocells are assumed to be scattered according to a Spatial Pois son Point Process (SPPP) [30], and in ter- femtocell interference is m odeled as Poisson Shot-noi se [31 ]. Thi s m odel has been used extensively in prior work [32]–[34], and its v alidity has been confirmed in empirical studi es [35]. 5 The prop osed spectrum allo cation maximizes the network-wide ASE in a two-tier network, ass uming each macrocell transmit s to a single user per frequency subchannel, whi le femtocells access spectrum using F-ALOHA. The allocation is determi ned in two steps. First, the per-tier ASEs are quantified based on the propagation en vironment and neighborin g cell interference. W ith an increasing number of macrocell us ers, the ASE of the m acrocell is either fixed (for a channel b lind schedul er) or increasing (by opportuni stic scheduli ng). For the femt ocell net work, t he ASEs are derived based on the optim al spectrum access using F-ALOHA. Next, the o ptimal allocation is determined as one that maximizes the weighted mean of the per- tier ASEs–the weights are gi ven by the fraction o f spectrum accessed by each tier . The three contributions of this paper are as follows. Expected per -tier throughpu t. The e xpected per-tier t hroughput is deri ved for the macrocell and femtocell users accountin g for in terference from neigh boring cells. The m aximum ASE o f the femto cell network is shown to be unchanged with addi tion of hotsp ots beyond a threshold. At low femto cell densities, the hi ghest femtocell ASEs are att ained when each femtocell accesses the entire av ailable spectrum. In h igher d ensities, femtocells shoul d u se a d ecreasing fraction of the spectrum; e.g. wi th an a verage of 100 femtocells in each cell site, each femt ocell shoul d access 30% of the ava ilable spectrum. Spectrum allocation wi th Quality of Service (QoS). The proposed spectrum all ocation m aximizes the spatial reuse in a two-tier network, s ubject to a network-wide QoS requirement , which gu arantees a minimum expected throughput per-user . Differing QoS constraints produce m arkedly differe nt spectrum allocations due to the competing s patial cov erage s cales i n each tier . Notably , a QoS requiring equal per - user throughputs in each tier means assigning greater than 90% of spectrum to th e macrocell. Con versely , an e ven division of spectrum occurs when the QoS constraints f av or femto cells t o provide significantly higher data rates. Scheduling and Spectrum Requir ements. Gains generated by channel aware macrocell scheduling permeate to femtocells, resulti ng in a significant s pectrum reduction with the propo sed allocation. W ith an av erage of 5 0 femt ocells/cell si te and tar g et per-tier d ata rates of 0 . 1 Mbps/m acrocell user and 10 Mbps/hots pot user , a channel aware macrocell scheduler provides nearly 50% reduction in necessary spectrum compared t o a channel blind schedul er . Finally , with increasing number o f hots pot users, the spectrum requirements in a two-tier network show two extremes. One is a l ow interference scenario where additi on of hots pots provides increased spatial reuse, ensuring that the necessary spectrum i s unchanged u p to 110 femtocells/cell site. In a h igh interference s cenario howe ver , the ensuing co- channel in terference may necessitate a li near increase in required s pectrum with hotspot densi ty . 6 I I . S Y S T E M M O D E L The setup con sists of a hexagonal region H of radius R c with a central macrocell BS C providing cove rage area |H| = 3 √ 3 2 R 2 c , whi ch is surrou nded by two rings of interfering macrocells. The macro- cellular network is ov erlaid with fe mtocell hotspots o f radius R f , whi ch are ra ndoml y di stributed on R 2 according to a homogeneous SPPP Ω f with intensity λ f [30]. The mean numb er of femtocells per cell site is readily obt ained as N f = λ f |H| . Macrocell u sers are assumed to be uniform ly d istributed inside each cell sit e. Femtocells are assumed to provide “closed access” to licensed ind oor users who fall wi thin the radio range R f of their respective home BSs 2 . Let U = U c + N f U f denote the a verage number of users in eac h cell site. These U users are distributed into U c uniformly distributed tier 1 mobile ou tdoor users and U f users per femtocell hot spot. A. P er-T ier Spectrum Access The av ailable spectrum com prises F frequency subchannels each with b andwidth W Hz. W e wish to determine the optim al partitioning ( F c , F f ) , where F c subchannels are av ailable for macrocell trans- missions and F f = F − F c subchannels are av ailable for femtocell t ransmission s. Denote ρ = F c /F as the f raction of spectrum ass igned to the macrocell BS with t he foll owing key assumptio ns: AS 1: Each femt ocell schedules its us ers in a ro und-robin (RR) fashion. The macrocell s chedules its users according to eith er a channel blind RR or a channel aware proportio nal fair (PF) scheduler . AS 2: The fraction ρ takes a continuum of values in [0 , 1] . For simpli city , the paper does not quantize ρ for ha ving an integer number of frequency subchannels. Consequently , F c = [ ρF ] and F f = F − F c , where we use [ x ] to denot e the integer part of a number x . Assumptio n 1 makes it clear that the long term expected throughput per indoor u ser equals 1 /U f th of the av erage femtocell throug hput. The long term expected macrocell throughput is assumed to be equally divided among the U c outdoor us ers with RR and PF schedu ling at the m acrocell. W ith a PF scheduler , this assum ption is reasonable considering mobi lity , which ensures that all users re ceiv e an identical avera ge Signal to Interference Ratio (SIR) over the long term. If each femtocell transmits over e xactly k frequency subchannels am ong their all otted F f subchannels, the net porti on o f accessed spectrum per femtocell equals ρ f (1 − ρ ) w here ρ f , k /F f . If femt ocells choose t heir frequency su bchannels independent ly and with equ al probabi lity , F-ALOHA effecti vely “thins” the mean n umber o f interfering femtocell s in each frequency subchannel. The probabil ity p of 2 The closed access scheme permits unlicensed users wit hin the femtocell radio range to communicate wit h the macrocell. 7 a femtocell selecting a gi ven frequency subchannel for transmission is giv en as: p = F f k − F f − 1 k F f k = k F f = ρ f (1) Consequently , t he s et o f interfering femt ocells per frequency subchannel is a marked SPPP [30 ] Λ f with intensity λ f ρ f = λ f k /F f . When ρ f = 1 , all femtocells in Ω f access the entire spectrum but mut ually interfere in all subchannels . For ρ f ≪ 1 , femt ocells transmit in a sm all region o f spectrum and av oid causing mutual interference. This strategy provides a higher spectral effic iency over each frequency subchannel, b ut incurs reduced spectrum uti lization because femtocells do not transmit over the entire a vailable spectrum. B. Channel Model and V aria ble Rate T ransmi ssion The downlink channel between each BS and its users is composed of a fixed distance dependent path loss, a slowly varying component mo deled by lognorm al s hadowing and Rayleigh fa st f ading with unit av erage po wer . For simplicity , t hermal noise is neglected at th e recei ver since cell ular systems, by nature, are interference lim ited. AS 3: Each user is assumed to track their SIR in each sub channel and fee dback the inst antaneous rate to t heir BS w ith zero d elay . Further , the channel can supp ort the requested rate as determined by th e scheduled user with probabili ty 1. Al though we a cknowledge that imperfect feedback and/or chann el estimation has a potentiall y big impact on system capacity , this paper does not account for these effec ts for sake of analytical tractabil ity . AS 4: BSs assign equal transm ission powers to all subchannels. Each BS ass igns rate adaptively based on the recei ved SIR per user . Let G denote the Shannon Gap with var iable rate M -QAM transmission [36]. Assume an instant aneous transmis sion rate of b i bps/Hz if the instantaneous SIR l ies in [Γ i , Γ i +1 ) . Using adapti ve mo dulation wi th L dis crete rates, th e instantaneous rate W b in a W Hz wi de sub channel is chos en as: b = b i , when SIR ∈ [Γ i , Γ i +1 ) , 1 ≤ i ≤ L (2) b i = lo g 2 1 + Γ i G bps/Hz (3) Assuming identical stat istics over all frequenc y subchannels, the long term expected throughput (in b/s/Hz) per macrocell/femtocell in each subchann el is given as: T = L − 1 X l =1 l · Pr[Γ l ≤ SIR < Γ l +1 ] + L · Pr[SIR ≥ Γ L ] (4) The expected throughput provided by each m acrocell [resp. femtocell] is obtained multip lying the expected throughput in (4) by their respective s pectrum allocation ρ [resp. ρ f (1 − ρ ) ]. 8 I I I . S P E C T RU M A L L O C A T I O N A N D P E R - T I E R E X P E C T E D T H RO U G H P U T S Let spectrum W F be partitioned such t hat the macrocell BS transmits over a po rtion ρ , while femtocell BSs transmit over the remaining 1 − ρ fraction o f the spectrum. L et T c ( ρ, U c ) be t he long term throughput (in b/s/Hz) i n each subchannel provided by the macrocell 3 . Ob taining T c requires calculat ing the average rate per subchannel in (4) after spatiall y av eraging the SIR over all locations, and accounting for the interference from two rings of transmitting m acrocells. Let each femt ocell access a portion ρ f of its allotted spectrum using F-ALOHA, servicing it s u sers in a RR schedule. Define T f ( ρ f λ f ) as the expected fem tocell throughput in each frequency subchannel, which is d etermined by t he intensit y ρ f λ f of the marked SPP P Λ f . W ith u niv ersal frequenc y reuse across all macrocells, the area spectral effi ciency (ASE) of t he m acrocell (resp. femtocell) network is giv en as: ASE c = T c ( ρ, U c ) |H| , ASE f = N f ρ f T f ( ρ f λ f ) |H| (5) The factor N f ρ f represents the mean number of transm itting femtocells in each subchannel. W ith bandwidth W , the per-tier throughputs (in b/s) per sub channel can be calculated b y multiplyi ng t he ASEs in (5) by W |H| . The network-wide ASE is therefore gi ven as: ASE = ρ ASE c + (1 − ρ ) ASE f = 1 |H| [ ρT c ( ρ, U c ) + (1 − ρ ) N f ρ f T f ( ρ f λ f )] (6) The expected network throughput (in b/s) over the W F wide spectrum is obtained by multiply ing (6) by W F |H| . Before determining the spectrum allocation, we first sti pulate a QoS requirement η , which ensures that us ers in either tier are guaranteed a minimum expected t hroughput. By im plication, η also regulates the m aximum amount of spectrum that any tier can recei ve. Definition 1: The QoS parameter η guarantees that the expected t hroughput per user in one tier is a t least η / (1 − η ) w .r .t the oth er tier . Choosing different η enables as signing d iffe rent priorit ies (QoS) t o one tier relativ e t o th e other . For example, setting η = 0 . 5 ensures that users i n bo th tiers obtain ident ical expected rates. On the oth er hand, decreasing η fa vors assi gning greater spectrum to the tier p roviding a hig her expected throughput per active u ser . Giv en a total av ailable spectrum of 1 Hz, the problem is to det ermine the optim al spectrum allocation ρ ov er all possible spectrum parti tioning strategies ω ∈ [0 , 1] between the macrocell and femtocells. 3 The use of U c and ρ within parenthesis is to account for a macrocell scheduler which can provide div ersity gains by scheduling users according to their channel variations [37] 9 The propo sed spectrum allocation maximizes the network-wide ASE with a QoS const raint η on the minimum expected per-tier throughpu t/user , as shown belo w: ρ = 1 |H| arg max 0 ≤ ω ≤ 1 ω T c ( ω , U c ) + (1 − ω ) N f ρ f T f ( ρ f λ f ) (7) subject to min { T c,u ( ω ) , T f ,u ( ω ) } ≥ η ( T c,u ( ω ) + T f ,u ( ω )) (8) where T c,u ( ω ) , ω T c ( ω , U c ) U c and T f ,u ( ω ) , (1 − ω ) ρ f T f ( ρ f λ f ) U f Here T c,u ( ω ) and T f ,u ( ω ) are t he e xpected thr oughputs for a ma cr ocell and femtocell user respectively . Whene ver the average subchannel t hroughput T c ( ω , U c ) is independent of the spectrum ω assigned to the macrocell, the objectiv e function in (7) is an af fine functio n w .r .t ω . The following proposition deriv es the optim izing ρ consi dering that the maximum is attain ed at the extremal points of the constraint s et: Pr oposition 1: If the expected m acrocell throughput per subchannel is independent of the total spectrum allocated to the macrocell ω , i.e. T c ( ω , U c ) = T c ( U c ) ∀ ω ∈ [0 , 1] , the optimizing ρ in (7) satisfies the QoS constraint with equ ality , belonging to a set with two candidate spectrum allocation assignments given as: ρ ∗ ∈ { x, 1 − x } , x , " 1 + 1 − η η T c ( U c ) U c U f ρ f T f ( ρ f λ f ) # − 1 (9) Pr oof: Since T c ( ω , U c ) = T c ( U c ) ∀ ω ∈ [0 , 1] , t he opt imization problem in (7) is to determin e the optimal ρ which maximizes a con vex combin ation of T c and N f ρ f T f ( ρ f λ f ) with a linear con straint. Consequently , t he argument maximizer is l ocated at t he extremal points of the const raint set (8). Solving for the ρ which satisfies (8) with equalit y yields (9). Remark 1: W ithout a QoS requirement (allowing η → 0 ), the o bjectiv e function i n (7) is a con vex combination of the m acrocell and femtocell throug hputs which is maxim ized at the extreme points ρ ∈ { 0 , 1 } . Such a partitioning is clearly unfair since it results i n a greedy allocation of the entire spectrum to one tier . For a generic macrocell scheduler–when Proposition 1 may be inapp licable– (7) is a o ne dimensio nal optimizatio n problem that can be s olved ef ficiently for a given η using a num erical search. A. Macr o cell Thr ough put: RR S cheduling Assuming that the central m acrocell BS C 0 in the he xagonal region H is placed at the origin, th e normalized po sitions o f the i nterfering BSs C k ∈ B , k = 1 . . . 18 are represented in polar form b k , k ∈ B using MA TLAB notation as: b k /R c ∈ n √ 3 e i ( π/ 6+[ 0: 5] π / 3) o [ n 3 e i ([0:5] π / 3) o [ n 2 √ 3 e i ( π/ 6+[ 0: 5] π / 3) o (10) 10 Let h 0 denote the Rayleigh fast fade (with exponentiall y distributed channel po wer | h 0 | 2 with unit m ean) between th e central macrocell BS C 0 and it s scheduled user 0 . Denoting the E uclidean norm by ||·|| , the expression for the receive d SIR for macrocell user 0 at posi tion r is given as: SIR c ( r ) = Θ 0 Ψ I ( r ) | h 0 | 2 || r /R c || − α c (11) where Ψ I ( r ) = X k ∈ B r − b k R c − α c | h 0 k | 2 Θ 0 k (12) Here α c represents the outdoor path loss exponent and | h 0 k | 2 ∼ exp(1) is the exponentially distributed channel power between interfering BS C k and the user of interest. The R V Θ 0 [resp. Θ 0 k ] is the lognormal s hadowing between the central BS [resp. int erfering BSs] and the desired user , which are distributed as LN( ζ µ c, dB , ζ 2 σ 2 c, dB ) , wh ere ζ = 0 . 1 ln 10 is a scaling constant. For analytical tractabili ty in the reminder of the paper , our paper makes the following assum ption regarding the dis tribution of a composite lognorm al-exponential R V : AS 5: The distribution of a composite l ognormal-exponential R V Θ k | h 0 k | 2 is modeled as a lognormal distribution using T urkmani’ s approxim ation [38]: f Ψ i ( x ) = 1 xσ i √ 2 π exp " − (ln x − µ i ) 2 2 σ 2 i # (13) µ i = ζ ( µ c, dB − 2 . 5) , σ i = ζ q σ 2 c, dB + 5 . 57 2 (14) AS 6: For a fixed r , using th e moment generating function based technique described in Mehta et al. [39], the sum of |B | independent, but not identically distributed log normal R Vs in the expression Ψ I ( r ) = P k ∈ B ( || r − b k || /R c ) − α c Ψ k is approxim ated by a single lognorm al R V wi th parameters LN ( µ I ( r ) , σ 2 I ( r )) . Using Ass umptions 5-6 and (11), SIR c ( r ) is dist ributed according to a lognorm al R V LN( µ C ( r ) , σ 2 C ( r ) where µ C ( r ) = µ S ( r ) − µ I ( r ) and σ C ( r ) = p σ 2 S ( r ) + σ 2 I ( r ) . Then, t he dis tribution of t he SIR for a mobile ti er 1 u ser at position r w . r .t the central BS is given b y Pr [SIR c ( r ) ≤ Γ | r ] = 1 − Q " ln (Γ || r /R c || α c ) − µ C σ C # (15) where Q( x ) , 1 √ 2 π R ∞ x e − t 2 / 2 d t is the complem entary cumulative distrib ution function (CCDF) of a standard normal. Defining a ( r ) , ln Γ − µ C ( r ) σ C ( r ) and b , α c σ C ( r ) , (15) simpli fies to Pr [SIR c ( r ) ≤ Γ | r ] = 1 − Q[ a ( r ) + b ( r ) ln || r /R c || ] (16) A veraging (16) over a hexagonal cell region is dif ficult. Alternativ ely , the spatially a veraged CDF of SIR c can be ob tained approxim ately b y considering an circular region of radiu s q | H | π , which resul ts in the s ame area as t he cell site H . T o calculate the sp atial throughput insi de this circular region, the 11 paper divides t he region int o M non-overlapping annuli . For t ractability , a si mplifying assum ption is that all us ers i nside an annul us experience i dentical shadowing statistics (i.e. identical µ C ( r ) and σ C ( r ) ). Denoting the distance o f the u ser from C 0 by || r || = R , the following lemma derives the expected spati al throughput by av eraging SIR c ( R ) inside a cir cula r annulus wi th inner radius R 1 and outer radius R 2 . Lemma 1: The spatiall y averaged SIR distri bution i nside a cir cular annulus with inner r adius R 1 and outer radius R 2 is given as: E R [Pr (SIR c ≤ Γ | R 1 ≤ R ≤ R 2 )] = 1 − 1 ( R 2 2 − R 2 1 ) [ R 2 2 C ( a 2 , b ) − R 2 1 C ( a 1 , b )] (17) where C ( a, b ) , Q( a ) + exp 2 − 2 ab b 2 ! Q 2 − ab b ! (18) a , ln Γ − µ C ( R 2 ) σ C ( R 2 ) , b , α c σ C ( R 2 ) (19) a 2 = a + b ln ( R 2 /R c ) , a 1 = a + b ln ( R 1 /R c ) , (20) Pr oof: See Appendix I. Lemma 1 provides a si mple metho d for estimating the cell-aver aged macrocell throughput per sub- channel. The probability that a user lies in an ann ulus with in ner ra dius R m − 1 and outer radius R m ( 1 ≤ m ≤ M with R 0 = 0 ) equals π ( R 2 m − R 2 m − 1 ) | H | . W e make use of assumpt ions 5 t hrough 6 for compu ting the shadowing parameters σ C and µ C at discrete locations R m , 1 ≤ m ≤ M where R M = q | H | π . The spatially av eraged SIR distribution for a macrocell user is th erefore approximated as follows: Pr (SIR c ≤ Γ) = E R [Pr (SIR c ( R ) ≤ Γ)] (21) ≈ M X m =1 E R [Pr (SIR c ≤ Γ | R m − 1 ≤ R ≤ R m )] · π ( R 2 m − R 2 m − 1 ) |H| (22) = 1 − π R 2 1 |H| C a 1 + b 1 ln R 1 R c , b 1 − M X m =2 π |H| R 2 m C a m + b m ln R m R c , b m − R 2 m − 1 C a m + b m ln R m − 1 R c , b m +1 (23) where a m , ln Γ − µ C ( R m ) σ C ( R m ) and b m , α c /σ C ( R m ) where (22) approx imates (21) by spatiall y a veraging SIR c over M different annulus. Equation (23) is obtained b y subs tituting (17) i nside the con ditional expectation in (22) and the corresponding probability that the user lies in annulus m, 1 ≤ m ≤ M . Combining equations (4) and (21), t he av erage macrocell 12 throughput T c in a gi ven subchannel i s expressed as: T c = L − 1 X l =1 l · E R [Pr(Γ l ≤ SIR c ( R ) < Γ l +1 )] + L · E R [Pr(SIR c ( R ) ≥ Γ L )] = L − 1 X l =1 l · ( E R [Pr(SIR c ( R ) ≤ Γ l +1 )] − E R [Pr(SIR c ( R ) < Γ l )]) + L · E R [Pr(SIR c ( R ) > Γ L )] (24) Figure 1(a) pl ots T c (in b /s/Hz) w ith RR schedulin g as a function of the outdoor path-loss exponent α c for the syst em parameters in T abl e I. The close agreement between theory and numerical sim ulations indicates that the theoretically obtained SIR dist ribution is an accurate approximation for practical throughput in a m acrocellular en v ironment. B. Macr o cell Thr ough put: PF S cheduling In contrast to a RR scheduler , a PF scheduler enables m acrocell users to compete for resources based on t heir requested rates normalized by their av erage t hroughput t hus far . Consequently , th e macrocell selects the u ser with the hi ghest rate relative to their average rate. During th e transmissi on interval n in subchannel m , deno te R k [ m, n ] as the request ed rate for user k , 1 ≤ k ≤ U c , located at position r k w .r .t the central macrocell C . Let ¯ R k [ n ] be the windowed mean t hroughput obtained by user k over the F c frequency sub channels allocated for macrocell transmi ssion. T he PF scheduler selects the user ˜ k whose current supportable rate is highest relati ve t o their mean rate. Th e scheduling poli cy per subchannel m with equal per- subchannel transmission powers (Assumption 4) is described as: ˜ k ( m, n ) = a rg max 1 ≤ k ≤ U c R k [ m, n ] ¯ R k [ n ] (25) Note that mobile user k calculates R k [ m, n ] usi ng (2) and (11 ) respecti vely . The windowed t hroughput per user prior to transmission interval ( n + 1) is updated according to the rule: ¯ R k [ n + 1] = (1 − 1 N ) ¯ R k [ n ] + 1 N F c X m =1 R k [ m, n ] 1 [ k = ˜ k ( m, n )] , 1 ≤ k ≤ U c (26) where 1 [ · ] is the i ndicator function determining whether user k is scheduled d uring transmission interva l n in fre quency link o r not. The window size N is a para meter that is selected consi dering the delay tolerance for each user . Choosing a smaller N enables a give n user to be schedul ed more often, whereas choosin g larger N relaxes the fairness const raint and allows the scheduler to wait longer before scheduling a user . By th e strong law of lar ge numbers, the avera ge throughput per frequency subchannel for a gi ven set of user positions is obtained from t he sample average over a long duration and expressed as: E [ ¯ R ( F c , U c ) | r 1 , · · · r U c ] = lim n →∞ 1 n n X j =1 F c X m =1 R ˜ k [ m, j ] F c , ˜ k ∈ { 1 , 2 · · · U c } (27) 13 where the expectation on the left h and si de is over the joint pdf o f all channel gains between users and their s erving and interfering BSs. The sp atial ave raged subchannel macrocell throughput is obt ained by a veraging (27) w . r .t the joint pdf f R 1 , ··· R U c ( · ) and giv en as: T c ( ρ, U c ) = E R 1 , ··· R U c [ E [ ¯ R ( F c , U c ) | R 1 = r 1 , · · · R U c = r U c ]] (28) Using (28) to compute T c ( ρ, U c ) is analytically intractable. This paper resorts to numerical simu lation to empirically estimate T c ( ρ, U c ) , wh ich i s used to derive th e bandwid th partiti oning. In the sim ulation, the nu mber of subchannels is set as F c = 1 with a link bandwi dth W = 1 5 KHz and a PF window parameter N = 500 OFDM symbo ls. Each mobile is moving at v = 13 . 34 m/s ( 30 mph) and th e p er -link throughput (27) is a veraged ov er 500 drops, with 8000 trials/drop for m odeling t ime-varying Rayleigh fading. The Rayleigh fading is held fixed over a duration T c = 0 . 4 /f d where f d = vf c 3 ∗ 10 8 is the doppler frequency at a carrier frequency f c = 2 GH z. Figure 1(b) compares th e performance of PF (numerically e valuated) versus RR scheduling for differe nt U c . Exploiting channel v ariations through proportional fairness r oughly doubles t he expected subchannel throughput. C. F emtocell Throughput Since femtocells are modeled as rando mly placed on R 2 according to a SPPP Φ f with intensi ty λ f , the interference e xperienced b y a femtocell user depends on t he di stances of these interfering BSs relativ e to the us er and their respective channel gains. Using F-ALOHA, the interfering femtocells form a marked SPPP Λ f ⊆ Φ f with intensity ρ f λ f . In a give n frequency s ubchannel, the cochannel int erference I f ,f experienced by a user 0 within femtocell F 0 is given as: I f ,f = X k ∈ Λ f A f Θ 0 k | h 0 k | 2 | x 0 k | − α f (29) where Θ 0 k ∼ LN ( ζ µ f o, dB , ζ 2 σ 2 f o, dB ) represents the lognorm al shadowing from femtocell F k to user 0 and | h 0 k | 2 is the exponential ly d istributed channel power between interfering femt ocell F k and user 0 inside F 0 . Denot ing t he exponentially di stributed channel powe r between F 0 and user 0 as | h 0 | 2 , the recei ved SIR is given as: SIR f = B f Θ 0 | h 0 | 2 | R f | − β f P k ∈ Λ f A f Θ 0 k | h 0 k | 2 | x 0 k | − α f (30) Here, user 0 is assumed to be o n the edge of t he home femt ocell F 0 and x 0 k represents the lo cations of the interfering femtocells F k w .r .t user 0. Th e term Θ 0 ∼ LN ( ζ µ f i, dB , ζ 2 σ 2 f i, dB ) is the ind oor lognormal shadowing, and Ψ 0 , Θ 0 | h 0 | 2 [resp. Ψ 0 k , Θ 0 k | h 0 k | 2 ] are the effecti ve channel gains from the desired [resp. interfering BSs]. Th e terms α f [resp. β f ] represent the path-loss exponents resul ting from interfering t ransmission s [resp. in-home transmission s] to the user of interest. A simple model i s u sed 14 to distinguish between the fixed losses arising from i n-home and interfering transmission s: specifically , home users are insul ated agains t interfering femtocell transmissi ons through do uble penetration losses arising from external wall partition s [40]. Consequently , A f and B f (in dB) are related as A f , dB = B f , dB + 2 P f , dB where P f = q A f B f is the wall penetration loss. Using As sumption 5, t he channel g ain Θ 0 | h 0 | 2 is well approx imated as a logn ormal rv Ψ 0 ∼ LN( µ S , σ 2 S ) . Sim ilarly , the channel gains Θ 0 k | h 0 k | 2 ∀ k are approximated as iid rv’ s distributed as Ψ I ∼ LN( µ I , σ 2 I ) . Eq uation (30) t hen simpl ifies to: SIR f = Ψ 0 | R f | − β f P k ∈ Λ f P 2 f Ψ 0 k | x 0 k | − α f (31) The clo sed form dist ribution of the Pois son SNP I f ,f = P k ∈ Λ f P 2 f Ψ 0 k | x 0 k | − α f is kno wn o nly wh en α f = 4 [31]. Ho weve r , tig ht lo wer bounds on Pr ( I f ,f > y ) are obtained by only considering femtocells whose interference individually exce eds y . Using this idea, the following lem ma, d eri ved in W eber et. al. [14, Theorem 3] provides an asym ptotically tight l ower boun d on the tail di stribution of I f ,f . Lemma 2: [14, Theorem 3] W ith randomized transmissions and lack ing power contr ol, t he lower bound on distribution o f I f ,f is given as: Pr( I f ,f > y ) ≥ 1 − exp [ − π λ f ρ f E [Ψ δ f I ] P 2 δ f f y − δ f ] (32) wher e δ f , 2 α f . When α f = 4 , I f ,f is dist ributed as : Pr( I f ,f > y ) = 1 − erfc π 3 / 2 λ f ρ f P f E [Ψ 1 / 2 ] 2 √ y ! (33) Lemma 2 provides the relati onship between the density λ f ρ f of int erfering femtocells in Λ f and the distribution of the CCI at a femtocell. For fixed y , as ρ f → 0 , the tail probabil ity Pr( I f ,f > y ) → 0 in (32) indicating that selecting fe wer subchannels using F-ALOHA transmission provides g reater re silience against persistent collisions from near by femt ocells. The distribution of the femtocell SIR in (30) is obtained as: Pr (SIR f ≤ Γ) = Pr Ψ 0 | R f | − β f P k ∈ Λ f P 2 f Ψ 0 k | x k | − α f ≤ Γ ! (34) = E Ψ 0 " Pr X k ∈ Λ f P 2 f Ψ 0 k | x k | − α f ≥ ψ 0 | R f | − β f Γ Ψ 0 = ψ 0 !# (35) ≥ 1 − E Ψ 0 ( exp " − π λ f ρ f E [Ψ δ f I ] P 2 f Γ Ψ 0 | R f | − β f ! δ f #) (36) = 1 − E Ψ 0 [exp ( − ρ f κ f Γ δ f Ψ − δ f 0 )] (37) where, κ f , π λ f E [Ψ δ f I ]( P 2 f | R f | β f ) δ f 15 where (35) and (36) follow by condit ioning on Ψ 0 , assum ing in dependence of Ψ 0 and Ψ 0 k ∀ k ∈ Λ f , and applying (32). A lthough i t is not possi ble t o obtain a closed form expression for the expectation in (37), the dis tribution of SIR f can be calculated num erically . Th e mean subchannel throughput T f is calculated by combining (4) and (37): T f ( ρ f λ f ) = L − 1 X l =1 l · Pr(Γ l ≤ SIR f < Γ l +1 ) + L · Pr(SIR f ≥ Γ L ) (38) ≈ L − 1 X l =1 l · E Ψ 0 [exp ( − ρ f κ f Γ δ f l +1 Ψ − δ f 0 ) − exp ( − ρ f κ f Γ δ f l Ψ − δ f 0 )] + L · E Ψ 0 [exp ( − ρ f κ f Γ δ f L Ψ − δ f 0 )] (39) The approximati on in (38) is because t he right-hand side in (37) is a lower bo und on Pr(SIR f ≤ Γ) . Figure 2 p lots the femtocell throughput (1 − ρ ) ρ f T f (in b/s/Hz) ass uming the entire b andwidth is allocated to femt ocells ( ρ = 0 ). Black colored curves plot results of num erical simulations. T wo cases are cons idered nam ely (1) high attenuation (marked “HA” with α f = 4 , P f ,dB = 10 ) and (2) low attenuation (marked “LA” with α f = 3 . 5 , P f ,dB = 2 ) from neighboring femtocells. Setting ρ f = 1 and assuming N f = 5 0 fem tocells/cell site, the femtocell throughput falls from approximately 4 . 5 b/s/Hz in a HA en vironment to nearly 0 . 5 b/s/Hz in L A s cenario, i ndicating the sensi tivity of femt ocell throughput to propagation from nearby fem tocells. T o calculate t he optimum ρ f , we resort to maximi zing the ASE per subchann el. Thi s i s analogous to answering the question : Wha t fraction of subchannels should each femtocell access to maximize spatial r euse? At this crit ical ρ f , the F-ALOHA access by each femtocell is o ptimally traded off against neighboring femtocell i nterference in each subchannel. Mathem atically , ρ f is the s olution to the following optimization problem: ρ ∗ f = λ f arg max 0 <θ ≤ 1 θ T f ( θ λ f ) (40) ASE ∗ f = ρ ∗ f λ f T f ( ρ ∗ f λ f ) (41) T o jus tify (40), obs erve that there are an a verage of |H | ρ f λ f transmittin g femtocells per sub channel. W it h F-ALOHA access of 0 < θ ≤ 1 , each femtocell obtains an a verage subchannel throughp ut of T f ( θ ) , resulti ng i n ASE f equaling λ f θ · T f ( θ λ f ) . Alternatively , gi ven any allocatio n ρ , (40) computes the F-ALOHA spectrum access ρ f which maximizes t he mean overall throughput (1 − ρ ) ρ f T f ( ρ f λ f ) per femtocell. Remark 2 ( Boundedne ss of the ASE ): The ASE in (40) depends on the effecti ve intensit y λ f θ of interfering femt ocells per subchannel. W ith increa sing λ f , provided ρ ∗ f < 1 , then the intensity of Λ f giv en as λ f ρ ∗ f remains constant, imply ing that the optimal ρ f is a mo notone decreasing function of λ f . 16 Consequently , if ρ f < 1 for a giv en λ f , the maximum ASE per subchannel i s fixed . This als o means that with increasing λ f , the network-wide femto cell throughput equaling |H| W F · (1 − ρ )ASE ∗ f grows linearly wit h (1 − ρ ) . Fig. 3 pl ots (40) for differe nt N f with α f = 3 . 5 and P f ,dB = 2 . In all cases, the h ighest ASE i s fixed at nearly 0 . 000 121 b/s /Hz/m 2 validating Remark 2. W ith a low femtocell density ( N f = 10 ), the best strategy is to access the entire spectrum from bandwidth partitioning. In a dense network ( N f = 100 ), the ASE is maxim ized wh en each femtocell accesses approx imately 30% of the av ailable spectrum. Further , in (40), as long as ρ ∗ f = 1 , each femt ocell accesses the enti re av ail able spectrum (1 − ρ ) , consequently T f decr eases with addition of femtocells. Howe ver , if ρ ∗ f < 1 , T f = ASE f / ( λ f ρ ∗ f ) remains constant with increasing λ f (Fig. 3(b)). Howe ver , as λ f → ∞ , since ρ ∈ ( 0 , 1) , the mean overall throughpu t per femtocell approaches zero, as the following limit sh ows: lim λ f →∞ T f (1 − ρ ) ρ f ≤ lim λ f →∞ T f ρ f = 0 (42) One may explore the dependence of the mean overa ll femtocell t hroughput T f ρ f (1 − ρ ) on the spectrum allocation ρ and F-ALOHA access ρ f . Equiv alently: W ith incr easing femtocell densi ty λ f , can incre asing allocated sp ectrum (1 − ρ ) to femtocells counterbal ance decr easing F-ALOHA spectrum access ρ f to r esu lt in a higher mean femtocell thr oughput? This question is answered by the following condition: Given an allocation ρ l at femtocell density λ f , let T f ,l and ρ f ,l be the mean subchannel throu ghput and the opti mal F-ALOHA access respectively . On increasing λ f by δ λ f with allocati on ρ h , let the correspondin g quantities equal T f ,h and ρ f ,h . The femtocell network is defined as f ully-utiliz ed [r esp. s ub-utilized] if a marginal increment in the femtocell density re duces [r esp. impr oves] the mean t hroughput per femtocell as gi ven below: (1 − ρ l ) ρ f ,l T f ,l ≷ (1 − ρ h ) ρ f ,h T f ,h ⇐ ⇒ (1 − ρ l ) ASE f ,l λ f ≷ (1 − ρ h ) ASE f ,h λ f + δ λ f ⇐ ⇒ 1 − ρ h 1 − ρ l ≶ ASE f ,l ASE f ,h · λ f + δ λ f λ f = T f ,l T f ,h ρ f ,l ρ f ,h (43) Equation (43) reflects the com peting ef fects of increasing allocation (1 − ρ ) and decreasing F-ALOHA access ρ f (or increasing λ f ) in determining the net femtocell throughput. I V . N U M E R I C A L R E S U L T S Results are presented in Fig s. 4 th rough 7 with the system parameters in T able I. The n umber of users in each ti er is controlled by varying N f . T o model varying d ata-rate requirement s inside femtocells relative to the central macrocell, QoS values of η = 0 . 5 (equal per -user throughp uts in each 17 tier) and η = 0 . 01 (fa voring 1 0 0 x higher throughput/ femtocell user relative to macrocell users) are considered. T wo propagation scenarios are p resented namely 1) High At tenuation (HA) of neighbori ng femtocell transm issions–m odeling low interference–with parameters α f = 4 and P f ,dB = 10 and 2) Low Attenuation (LA) scenario by setting α f = 3 . 5 and P f ,dB = 2 . Fig. 4 shows the allocation using (9) with RR scheduli ng per-tier . W i th equal av erage per-user throughputs ( η = 0 . 5 ), nearly 90% o f the overall bandwidth i s assigned to the macrocell. Th e central macrocell serves a high er number of users, who experience relativ ely poor reception. Equal izing per-user throughputs consequently requires a significantly higher allocation to the macroce ll. As η decreases, femtocells require more spectrum for providing greater indoor capacity; eg. in a LA s cenario wit h η = 0 . 01 and N f = 50 femtocells/ cell site, n early 70% of spectrum is allocated to femtocells. Fig. 5 plo ts the ASEs of the t wo-tier network using (6). In a L A scenario with η = 0 . 0 1 , t he hi gh degree o f co-channel interference results in the ASE m aximized with fewer th an N f = 50 femtocells. Follo wing Remark 2, thi s indicates that adding m ore femtocells does not provide additional spatial reuse. In all other cases, the ASEs m onotonically increase with N f indicating increasing spatial reuse wit h addition of femtocell s. T o show benefits of opportunistic scheduli ng, a PF scheduler provides nearly 2 . 3 x [resp. 1 . 3 5 x] A SE gains relative to a RR scheduler in a HA scenario with QoS parameter η = 0 . 5 [resp. η = 0 . 01 ] and N f = 110 femtocells /cell site. Fig. 6 plots the expected throughput p er femto cell (1 − ρ ) ρ f T f as a functio n of N f and η . For η = 0 . 5 , the t hroughputs mono tonically increase wi th N f indicating t hat i ncreasing spectrum allocation (1 − ρ ) counteracts the effects of decreasing ρ f T f ; in effect, the femt ocell network is sub -utilized. W i th η = 0 . 01 in a LA en vironment howe ver , th e femtocell th roughputs decrease wi th increasing N f , indicating that the femt ocell network is ful ly-utilized. Fig. 7 plots the minimum required spectrum W F , which s atisfies a tar g et a verage data rate of D c = 0 . 1 Mbps for each macrocell user . For each femtocell, corresponding to QoS parameter v alues η = 0 . 5 and η = 0 . 01 , we consider target avera ge data rates D f = D c (1 − η ) /η equaling 0 . 1 and 10 Mbps/user . Since Proposition 1 ensures that th e QoS constraint in (7) is binding, the required spectrum W F is giv en as: W F = U c ρT c D c = U f (1 − ρ ) ρ f T f D f (44) T wo k ey observations are: First, a channel a ware macrocell provides si gnificant sa vings in the spectrum necessary to m eet D f and D c ; eg. with η = 0 . 0 1 and N f = 50 femtocells /cell sit e in a HA s cenario, th e spectrum reduction is nearly 50% ( 10 MHz). Ne xt, spati al reuse and spectrum requi rements with the addition of femtocells are markedly different depending on attenuation from neigh boring femt ocells. For example, in a LA [resp. HA] scenario, the s pectrum requirement W F i ncreases [resp. decreases] with 18 increasing hots pot densit y indicating the femt ocell network is fully -utilized [resp. sub-utilized] with the per -tier spectrum allocation in (9). V . C O N C L U S I O N S This paper has proposed a d ecentralized spectrum allo cation strategy as an alternativ e to central- ized/coordinated frequency assignment in a two-tier network. The proposed allocation depends on the per -tier throug hputs, the loading of users in each tier and the QoS requirements, accounting for co- channel interference and p ath-losses. W ith a randomized spectrum acc ess strategy , femto cells should access a decreasing fraction of their allocated spectrum with increasing femtocell densi ty , in order to maximize s patial reuse. Spatial reuse benefits deriv ed from channel aw are macrocell scheduling result in nearly 50% spectrum reduction for meeting targe t per-tier data rates. In a lo w interference scenario where addition o f hotspots provides increased spatial reuse, th e spectrum requirement is u nchanged up to 110 femtocells/cell site. On the other hand, t he limited spatial reuse in high i nterference scenarios necessitates increasing spectrum with addi tion of femtocells. These insight s provide g uidelines on performance of decentralized spectrum allocation in the two-tier networks. A P P E N D I X I Inside a circular annulus of small wi dth, one can assu me that a user experiences identical s hadowing statistics from interfering BSs. F or con venience, the parameters a and b are chosen when the user is at the ou ter edge ( R = R 2 ) of the annu lus, as shown in equation (19). Gi ven R 1 ≤ R ≤ R 2 with the pdf function f R ( r | R 1 ≤ R ≤ R 2 ) = 2 r R 2 2 − R 2 1 , th e spatial ly a veraged outage probability is obtained as: E R [Pr (SIR c ≤ Γ | R 1 ≤ R ≤ R 2 )] = 1 − E R [Q( a + b ln R/R c ) | R 1 ≤ R ≤ R 2 ] (45) = 1 − 2 R 2 2 − R 2 1 Z R 2 R 1 Q[ a + b ln r /R c ] r d r (46) = 1 − 1 R 2 2 − R 2 1 ( R 2 2 Z R 2 0 2 R 2 2 Q[ a 2 + b ln r /R 2 ] r d r − R 2 1 Z R 1 0 2 R 2 1 Q[ a 1 + b ln r /R 1 ] r d r ) (47) where (47) is o btained by substit uting a 2 , a + b ln R 2 /R c and a 1 , a + b ln R 1 /R c in (46). Com bining the definit ions in (18) and (20) with th e ident ity [36, Pg. 55]: C ( a, b ) = 2 R 2 Z R 0 Q( a + b ln r /R ) r d r (48) and pl ugging into (47), the resul t follows. 19 T AB LE I S Y S T E M P A R A M E T E R S Symbol Description V alue R c , R f Macrocell/Femtocell Radius 288 m, 40 m U T otal users per cell site 300 U f Users per femtocell 2 P f , dB W all penetration loss 2 dB, 10 dB G, L Shannon Gap, Modulation Lev els 3 dB, 8 α c Path-loss exponent ( Macrocell Outdoor) 4 α f Path-loss exponent ( Femtocell to F emtocell) 3 . 5 , 4 β f Path-loss exponent ( Inside Home Femtocell) 3 σ c, dB , σ f i, dB , σ f o, dB Lognormal Shadow Parameters 8 dB, 4 dB, 12 dB 3 3.2 3.4 3.6 3.8 4 0.8 0.9 1 1.1 1.2 1.3 1.4 1.5 1.6 Path Loss Exponent [ α c ] Macrocell Throughput [T c ] Theory Simulation (a) T c versus outdoor path-loss ex ponent α c 0 5 10 15 20 25 30 1 1.5 2 2.5 3 3.5 Users Per Macrocell Macrocell Throughput T c RR Scheduling PF Scheduling (b) T c with RR and PF Scheduling, α c = 4 Fig. 1. Spatially average d macrocell subchannel throughput T c (b/s/Hz) R E F E R E N C E S [1] J. Shapira, “Microcell engineering in CDMA cellular networks, ” IEE E T rans. on V eh. T ech. , vo l. 43, no. 4, pp. 817–825 , Nov . 1994. [2] A. Ganz, C . M. Krishna, D. T ang, and Z. J. Haas, “On optimal design of multiti er wireless cellular systems, ” IE EE Comm. Magazine , vol. 35, no. 2, pp. 88–93, Feb. 1997. [3] C.-L. I, L. J. Greenstein, and R . D. Gitlin, “ A microcell/macrocell cellular architecture for lo w- and high-mobility wireless users, ” IEEE Journ al on Selected Ar eas in Comm. , vol. 11, no. 6, pp. 885–891, Aug. 1993. [4] A. Saleh, A. Rustako, and R. Roman, “Distri buted antennas for indoor radio communications, ” IEEE T rans. on Comm. , vol. 35, no. 12, pp. 1245–12 51, Dec. 1987 . [5] A. D oufex i, E. T ameh, A. Nix, S. Armour , and A. Molina, “Hotspot wireless LANs to enhance the performance of 3G and beyond cellular networks, ” IE EE Comm. Magazine , vol. 41, no. 7, pp. 58–65, July 2003. [6] V . Chandrasekhar , J. G. Andrews, and A. Gatherer , “Femtocell networks: a surve y , ” IE EE Communications Magazine , vol. 46, no. 9, pp. 59–67, S ept. 2008. 20 0 0.2 0.4 0.6 0.8 1 0 1 2 3 4 5 6 7 Transmission probability per frequency link Mean Femtocell Throughput (b/s/Hz) HA, N f =10 HA, N f =50 HA, N f =100 LA, N f =10 LA, N f =50 LA, N f =100 Fig. 2. Theoretical and empirical throughput per femtocell ρ f T f (b/s/Hz) [7] V . Chandrasekhar , J. G. Andre ws, T . Muharem ovic, Z. Shen, and A. Gatherer, “P o wer control in two-tier femtocell networks, ” Submitted, IEE E T ran s. on W ireless Comm. , 2008. [8] R. Horn and C. Johnson, Matrix Analysis . Cambridge University Press, 1985. [9] N. Hove n and A. S ahai, “Power scaling for cogniti ve radio, ” i n International Conf. on W ireless Networks, Communications and Mobile Computing , v ol. 1, June 2005, pp. 250–2 55. [10] A. Sahai, N. Hov en, S. M. Mishra, and R. T andra, “Fundamen tal t radeof fs in robu st spectrum sensing for opportunistic frequency reuse, ” T echnical report, 2006. [Online]. A va ilable: www .eecs.berkeley .edu/ ∼ smm/Cogniti veT echReport06.pdf [11] V . Chandrasekhar and J. G. Andre ws, “Uplink capacity and interference avoidance in t wo-tier femtocell networks, ” T o appe ar , IEEE T ran s. on W ireless Comm. , 2008, [Online] A v ailable at http://arxiv .org/abs/cs.N I/0702132 . [12] J. G. Andrews, A. Ghosh, and R. Muhamed, Fundamen tals of WiMAX . P rentice-Hall, 2007. [13] F . Baccelli, B. Blaszczyszyn, and P . Muhlethaler , “ An ALOHA protocol for multi hop mobile wireless networks, ” IEEE Tr ans. on Info. T heory , vol. 52, no. 2, pp. 421–43 6, Feb . 2006. [14] S . W eber , J. G. Andre ws, and N. Jindal, “The effect of fading, channel inv ersion, and threshold scheduling on ad hoc networks, ” IEEE T rans. on Info. Theory , vo l. 53, no. 11, pp. 4127–4149, Nov . 2007. [15] M. S. Alouini and A. J. Goldsmith, “ Area spectral efficiency of cellular mobile radio systems, ” IEEE Tr ans. on V eh. T ech. , vol. 48, no. 4, pp. 1047–106 6, July 1999. [16] S . Kishore, L. J. Greenstein, H. V . Poor , and S. C. S chwartz, “Soft handof f and uplink capacity i n a two-tier C DMA system, ” I EEE T ran sactions on W ireless Communications , vol. 4, no. 4, pp. 1297–1301, July 2005. [17] Z . Shen and S. Kishore, “Optimal multiple access t o data access points in tiered CDMA systems, ” in Proc., IE EE V eh. T ech. Conf. , vol. 1, Sept. 2004, pp. 719–723 . [18] K. Y eung and S. Nanda, “Channel management in microcell/macrocell cellular radio systems, ” IEEE T rans. on V eh. T ech. , vol. 45, no. 4, pp. 601–612, Nov . 1996. [19] D. Niyato and E. Hossain, “Call admission control for QoS provisioning in 4G wir eless networks: issues and approaches, ” IEEE Network , vol. 19, no. 5, pp. 5–11, S ept./Oct. 2005. [20] K. Y ang, Y . Wu , and H.-H. Chen, “QoS-awa re routing in emerging heterogeneo us wireless networks, ” IEEE Communications 21 Maga zine , vol. 45, no. 2, pp. 74–80, Feb . 2007. [21] X. Lagrange, “Multitier cell design, ” IE EE Comm. Magazine , v ol. 35, no. 8, pp. 60–64, Aug. 1997. [22] H. Furukaw a and Y . Akaiwa, “ A microcell overlaid with umbrella cell system, ” in Proc., IEEE V eh. T ech. Conf. , St ockholm, Sweden, June 1994, pp. 1455–1 459. [23] N. Ji ndal, J. G. Andre ws, and S. W eber, “Bandwidth partitioning in decentralized wireless networks, ” A ccepted in J uly 2008, T o Appear in IEEE T rans. on W ireless Comm. [Online]. A v ailable: http://arxi v .org/abs/0711.027 7 [24] A. Z emlianov and G. D. V eciana, “Capacity of ad hoc wireless networks with infrastructure support, ” IEEE Jou rnal on Selected Ar eas in Comm. , vol. 23, no. 3, pp. 657–667, Mar . 2005. [25] B . Liu, Z. Liu, and D. T owsley , “On the capacity of hybrid wireless networks, ” in Proc ., IEE E INFOC OM , vol. 2, Mar ./Apr . 2003, pp. 1543–1552. [26] P . Bahl, R. Chandra, T . Moscibroda, Y . W u, and Y . Y uan, “Load aw are channel-width assignments in wireless LANs, ” Micr osoft Resear ch T ech. R eport MSR-TR-2007-79 , July 2007 . [27] R . Etkin, A. Parekh, and D . Tse, “Spectrum sharing for unlicensed bands, ” IEEE Journ al on Selected A r eas in Comm. , vol. 25, no. 3, pp. 517–528, Apr . 2007. [28] L . Grokop and D. N. C. T se, “Spectrum sharing between wireless networks, ” 2008. [Online]. A vailable: \ texttt { http: //arxiv .org/abs/0809.284 0 } [29] J. E . Suris, L. A. DaS ilva, Z. Han, and A. B. MacKenzie, “Cooperativ e game t heory for distributed spectrum sharing, ” in Proc ., IEEE International Conf. on Comm. , June 2007, pp. 5282–5 287. [30] J. Kingman, P oisson P r ocesses . Oxford Univ ersity P ress, 1993. [31] S . Lowen and M. T eich, “P o wer-law shot noise, ” IEEE T rans. on Info. Theory , vol. 36, no. 6, pp. 1302–1318 , Nov . 1990. [32] C . C. Chan and S. Hanly , “Calculating the outage probability in a CDMA network with Spatial P oisson traffic, ” IEEE Tr ans. on V eh. T ech. , vol. 50, no. 1, pp. 183–204, Jan. 2001. [33] F . Baccelli and B. Blaszczyszyn, “Spatial averages of cove rage characteristics in large CDMA networks, ” INRIA, T ech. Rep., 2001, [Online] A vailable at ht tp://www.inri a.fr/rrrt/rr- 4196.html . [34] A. Ridolfi and M. Z. W in, “Ultrawide bandwidth signals as shot noise: a unifying approach, ” IEEE Journal on Selected Area s in Comm. , vol. 24, pp. 899–90 5, Apr . 2006. [35] F . Bacc elli, M. Klein, M. Lebour ges, and S. Zuy ev , “Stochastic geome try and architecture of communication netw orks, ” J. T el ecommunication Systems , vol. 7, pp. 209–227 , 1997. [36] A. Goldsmith, W ir eless Communications . C ambridge Univ ersity P ress, 2005. [37] P . V iswanath, D. N. C. Tse, and R. L aroia, “Opportunistic beamforming using dumb antennas, ” IEEE T rans. on Info. Theory , vol. 48, no. 6, pp. 1277–129 4, June 2002. [38] A. M. D. Turkman i, “Probability of error for m-branch macroscopic selection div ersity , ” in Communications, Speec h and V ision, IEE Proceed ings I , vol. 139, no. 1, Feb . 1992, pp. 71–7 8. [39] N. B. Mehta, J. W u, A. F . Molisch, and J. Zhang, “ Approximating a sum of random variables with a lognormal, ” IEEE T rans. on W ireless Comm. , vol. 6, no. 7, pp. 2690–2699 , July 2007. [40] “HNB and HNB-macro propag ation models, ” in 3r d Generation P artnership Projec t, T ech. Rep. R4-071617 , Oct. 2007. 22 0 0.2 0.4 0.6 0.8 1 0 0.2 0.4 0.6 0.8 1 1.2 1.4 x 10 −4 Transmission probability per frequency link Area Spectral Efficiency (b/s/Hz/m 2 ) N f =10 N f =50 N f =100 Highest Attainable ASE (a) Femtocell ASE Vs F-ALOHA spectrum access 10 0 10 1 10 2 10 3 10 4 10 −5 10 −4 10 −3 10 −2 10 −1 10 0 10 1 Average Femtocells Per Cell Site SubChannel Throughput Area Spectral Efficiency HA, T f HA, ASE f LA, T f LA, ASE f Asymptotic Spectral Efficiency Highest Area Spectral Efficiency (b) Femtocell ASEs and subchannel throughp uts Fig. 3. Femtocell Area S pectral Efficiencies N f ρ f T f | H | 23 0 50 100 150 0 0.1 0.2 0.3 0.4 0.5 0.6 0.7 0.8 0.9 1 Average Femtocells Per Cell Site Spectrum Allocation HA, η =0.5 HA, η =0.1 HA, η =0.01 LA, η =0.5 LA, η =0.1 LA, η =0.01 Fig. 4. Optimal spectrum all ocation ρ for varying QoS parameter η 10 20 30 40 50 60 70 80 90 100 110 10 −6 10 −5 10 −4 10 −3 10 −2 Average Femtocells Per Cell Site Area Spectral Efficiency (b/s/Hz/m 2 ) HA, PF Scheduler HA, RR Scheduler LA, PF Scheduler LA, RR Scheduler η =0.01 η =0.5 Fig. 5. Area Spectral Efficiencies in a two-tier network for varying QoS parameter η 24 10 20 30 40 50 60 70 80 90 100 110 10 −2 10 −1 10 0 10 1 Average Femtocells Per Cell Site Mean Femtocell Throughput (b/s/Hz) HA, PF Scheduler HA, RR Scheduler LA, PF Scheduler LA, RR Scheduler η =0.01 η =0.5 Fig. 6. A verag e network-wide throughput ρ f T f (1 − ρ ) (in b/s/Hz) provided by femtocells in their allocated spectrum (1 − ρ ) 10 20 30 40 50 60 70 80 90 100 110 0 10 20 30 40 50 60 70 80 90 Average Femtocells Per Cell Site Channel Bandwidth WF, MHz LA, RR, η = 0.01 LA, PF, η = 0.01 HA, RR, η = 0.5 HA, PF, η = 0.5 HA, RR, η = 0.01 HA, PF, η = 0.01 Fig. 7. Required spectrum W F meeting a targ et averag e data rate of D c = 0 . 1 Mbps for each macrocell user , given Round-Robin and Proportional-Fair scheduling at t he macrocell.
Original Paper
Loading high-quality paper...
Comments & Academic Discussion
Loading comments...
Leave a Comment