The use of entropy to measure structural diversity
In this paper entropy based methods are compared and used to measure structural diversity of an ensemble of 21 classifiers. This measure is mostly applied in ecology, whereby species counts are used as a measure of diversity. The measures used were S…
Authors: ** *저자 정보가 제공되지 않음* **
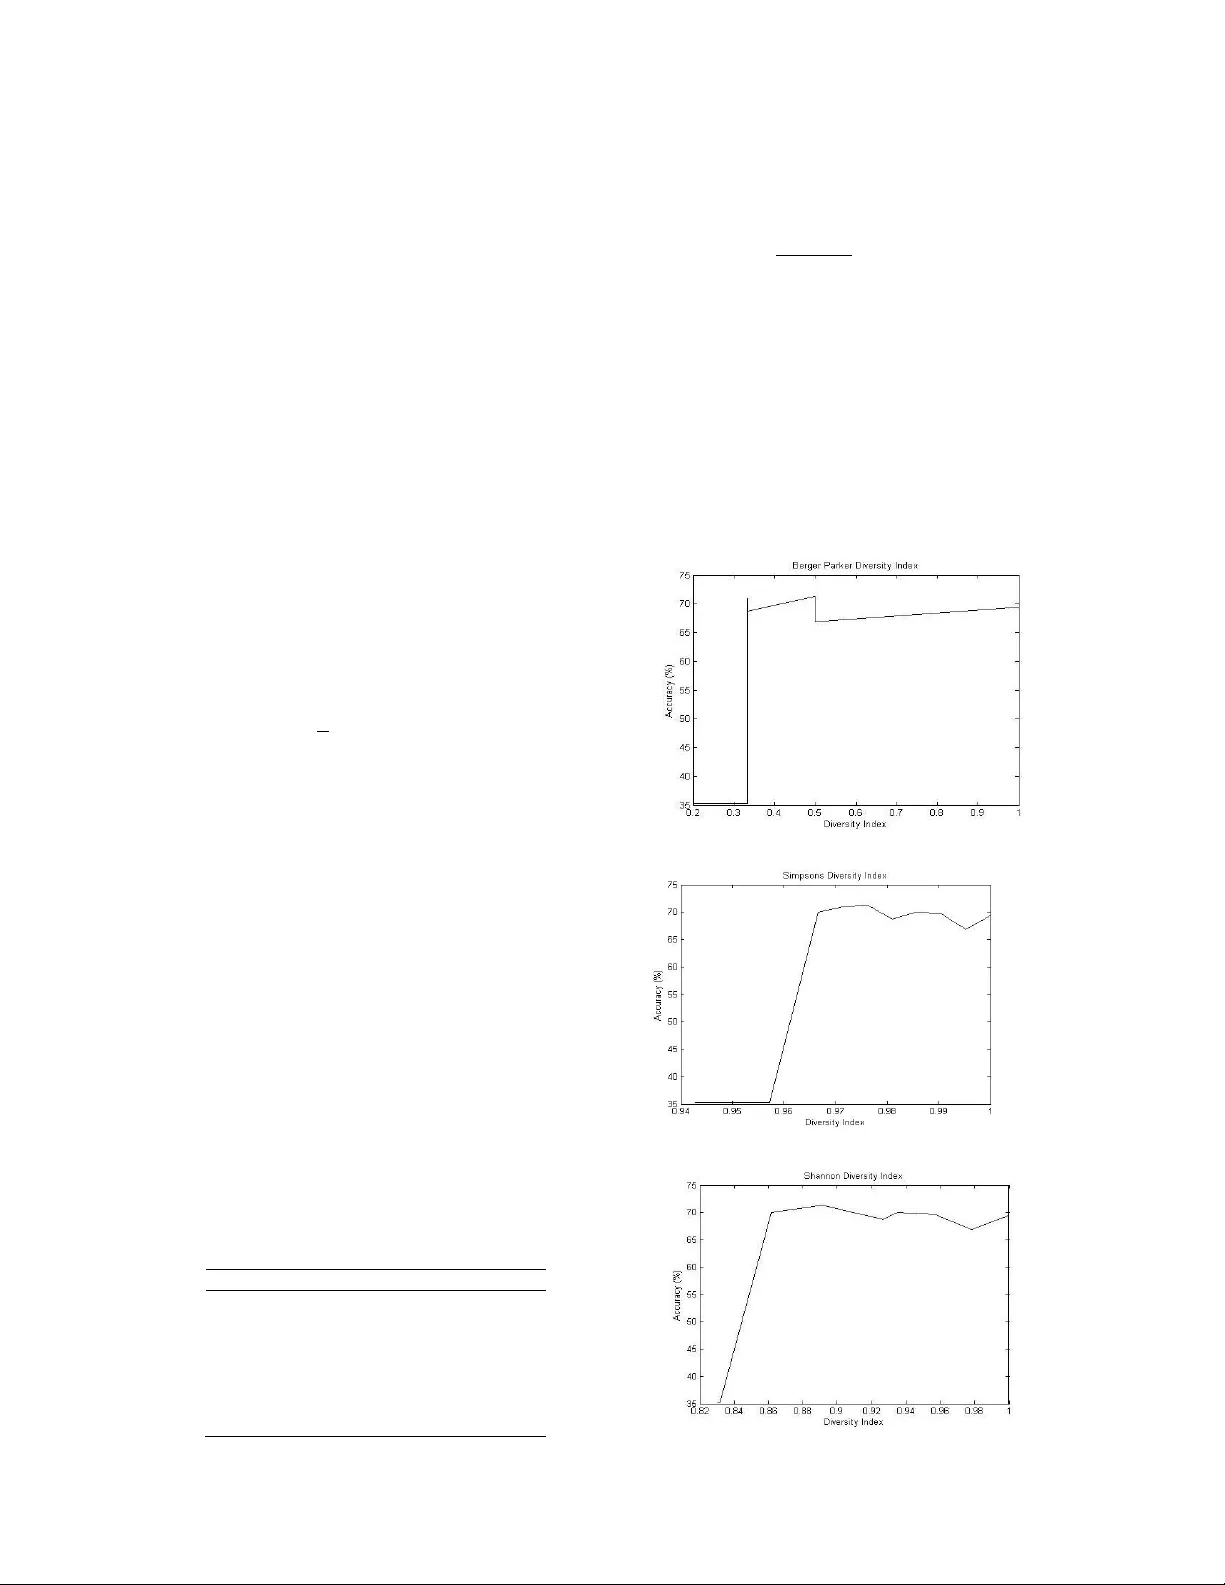
The use of entropy to measure st ructural d ive rsity L. Masisi 1 , V. Nelw amo ndo 2 and T . M arw ala 1 1 School of Electr ical & Informa tion Eng i n ee ring W it w atersr and Univ ersity, P/Bag 3, W its, 2050 , South Africa 2 Gradu ate Sc hool of Arts an d Scie nces, Harva rd U n i v e rsity, GSAS Mai l Ce n te r Child 412, 2 6 Eve rett Street Cambridge, M assa chusetts , 021 3 8 US A Abstract — In th is p aper entropy ba s ed meth ods are compa red and u sed to measure stru ctural div ers i ty of an ensem ble of 21 classifi ers. Thi s me asure is mostly applied in ecology , w h ereby species coun t s are used as a mea sure of div ers i t y. T h e measu res used were Shan non e n tropy , Sim ps on s an d th e B erger Park e r div ersity indexes. As the div ers i t y indexes inc reased so did the accu r acy of the ensem ble. A n en se m b le domin ated by classifiers with the same stru c tu re pro d uced poor accu r acy . U n ce rt ainty ru le from i nform ation t h eory was al so used to fu rther d ef i ne div ers i t y. Ge n e tic a l gorith ms w e r e used to fi nd the optimal ensem ble by u si n g t h e diversity in dic es as th e cost fu nction . The me thod o f v ot in g was u sed to aggr e ga t e t h e d e cisi ons. I . I NTR ODUCTION T h ere is st ill an immense need to develop r o bust and relia ble classif i c ation of data . I t has bec om e appa rent t ha t as opp osed to using one clas si f i e r an ensemb l e of clas sifiers pe r forms better [1],[2],[3]. T his is bec ause a comm itt e e of c lassifiers is better than o n e classifie r. Ho wever one of the question that arises i s that, how do we me asu r e the integ rit y of the se comm ittee in ge neralizing. T h e p opular m ethod t ha t i s used do g ain co nfide nce f r om the g enera lization a b ili ty of an e nsemble is of inducing di v ersity within the ense mb le. T his theref ore calls f o r a form of a m eth o d of m easuring the diver sity of the ense mb le. Methods hav e been imp le me n te d to r elate ens emble diversit y with ensemb l e ac curacy[ 4],[ 5 ], [6] . Thes e me t ho ds u se the outc om es of the indiv i dual class i f i ers of the ensemble t o mea sur e diver sity [ 7 ], [8]. This me ans th a t di v ersit y is ind uce d b y diffe rent t ra ining me tho d s, pop ular ones being, bo o sting and b a gging . T his paper deals with the m e as ure of structura l diver sity of an ensemb l e by using entropy meas ures. Div ersit y is induced by va r ying the structural pa r ame t ers of the class i f i ers [9]. The paramete rs of i nteres t include the ac tiva ti o n f unction, nu m ber of hidden nod es and the lear ning r ate. T his study therefore does not tak e into co ns i d eration th e o utcome of t he indi v idual cl as sif ier s t o me asure di v ersity b ut the i nd ividual structure of the clas sifiers of the ensem ble. One o f t h e statisti c a l me asures of varianc e such as th e Kho h avi va riance me thod has alre ady been use d to measure st ru ctural diver sity o f an ens emble [9]. T h is stud y ai m s t o find a suitab le meas ure of structural div ersit y by usi ng m ethods adop ted in eco l o gy and also us e th e co n cept of unce rt ainty adop t e d in info r ma t ion theo r y t o better unders tand the ensemb l e diversit y . The entr o p y measures are therefore ai m ed at bringing more know l e dge t o h o w diver sity of an e n semble relates with th e ensemb le ac curacy. H owever this stud y will o nl y foc us on t hree me asures of di v ersit y , Sh a nno n, Sim pson and Berge r Parker to quantify str uctural dive rsit y of th e c l a ssifie rs. S h a nno n entropy h as fou nd its fame i n information theory as it is used to measure the unc erta in ty of states[10]. I n eco l ogy Shanno n is use d to m e as ure th e diver sit y indices of s pec ies, ho w eve r in this study instead of the b i o l og i c al spec ie s the i n div idual clas sif i ers are treated a s species [11]. Fo r ex ample, i f th e re are t h ree spec ies o f di ff erent k i nd, tw o of the same kind and one of anothe r k in d , then that would rep licate t h ree M L P 's of differe nt st ru ct ura l pa ram eter s. T he relation ship between the c l a ssific ation a cc urac y and the entropy measures i s attaine d by the use of gene tic algor i thm s by using a ccuracy as the co st functio n [9]. T h ere are a n umbe r o f ag gregatio n sche m es such a s minim u m , ma ximum , p roduct, ave rage, sim ple m a j o rity, weigh t ed majo rit y , Naï v e Bayes and d ecisio n templa tes to na m e a fe w [ 1 2 ], [ 13]. Ho w ev e r fo r this study t h e ma j o rit y vo t e scheme w as us ed to aggrega t e the indi v idual clas sifiers for a final so lu tio n. T his pape r includes a s ec tion on the b ackgrou nd, Sp ecies a nd t he Ide n tit y Structure (I DS), R en yi Entropy , Shannon entrop y me asure, S i mp s o n Di ve rsi ty Index , Berger P arke r Index, T h e ne ural network pa r ame t ers, G e neti c Algo rithms (GA ), T h e mode l , The data used, R esults and discussion and then la stly the c onclusio n. II . B ACKGROU ND Sh an non entropy ha s been used in i nfo rmatio n th eo r y to quantify uncertainty [10]. T he mea n ing o r implic ation of informa t io n is no t de alt with i n t h i s p aper. How e v er thi s pape r aim s to us e similar c o nc epts. The mo r e informatio n one has the mo re ce rtain one becom e s [10], li k ewise w e can postulate that the mo re di v erse some thi n g is th e mo re unce rtain we b ec ome in kno w ing it s dec ision or outcome. T his can be accredite d to the u se of Shann o n entr o py t o quantify uncertaint y . Entrop y me asures ha ve b een used to comp ute sp ec ies p op ulat io n diver sit y [ 14], howeve r in th is pa pe r a co m mittee of classif iers with diff erent pa r amete rs is co n side red as a comm i ttee of sp ecies. III . S PECIES A ND T HE I DENTITY S TR UC T URE Th e ensem bl e of the c l assif iers was then tre ated a s spec ies w h en viewed in t he pe rs pectiv e of ec o logy or as pop ulation in statist ic s. H ow ever b e fo re the ec olog i c al me t h ods can be applied in giv ing an in dica ti o n of structural dive rsit y , it was impo rtant t h at t h e clas si f iers have a uniq ue identity . T his wa s due to the fac t t h at the ense mb le was composed of classifiers w ith differen t ma chine p ar ame ters such a s t he hidden nodes , learning rate s and t he ty pe of the acti va t io n function u se d. T h e I dentit y Structure (IDS ) was co nver t ed t o a b i n ar y s tring so as to m i m ic a gene ty pe u nique fo r the clas sifiers . F i v e learning rates were c o nsidered and three ac ti v ation functions just as i n[9]. T he nu m be r of hidden no d e s w a s betw een 7 and 2 1 . T hey were ma de lar g er than the attribu t e s so as t o ha v e class i fie rs that could ge neralize well and th e n less t ha n 21 so as to reduce the comp utational c o sts. Th e learning rates cons i dere d w e r e: 0.01 , 0.02 , 0.03 , 0 .0 4, 0.05 and th e activ ati o n f un ctio n s wer e: T h e s i gm oid, linear, a nd the logistic. T his paper is a co ntinuation o f [9]. In this p aper t h ere was no nee d to convert the ident it y into a bina ry str ing since the entropy me asure only l ooks at the m achines which are different. The indi v idual clas sifiers f o r m in g the ensemble were given differen t num be rs a s acco r d i n g t o their identity . Def ining an identity f or e ac h machine is n eces sary s o as t o have a unique iden t i ty of th e class i fie rs wit h in the ens em ble . T his wil l intern e nable t h e use of the unc er tainty mea sur e on the ensemb le. I V. R ENYI E N T R OPY T h e R eny i entrony eq uation ca n be de comp osed into Sha non , B erge r parker and Si mp son’s entrop i es . Th i s cho i ce of the entropy measu re is d e term i n ed by the value of the a l p h a ( ) v ariable, see equ at io n (1)[15]. (1) Wh ere : is the prop ortion o f an it em i. T he di v ersity meas ures can b e foun d by , Shanno n ( ), Simp son’s ( ) and th e Berg er Parker ( ). V. S HANNO N E NTROP Y S h anno n Entropy in informa t ion theo r y is perceived as the m e a sure of uncertainty. If t h e states of t he process ca use t h e pro c es s afte r 10 i tera ti o n s to give a series of on es, th en on e w o uld be ce rtain of t he ne x t preceding info r ma tion. Ho weve r if t he s t a t es are d ivers e then w e becom e uncertain of the outc o me. H aving an ensem b l e of clas sifiers which are all the same , would imply that if one of t h em w er e t o cla ssif y an ob je ct. T h en with high prob a bility all of them would classify t he sam e ob j ec t alik e. Ho wever the mo re di v erse t he e nsemb le become the m ore uncertain on e is of the o v erall d e cisio n of the ense mb le. T his analogy was used t o relate di ver sit y and unce rt ainty in t his pap er. I n i nfo r matio n the o ry the unce rt ainty i s seen as bits pe r s ym b o l[1 0 ]. T h e uncerta inty can be partiall y e x pla i n ed fr om the follo w ing equatio n, by using log s. (2) Where , i s the prob abil ity th at any symb ol appea rs, which means i n t his cas e is the probab i lity of choos ing any cla ssi f ier with i n the ensem ble and is t h e uncerta inty . Equa t io n ( 2) t e nds t o infin ity l ik ewise i f tends t o 1. Shanno n' s general f o r m ula fo r unc e r ta inty , see Eq u ation (3) w hen tends to 1 from equa t io n (1). (3) W here, M is the to tal numb er of the cla ssifie rs. T he maxim u m of Eq uatio n (3 ) o ccurs when the structural dive rsities of the classifiers are equall y like ly. T his m eans when = 1/M fo r all cla ssi f iers, substit ut ing thi s i nto E quatio n (3 ) will result in, l og (M), this is norm all y pe r ce i v ed as spe cies richness in ec ology [11]. F or t his study th e Sh anno n entropy was normalized be tween 0 and 1 by di v idi n g E qua ti o n ( 3) by l og (M) t he maximum poss i b le di ve rsit y index. That mea ns a 1 wi ll me an t h e lar g est uncer t ainty (high di ve rsity i nde x) of t h e sy stem and th e n 0 wo uld m ean no un certainty. VI. S IMPS ON ' S D IVERS I T Y I NDEX When t ak i n g to 2, t he R e ny i entr o py a p prox i m ates to, see e quation (4): (4) I t is b ased o n the i de a that that t he p r o ba bility o f an y two individuals drawn at random f ro m a large eco syste m be l o n g in g to diff erent s p ecies is give n by [16]. T he inver se of th is ex pressio n is take n a s the bio di v ersit y index, t h at m ean s in cr eas es with the eve nnes s of t he distributio n which i s the di v ersity i n dex in t h i s case. A 1 will rep r e sent mo r e dive rsit y and zero no di v ers i ty . T he norm alization was done r emo ving the l og and t h en b y using, 1 - so that as the eve nness i n cre ases so does t h e diver sit y in dex . VII . B ERGER P A R K E R I NDEX T h e Reny i en t rop y a pprox i ma t es to, see Equation (5) [16], when ta king to i n finity : (5) gi v es the equiva lent nu m be r o f equa ll y abundant spec ies with the same rela ti v e abu ndance as the mo st ab undant s p ecies i n t he s ys t em [ 1 6]. T he B er ger Par k er index onl y c o nsiders t he relati v e d om inance of the mo st pop ular s pecies, igno ri ng al l t he o t he r spe ci es . The Berge r Pa r k er in d ex was no r ma li z ed betwee n 0 and 1 b y div i ding by 21 the total nu mb er of the c l a ssifie rs within the en sem bl e. VIII . T HE N EURA L N ETWORK (NN) P ARAMETER S T h e en t ropy measu r es were ba sed on the st ruc t ura l pa ra m eters o f the n eural network. S e e Figure 1 o f the Multi L a y ered Pe rceptron (ML P): Fig ure 1: T he M L P structure show in g the i n puts, t h e la y e r s a n d the a ctiv ation fu n c ti o n An MLP is ma inly used to map th e inp uts t o the ou t p u ts. The activatio n fun ctio n s used in th is paper include the linea r, sigm oid and the S o ft m ax. Th e y can be foun d at th e outer layer of t h e M L P and henc e a re called the activa t ion fu n ctio ns. T h e M L P is also well k n ow n for the hidden node s, bias es and weig hts. I n this study th e ML P is used as a classifier, an ensemble of clas si fie rs i s ma de however with differ ent structura l p ar ame t ers. Th i s me ans the c lassi f iers wou ld n ot all clas sify the same. T h at means tha t if we had the s ame cla ssifie rs wit h the same structura l parame ters t hen we would be ce r tain of the clas sificatio n of th e rest if we h a d in fo r ma ti o n abou t any one of the c lass i f i ca t ion o f o ne classifier. T hat m e ans the d e gree of uncertainty increased as the classifier s were mo r e different. He nce it should be ap p arent that the unce rt ainty is not in duce d by different t raining sch eme s. T h e output of the NN is pe rcei v ed as the pro b a b i lity , see Equation ( 6 ) [17], which descr ibes the outpu t of the neur al n e t wo r k. Th i s mea ns in impleme n ting the metho d of v oti ng w e would be de a ling with the prob ability of ea ch c l assif ier in eit h er ag re eing or rejecting the decisio n tak en by o t he r c lassif iers. W here, and a re the activ ation f unction s at the outp ut layer and at the hid d en l ay er r espe ct ive l y , M i s the numb er of the hidden units, d is the numbe r o f in p ut units, a nd are the weights in the firs t and seco nd layer respective l y when mov in g from inp u t i to hidden u nit j, and is t he b iase s of t he u nit j. Classif iers of different st ruc t ural paramete rs were cre ated. T his was done so as to in d uce st ru ct u ral diversit y on the ens emble . IX. G ENETI C A LGOR I T H MS (GA ) GA ar e e v olutio nary alg o rithm s that aim t o find a global so lu tio n to a certain prob le m d o m ain. The G A make s u se of the princ iples of evolutio nary biology , su ch as m utation, c r o s sover, rep r o du ctio n and n a tural selec t io n [18]. Hence the GA ha s high capabilities t o search l arge spaces for an o p t im al solution. The search p rocess of the GA inc ludes: 1. G enera tion of a populatio n of offspring , m ostl y interp reted a s chromo s ome s 2. A cos t o r ev aluation functi o n, that is use d to contro l the whole process of selection and rejectio n of chromo somes v i a a p r oces s of m utation a and cro s sov er fun ct ions . 3. T his proc ess wil l c ontinue until the f i ttest chromo some is attained or the term ination of the proce ss c an be defined o t h er than the o ne me n tio ned In t his study t he evaluatio n func t io n is the ensemb l e ac curacy, the G A searches for a gro u p of 21 cl a ssifiers that w ould m i nim iz e the c os t function. Th e nu m be r o f classif iers within the ensemb l e was abstra ctly chos en. T h at mean s an ensemb l e t h at will p r o d uce the t arge t ed ac curacy. The G A s e a r c h e s th roug h already trained 120 classif iers . I n es se n ce the GA e v o l v e s the artific ial ma chines (classif i e r s) to a t tain this go al. X. T HE M ODEL T h e mo d e l d escribe s the u se of GA in selec ting the 21 classif iers so as to prov ide knowledge of h ow the ac curacy of the ensem ble relates with the unce rtaint y of the ensemb le. Figure (2) that ill u strates th e use of 120 classif iers in attaining an optimal ensemble for classif icat ion . A m ethod o f v oting is us e d t o aggregate the indiv idual d e cisio n s of the cla ssifiers within t h e ensemb le. Fig ure 2: T he m ethod used to optimize the 21 classifie rs of the 120 class ifiers T h e ev alu a t io n f unction is c ompo sed of two variable s, the ensemble accuracy and t he targ eted accuracy . Eq u ation (7) is used as the evaluatio n function. The ensemb le w as ch osen to ha ve 21 classifiers , th e numb er was m ade odd s o t ha t t h ere would no t b e a ti e d uring vo tin g , and cho s en ab str ac t l y . (7) Whe re: is the eva lu atio n func tion, i s the ac curacy of t he 21 classif iers and is the targe ted ac curacy . T h e GA tries to optimize the accuracy of the ensemble eva l ua t ion f u nc t ion by f ind ing its m aximum . E qua t ion (7) is a parabolic function that has an op t ima l point at ze r o . T his in term would m ean that t he desired a ccuracy would be re a che d . GA w a s first op t im iz e d b y first searching the targ et va lues which th e it could attain. T hese were then the targeted acc u racy va lues for t he c o st functio n . T his was done s o as to r ed u ce the co m putatio n a l cos t since the sea r ch sp a c e w ill b e m i nim i ze d. A. Ensemble Ge nera l ization The classification accu r acy of the en semb le was attaine d by usin g a metho d of v oting to agg re g ate the indiv idual decisio n o f the cl as sifiers . F or every clas sification do ne on the da ta samp le, the num ber o f co rrect class i fic atio n was counted . See Equation (8) for ca lculating the c l assif i c ation a c cu racy of the ensem ble . (8) W h ere : n and N i s the numb er of the co rr ec t clas sification an d t h e t o t al n u mb er of the samp l e data to be classifie d, respec ti v ely . Th e N N w as t ak en as a p r ob ability meas u re outpu t va lues equa l t o or l a rge r th a n 0.5 were take n a s a 1 and ou t p u t v alue s less than 0. 5 we re conside red as zero. XI . T HE D ATA I ntersta t e co nflict d a ta obta in e d was us ed for t his stud y . T h ere are 7 att rib u tes and one out p ut, see t ab l e 1 for the data i np ut fea tures. The ou t p ut is binary , a 0 for n o co nflict and a 1 for c o nflict. T h ere are a total of 27, 737 ca ses i n the co l d war po p ul a t io n. The 26, 846 are th e pea c ef ul dya ds year and 875 conf l ict dy ads y ear [1 9]. T his shows clea rl y th a t the data ar e complic ated for training a neura l networ k. T he data w e r e then do u b led as ac cording t o the training, v alidation and testing data se ts. Fo r th is study th e signi f i ca nce of the data was n o t co ns i d ered. T h is data was used to demo nstrate the s ys te m be havior in rega rds to the entrop y mea sur es. T able 1: T he int e r sta te co nflict data I np uts Values Allies 0 - 1 Continge ncy 0 - 1 Distance Log10(K m) Major Po wer 1 - 0 Capabil ity Log10 Dem ocracy - 10 - 10 Depen dency continuo us Th e d ata was normalized betw een 0 and 1, to ha v e equal weight of all t h e fe a t ures by using Equation (9) so that all fe atures were equ all y weighted f or training. (9) Whe re a n d are t he m i nim u m and max i m u m va lues o f the features of the data samp l es obse r v ed, respe cti v el y . XII . R ES UL T S AND D ISCU SS ION Th e entropy measure s were done on th e ensemb l e of 21 cl a ssifier s. T hese me asures ar e quantified as t h e diver sit y indices of the ensemb l e s. See fig ur e 3 , 4 and 5 for the dive rsity i nde xes an d an indicatio n of t he structural div ersit y of t he en se m ble s. T hese are the results of 11 ensem bles as were sel ec t ed b y the GA. Figur e 3: The Berge r P ark er i ndex of diversit y and accura cy Figure 4: The S i m ps on ’ s diversit y inde x and a ccuracy Fi g ure 5 : The Sh annon di vers ity index and accuracy T h e Shanno n di v ersity index indica t e that at ve r y l o w diver sity index the gene ralization of the ensemb l e is poo r, ho w ev er as t h e d iv ersit y increases s o do e s the accuracy . T h ere see m s t o be a high corre l a tion b e twee n the Sha nno n and t he S impson ' s di v e r sity indice s in re lation to the classif ication accuracy , results fr o m t he Simp s o n 's me asure show s to be mo r e s e nsitive towards high diver sity indice s. Th e Shannon d ivers it y index and the Si mp son’s diver sity indices h av e a d ecre asing accuracy after rea ching a peak acc urac y level, see figure 4 and 5. Th i s indicates that evenne s s on the classif i er s needs t o be limite d for goo d en s emb les. A cc uracies of u p t o 71 % where attained. T he use of a ccuracy as a fu nction of Berg er Pa rker di v ersit y me asure did not show to be a go od functio n of Berge r P ar ker meas ure of structura l diver sity of the ensemb le. This ca n be se en on Figure 3. XIII . C O N C LUSION T his paper presented the use of entropy ba s ed meas ures to qua nti fy st ructural d iv ersit y . T his di v ersity m e as ures where then c ompa red t o the e nsem ble accuracy . T hree me asures of di v er sity in dice s were compare d and it was ob served tha t the ensemble s accu racy imp roved as th e structura l d i v ersit y o f the classi f iers increa s ed. T he other interes ti n g observa tion was t h at o f th e Shannon diversit y index when in te rpreted as the uncertaint y meas ur e f ro m the in f ormatio n theor y . As t he u nce rtaint y of the ense mb le increa se s o d id the class ifica tion of th e ense mb le. T his i m plie s that having more in fo r ma tion of the ensemb le m ight result i n po or genera li z a t ion ability of the ensem ble , hypothetic all y . T h e m ethod u sed to comp ute the results was comp u tatio nall y e xpe nsive d ue to t h e use of G A. T h is p ap er has also sh owed that Entropy based methods can be used to b e tt e r understand the ens emble di v ersit y i n particular ens emble structural diver sity. H owev er the us e of measuring st ru ct u r a l diver sity in b ui lding good ensembles of classif i e r s still rem ains t o be exp lored. REFERENC ES [1] J. Kit tler, M . Hat ef, R. Mat as a nd J. D uin. On combi n i ng cla ssi f iers. I nte ll. 20 (3) . 1998. pp. 226-239. [2] L. Brei m a n. Combini ng pr edic t ors i n: A.J.C Sharkey (Ed.), Combini ng Artifi c i al Neura l Ne t s. Springer. Lon d on : s.n., 1999. [3] H . Drucker. Boostin g using usi n g n e ur al netw o rks, in: A.J. C . Sha rkey (Ed. ) , Combini ng Art ifi cia l N eural Nets. Spr i ng er. London : s.n., 1999. [4 ] G. mor dec h ai , J .H. Ma y and W.E. Spangl er,. Assessing t h e pr edictive accu ra cy of diversit y measure s with domai n - dependent, as ym e tri c miscl assifi c a tion costs. I nf o rmat ion Fussi on 6 . 2005. pp. 37- 48. [5 ] K. Sirl antzis, S. Hoqu e a nd M.C . Fair hu rs t . Dive rsi t y in m u ltip l e c lassifier ensemble s ba sed o n bina ry feat ure q uantisation w ith appl ication to f ace recognition. Depart m ent of Ele ctronic s , Unive rsity of Kent. Unit e d Kindo m : s. n ., 2 008. pp. 437 -4 45. [6 ] F. Giaci nto a nd G. R o li . Hyb rid Me thods in Pa ttern Reco g nitio n. World Scienti fic Press . Si ng apore : s .n., 2 002. [7 ] K.M. Ali a nd M .J. P a zzani. Error red uct i on thr ou g h l earn ing mult iple description s . Mac hine L e arning 24 (3). 1996. pp . 173- 202. [8 ] A. Krogh and J. Vedel s by. Neur al net w ork e nsembl es c ross v alidation and active learning, in : G. Tesau ro, D.S. Touret zky , T.K. Lee n (Ed s . ). MIT P ress , Cambr i dge. 1995. [9 ] L. M asisi, V. N el w a mondo and T. M ar w al a. The effe c t of st ructu r al d iversity o f a n ense m bl e of classiffi ers on classification acc uracy. J ohan ne sbu rg : W itw at ersrand Un i versit y, 200 8. [1 0] Schne ider, T.D . In f ormati on Th eory Primer. s . l. : ww w . lecb. ncifcrf. go v/~t oms , 20 07. [1 1] I. Har ri so n, M. Lavert y and E. Ste rling. S peci es Div ersity. s.l. : Connexi ons Project , 20 0 4. [1 2] L. I . Ku n che v a , M . D ui n a nd R.P . W. Skuri china. An experiment st udy on dive rs it y for bagging and bo osting w it h l inear clas s ifier s . Informati on Fusion 3. 2002. pp. 248 - 250. [1 3] K.Tumer a nd J. G ho sh . Li near a nd order s t ati s t ics com b i ners for pat tern clas s ific a tio n. Com binin g Art ifici al Neural Net s . Lon do n : s.n., 199 9 . [1 4] A.L. Nsakanda , W.L. Price , M. Diaby a nd M. G ra vel. Ensuring pop ulation d iver si t y in g enetic a lgorithm: A te chnic a l not e w it h appl ication to cel l formation p robl em . s.l. : El sevier, 2006. pp. 634 -638. [1 5] R. Kindt, A. Degra n de, L. Turyo mu ru gy e ndo, C. M bosso , P. Van Dam m e and A.J. Si mons . Compa ring spec i es r ichness a n d e venness co n tributi ons to on fa rm tre e div ers i ty f or data s ets with v arying sample sizes fro m K e nya , U ga nda, C am e roo n and Ni geri a w i th r an domize d diversity profi l es . G hent Univer s i ty. Belg ium : s.n. [1 6] Baumgart ner, S. W h y t he measu rement o f s pecies di vers i ty re quires prio r v a lu e judge m ent s. D e part m e nt of e co n om i c s, Unive rsity of Hei delberg . G e rm a ny : s.n., 200 6. [1 7] C. M. Bi s hop. Neur al Net w orks for Pattern Recognition. s.l. : Oxford Univ er sity P ress , 1 995. [1 8] M oh a m ed, S. Dynamic P ro tein Class ification: Adapt ive Models Base d on Incremental Learning Strategies. School of Elect rical a nd I nf ormat ion Engineer ing, The U niver s i ty of the Wi tw at ersra nd, T he s es. 2 006. [1 9] Lagaz io, M. and M arwala, T. Mod e l ing an d Controlling Int erstate Con flict. Witwatersrand . Johannesburg : The Universit y O f the Wi tw at ersra nd.
Original Paper
Loading high-quality paper...
Comments & Academic Discussion
Loading comments...
Leave a Comment