Calibration of Tethered Particle Motion Experiments
The Tethered Particle Motion (TPM) method has been used to observe and characterize a variety of protein-DNA interactions including DNA looping and transcription. TPM experiments exploit the Brownian motion of a DNA-tethered bead to probe biologically relevant conformational changes of the tether. In these experiments, a change in the extent of the bead’s random motion is used as a reporter of the underlying macromolecular dynamics and is often deemed sufficient for TPM analysis. However, a complete understanding of how the motion depends on the physical properties of the tethered particle complex would permit more quantitative and accurate evaluation of TPM data. For instance, such understanding can help extract details about a looped complex geometry (or multiple coexisting geometries) from TPM data. To better characterize the measurement capabilities of TPM experiments involving DNA tethers, we have carried out a detailed calibration of TPM magnitude as a function of DNA length and particle size. We also explore how experimental parameters such as acquisition time and exposure time affect the apparent motion of the tethered particle. We vary the DNA length from 200bp to 2.6kbp and consider particle diameters of 200, 490 and 970nm. We also present a systematic comparison between measured particle excursions and theoretical expectations, which helps clarify both the experiments and models of DNA conformation.
💡 Research Summary
The tethered particle motion (TPM) technique monitors the Brownian fluctuations of a micron‑scale bead that is attached to a DNA molecule anchored on a surface. Changes in the bead’s spatial excursion are interpreted as conformational alterations of the DNA, such as looping, bending, or protein binding. Although TPM has become a staple for single‑molecule studies, quantitative interpretation has been hampered by a lack of systematic calibration linking bead excursion to the physical parameters of the system. In this work, the authors present a comprehensive calibration of TPM signal amplitude as a function of DNA tether length and bead diameter, and they examine how experimental settings—particularly acquisition window length and exposure time—affect the measured excursion.
Experimental design
DNA tethers ranging from 200 bp to 2.6 kbp were prepared, and three bead sizes (200 nm, 490 nm, 970 nm) were attached via standard biotin–streptavidin chemistry. Bead positions were recorded with differential interference contrast microscopy and a CCD camera at 30 ms frame intervals for up to 200 s per molecule. Sub‑pixel tracking was performed by cross‑correlation, yielding two‑dimensional (x,y) trajectories.
Data‑selection pipeline
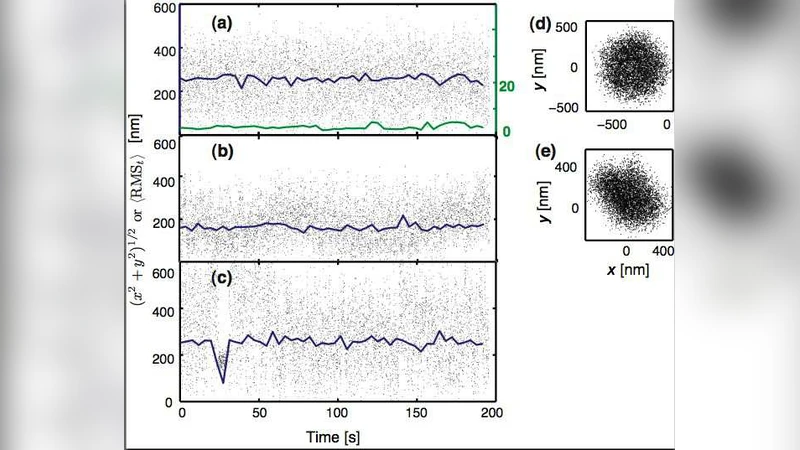
To eliminate artifacts such as stuck beads, multiple tethers, or transient nonspecific adhesion, three automated criteria were applied: (i) minimum motion: RMS < 30 nm (determined from control beads lacking DNA) leads to rejection; (ii) motion symmetry: the covariance matrix of (x,y) must have eigenvalue ratio λ_max/λ_min ≤ 1.1, ensuring isotropic in‑plane diffusion; (iii) uniformity: the 200 s trajectory is split into ten equal segments, RMS is computed for each, and the normalized standard deviation u must be < 0.2. Approximately half of the raw trajectories survive all three filters, providing a high‑quality dataset that truly reflects single‑tether Brownian motion.
Effect of the analysis window
RMS is calculated over a sliding time window t (Eq. 1). Short windows underestimate the true excursion because the bead does not have time to explore the full configurational space; long windows reduce temporal resolution. By varying t from 2 s to 40 s, the authors show that the mean RMS converges to a plateau while its variance shrinks as t increases. The required “safe” t depends on bead size and tether length: 5 s for 200 nm beads, 10 s for 490 nm beads, and 20 s for 970 nm beads. These values correspond to the diffusion time τ_diff of the bead in the effective harmonic potential created by the tether.
Calibration curves
For each bead diameter, RMS was measured across the full range of DNA lengths using the appropriate safe window. The data were fitted to a quadratic function RMS = a L² + b L + c (L = tether length). The fitted coefficients (Table 1) reveal that larger beads produce smaller excursions for a given L (larger a and b) and that a modest negative offset c appears for the biggest beads, reflecting steric hindrance near the surface. The authors also compare RMS obtained with a 4 s window (commonly used in earlier TPM work) to the safe‑window values, showing a systematic underestimation of up to 15 % for the largest beads.
Comparison with theory
The experimental RMS‑L relationship was juxtaposed with predictions from worm‑like chain (WLC) models that incorporate bead‑surface repulsion and the finite size of the bead. Measured RMS values are consistently 5–15 % lower than theoretical expectations. The discrepancy is attributed to residual DNA fragments on the bead, hydrodynamic drag beyond simple Stokes’ law, and the rotational degrees of freedom of the bead, all of which introduce additional constraints not captured in the simplest models.
Practical guidelines
The paper culminates in a set of recommendations for TPM practitioners: (1) select bead size and tether length according to the desired sensitivity; (2) acquire at least 200 s of data to allow reliable window‑averaging; (3) apply the three‑step automated filter to purge defective trajectories; (4) use the calibrated RMS‑L curves (or the provided quadratic coefficients) to translate measured excursions into physical changes in tether length, enabling detection of DNA looping, protein‑induced kinking, or other sub‑10 nm structural transitions.
In summary, this study delivers a rigorously validated calibration framework for TPM, linking bead excursion quantitatively to DNA length and bead diameter while accounting for acquisition parameters and data‑quality filters. The resulting tools substantially improve the quantitative power of TPM, allowing researchers to extract precise geometric information about DNA‑protein complexes from simple bead‑motion measurements.
Comments & Academic Discussion
Loading comments...
Leave a Comment