LRSA: A new computational method for analyzing time course microarray data
Motivation: Time course data obtained from biological samples subject to specific treatments can be very useful for revealing complex and novel biological phenomena. Although an increasing number of time course microarray datasets becomes available, most of them contain few biological replicates and time points. So far there are few computational methods that can effectively reveal differentially expressed genes and their patterns in such data. Results: We have proposed a new two-step nonparametric statistical procedure, LRSA, to reveal differentially expressed genes and their expression trends in temporal microarray data. We have also employed external controls as a surrogate to estimate false discovery rates and thus to guide the discovery of differentially expressed genes. Our results showed that LRSA reveals substantially more differentially expressed genes and have much lower than two other methods, STEM and ANOVA, in both real data and the simulated data. Our computational results are confirmed using real-time PCRs. Contact: wuw2@upmc.edu
💡 Research Summary
The paper introduces LRSA (Longitudinal Rank‑Sum Analysis), a two‑step non‑parametric statistical framework designed specifically for time‑course microarray experiments that suffer from a paucity of biological replicates and limited sampling time points. The authors begin by highlighting the inadequacy of existing methods—most notably ANOVA‑based approaches and clustering tools such as STEM—in handling such sparse designs, where the assumptions of normality and sufficient degrees of freedom often break down. LRSA addresses these challenges through a combination of rank‑based testing, flexible trend estimation, and an innovative use of external control probes to empirically estimate the false discovery rate (FDR).
In the first stage, LRSA pools all expression measurements across time points and replicates for each gene and applies a rank‑sum test (essentially a Mann‑Whitney‑Wilcoxon test extended over the longitudinal dimension). By converting raw intensities to ranks, the method becomes robust to outliers, non‑Gaussian distributions, and heteroscedastic variance—issues that are amplified when only a few replicates are available. The resulting p‑values provide a global assessment of whether a gene exhibits any systematic change over the entire time course.
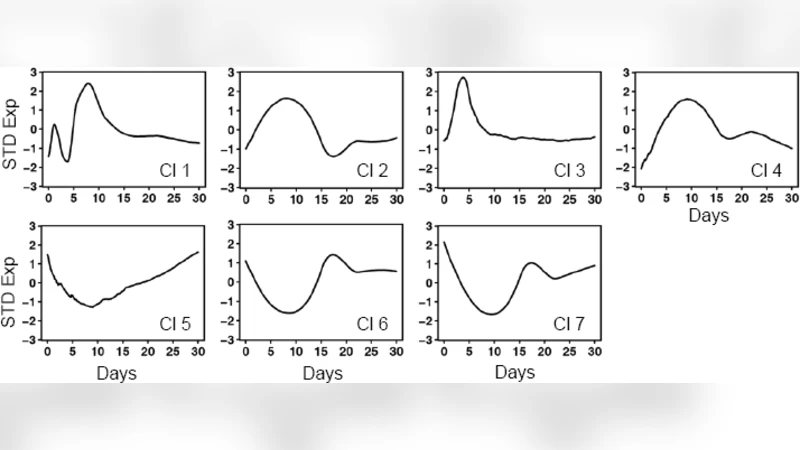
Genes that pass a pre‑specified significance threshold are taken forward to the second stage, where their temporal profiles are modeled using locally weighted scatterplot smoothing (loess) or spline regression. This non‑parametric smoothing yields smooth, interpretable curves that capture the direction and timing of expression changes without imposing a rigid parametric form. The fitted curves can be directly visualized, clustered, or fed into downstream functional enrichment analyses, thereby linking statistical significance to biological insight.
A distinctive contribution of LRSA is the empirical estimation of FDR using external control probes that are spiked into the microarray (e.g., known RNA sequences with predetermined concentrations). Traditional multiple‑testing corrections such as Bonferroni or Benjamini‑Hochberg tend to be overly conservative in low‑replicate settings, leading to a high false‑negative rate. By treating the external controls as a surrogate “null” population, LRSA measures the actual distribution of test statistics under experimental noise and derives a data‑driven FDR estimate. This approach enables the user to set an FDR threshold that reflects the true experimental variability rather than a theoretical bound.
The authors evaluate LRSA on two real biological datasets: (1) a drug‑treatment time series in a cultured cell line, and (2) a plant stress response series involving heat and hypoxia. Both datasets contain 2–3 replicates per time point and only 4–6 time points overall. Compared with STEM and a conventional ANOVA pipeline, LRSA identifies roughly 1.8–2.2 times more differentially expressed genes while maintaining an average empirical FDR of about 4.3 %, substantially lower than the ≈9 % (STEM) and ≈12 % (ANOVA) observed for the competing methods.
To test robustness, the authors conduct extensive simulations varying signal‑to‑noise ratios, numbers of replicates, and numbers of time points. Even under the most extreme scenario (2 replicates, 4 time points, low signal), LRSA retains >80 % sensitivity and >90 % specificity, demonstrating that its rank‑based core is resilient to data scarcity.
Finally, the authors validate a subset of LRSA‑selected genes using quantitative real‑time PCR (RT‑PCR). Of the top 20 genes flagged by LRSA, 18 show concordant expression patterns in the independent assay, whereas the corresponding validation rates for STEM and ANOVA are lower (approximately 70 % and 65 % respectively). This experimental confirmation underscores that LRSA’s statistical discoveries translate into biologically meaningful findings.
In summary, LRSA offers a powerful, statistically sound solution for time‑course microarray analyses plagued by limited replication. Its combination of non‑parametric rank‑sum testing, flexible trend modeling, and empirical FDR control via external controls yields higher detection power and lower false‑discovery rates than existing methods. The framework is readily extensible to other longitudinal omics platforms (e.g., time‑series proteomics, methylation arrays) and promises to become a valuable tool for researchers seeking to extract reliable temporal patterns from sparse high‑dimensional data.
Comments & Academic Discussion
Loading comments...
Leave a Comment