We have studied interoccurrence time distributions by analyzing the synthetic and three natural catalogs of the Japan Meteorological Agency (JMA), the Southern California Earthquake Data Center (SCEDC), and Taiwan Central Weather Bureau (TCWB) and revealed the universal feature of the interoccurrence time statistics, Weibull - log Weibull transition. This transition reinforces the view that the interoccurrence time statistics possess Weibull statistics and log-Weibull statistics. Here in this paper, the crossover magnitude from the superposition regime to the Weibull regime $m_c^2$ is proportional to the plate velocity. In addition, we have found the region-independent relation, $m_c^2/m_{max} = 0.54 \pm 0.004$.
Deep Dive into The Weibull - log Weibull transition of interoccurrence times for synthetic and natural earthquakes.
We have studied interoccurrence time distributions by analyzing the synthetic and three natural catalogs of the Japan Meteorological Agency (JMA), the Southern California Earthquake Data Center (SCEDC), and Taiwan Central Weather Bureau (TCWB) and revealed the universal feature of the interoccurrence time statistics, Weibull - log Weibull transition. This transition reinforces the view that the interoccurrence time statistics possess Weibull statistics and log-Weibull statistics. Here in this paper, the crossover magnitude from the superposition regime to the Weibull regime $m_c^2$ is proportional to the plate velocity. In addition, we have found the region-independent relation, $m_c^2/m_{max} = 0.54 \pm 0.004$.
Statistical properties of time intervals between successive earthquakes, henceforward the interoccurrence times and the recurrence times, have been frequently studied in order to predict when the next big earthquake will happen.
Previous papers have been focused on the determination of the probability distribution and the presentation of the scaling law, as shown in the works of [1,2,3,4,5,6]. For instance, the Weibull distribution [1], the exponential distribution [2], the Brownian passage time (BPT) distribution [3], the generalized gamma distribution [4,5,6], and the log normal distribution [3] are candidates for the distribution function of interoccurrence times and recurrence times. Also, in the stationary regime, a unified scaling law was proposed by Corral [5] and then obtained by analyzing the California aftershock data [6].
Meanwhile, the time interval statistics have been studied by numerical simulations of earthquake models [7], because real earthquake data are limited. For example, both the conceptual spring-block models [8,9] and the sophisticated Virtual California model [10] show the Weibull distribution of the recurrence times. One of the authors (TH) also reported that the survivor function of interoccurrence times in the 2D spring-block model can be described by the Zipf-Mandelbrot type power law [11], which has been observed by Abe and Suzuki [12].
Very recently, a statistical feature of the interoccurrence times, the Weibull -log Weibull transition, was proposed
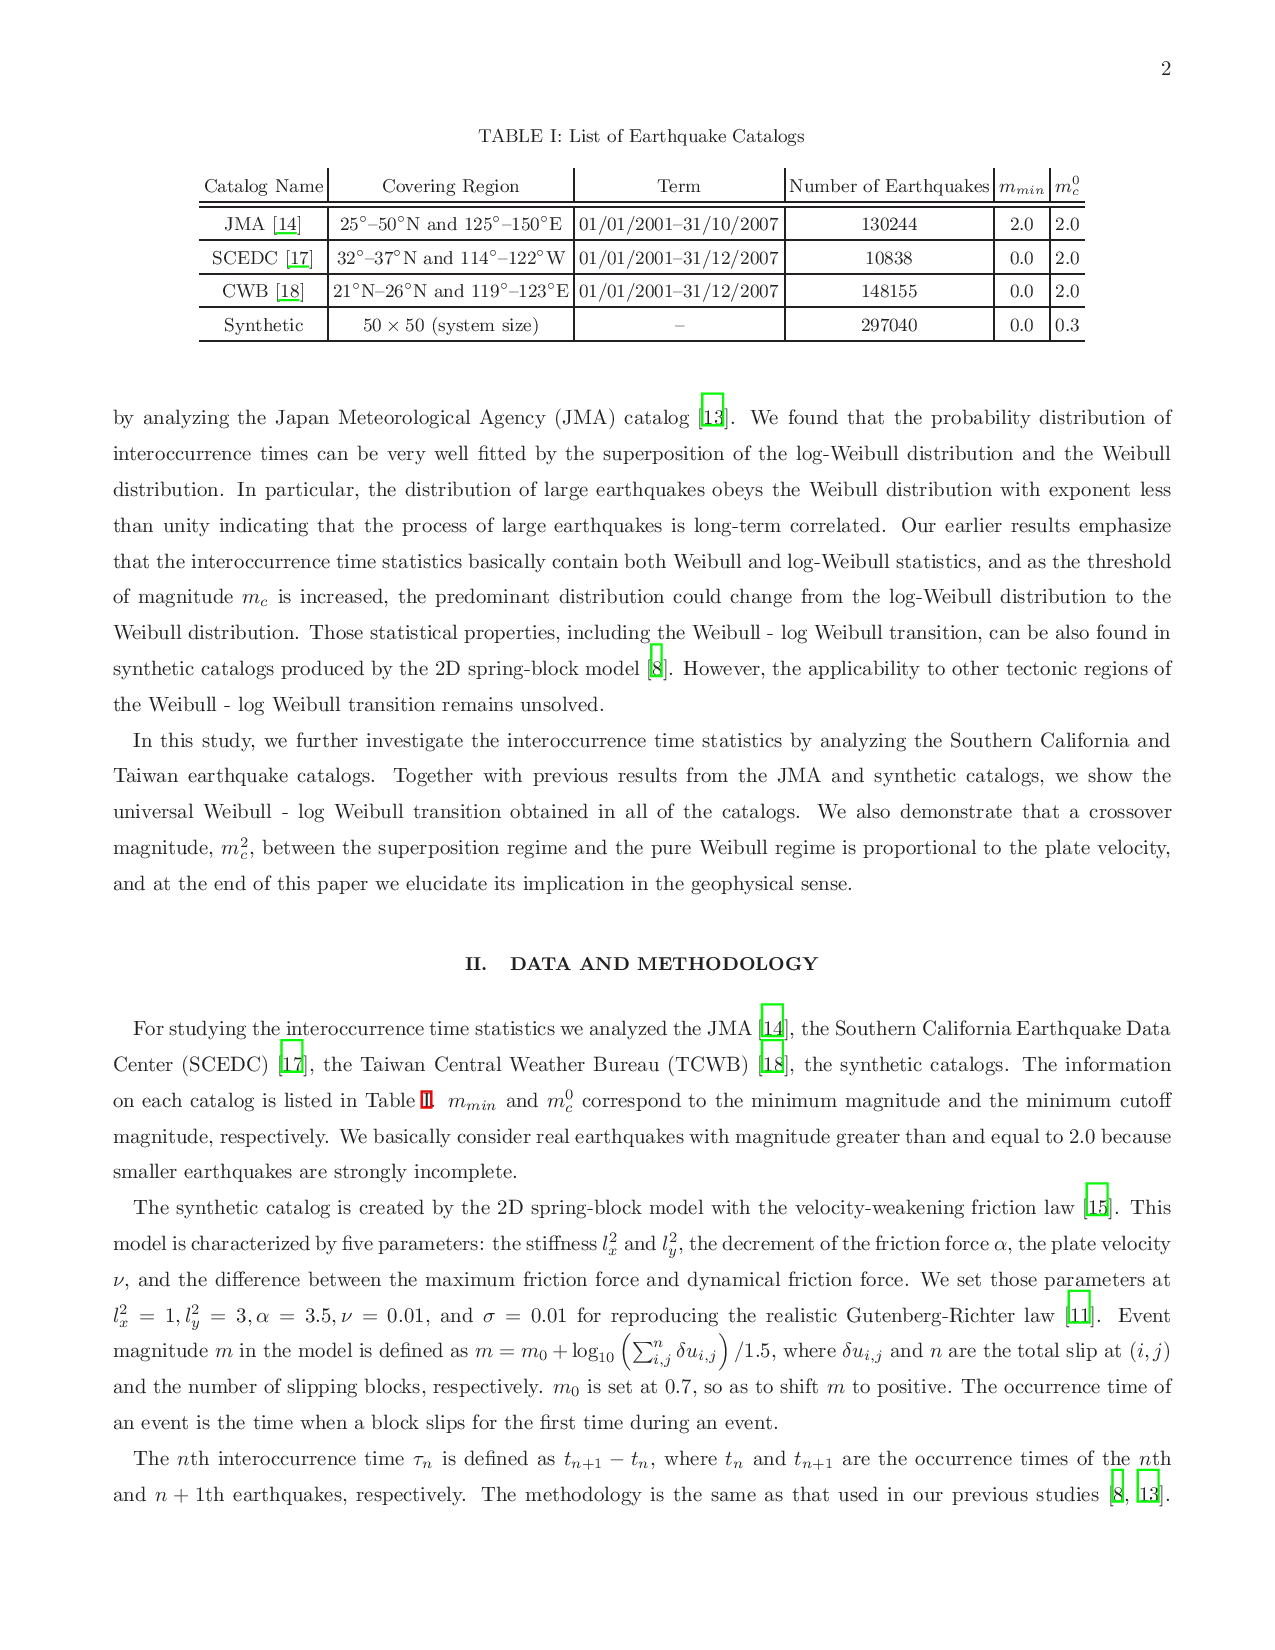
For studying the interoccurrence time statistics we analyzed the JMA [14], the Southern California Earthquake Data Center (SCEDC) [17], the Taiwan Central Weather Bureau (TCWB) [18], the synthetic catalogs. The information on each catalog is listed in Table I. m min and m 0 c correspond to the minimum magnitude and the minimum cutoff magnitude, respectively. We basically consider real earthquakes with magnitude greater than and equal to 2.0 because smaller earthquakes are strongly incomplete.
The synthetic catalog is created by the 2D spring-block model with the velocity-weakening friction law [15]. This model is characterized by five parameters: the stiffness l 2
x and l 2 y , the decrement of the friction force α, the plate velocity ν, and the difference between the maximum friction force and dynamical friction force. We set those parameters at l 2 x = 1, l 2 y = 3, α = 3.5, ν = 0.01, and σ = 0.01 for reproducing the realistic Gutenberg-Richter law [11]. Event magnitude m in the model is defined as m = m 0 + log 10 n i,j δu i,j /1.5, where δu i,j and n are the total slip at (i, j) and the number of slipping blocks, respectively. m 0 is set at 0.7, so as to shift m to positive. The occurrence time of an event is the time when a block slips for the first time during an event.
The nth interoccurrence time τ n is defined as t n+1 -t n , where t n and t n+1 are the occurrence times of the nth and n + 1th earthquakes, respectively. The methodology is the same as that used in our previous studies [8,13]. Earthquakes with magnitude m above a threshold magnitude m c in a studied region were considered. Then, we calculated the interoccurrence times and regressed the interoccurrence times data in the time domain of τ > h. It should be noted that the spatial division was carried out when we examined JMA data. h are set at 0.5 (days) and 0 for real and synthetic earthquakes, respectively.
Our previous works [8,13] revealed that the probability distribution of interoccurrence times P (τ ) can be described by the superposition of the Weibull distribution P w and the log-Weibull distribution P lw , namely,
where
, and k are constants. p is the ratio of P w divided by P (τ ). Obviously, P (τ ) is P lw when p = 0 and P w when p = 1. k is fixed at 0.5. The log-Weibull distribution is constructed by the log modification of the cumulative distribution of the Weibull distribution. Unity δ reduces the log-Weibull distribution to the power law distribution.
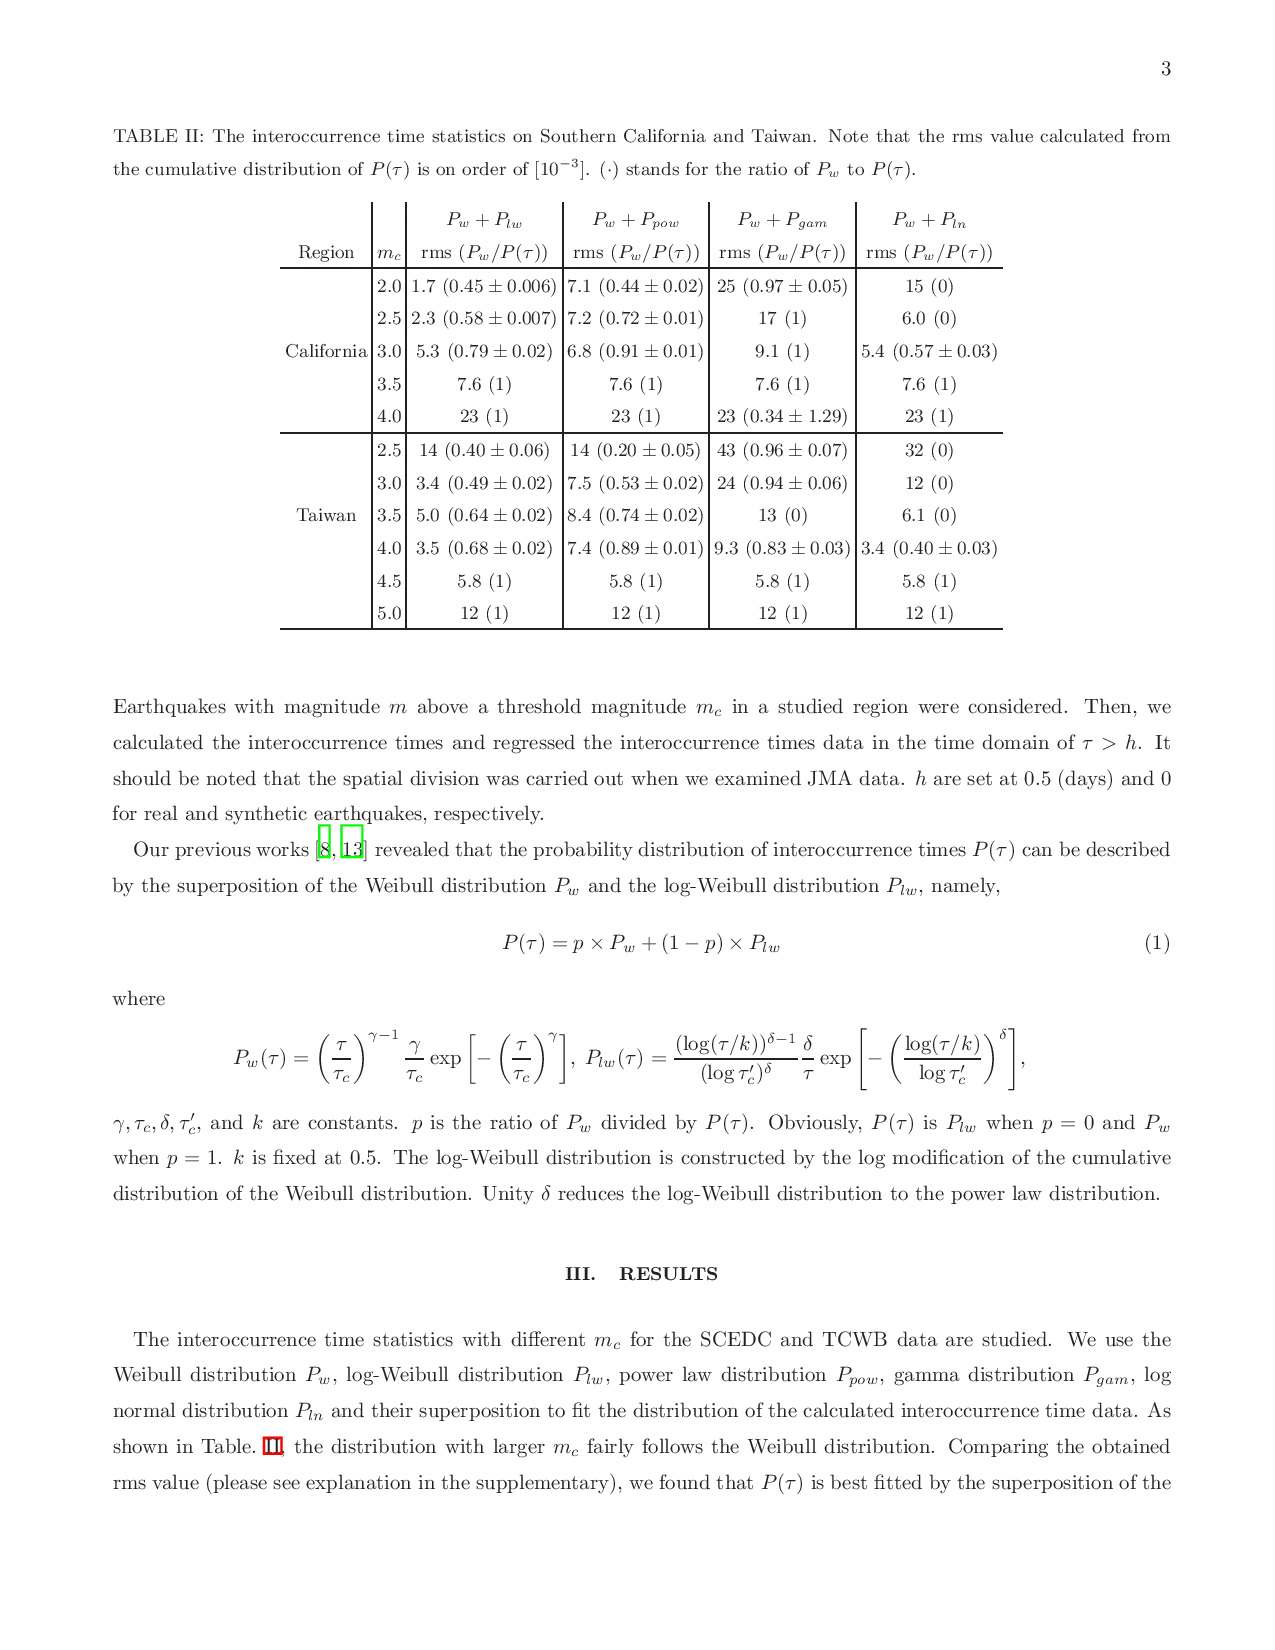
The interoccurrence time statistics with different m c for the SCEDC and TCWB data are studied. We use the Weibull distribution P w , log-Weibull distribution P lw , power law distribution P pow , gamma distribution P gam , log normal distribution P ln and their superposition to fit the distribution of the calculated interoccurrence time data. As shown in Table . II, the distribution with larger m c fairly follows the Weibull distribution. Comparing the obtained rms value (please see explanation in the supplementary), we found that P (τ ) is best fitted by the superposition of the Weibull and log-Weibull distributions. The ratio of P w to P (τ ), p, increases as m c is increased. Thus, we can claim that a transition from the Weibull to the log-Weibull transition occurs in both earthquake catalogs of Southern California and Taiwan. As an example, together with our previous results for the JMA and synthetic catalogs [8,13], we show the cumulative distributions of the interoccurrence time
…(Full text truncated)…
This content is AI-processed based on ArXiv data.