The usual aim of spreadsheet audit is to verify correctness. There are two problems with this: first, it is often difficult to tell whether the spreadsheets in question are correct, and second, even if they are, they may still give the wrong results. These problems are explained in this paper, which presents the key criteria for judging a spreadsheet and discusses how those criteria can be achieved
Deep Dive into Correctness is not enough.
The usual aim of spreadsheet audit is to verify correctness. There are two problems with this: first, it is often difficult to tell whether the spreadsheets in question are correct, and second, even if they are, they may still give the wrong results. These problems are explained in this paper, which presents the key criteria for judging a spreadsheet and discusses how those criteria can be achieved
Many people are, quite rightly, worried that their spreadsheets are producing the wrong numbers. Results summarised by Panko [2000] indicate that about 80% to 90% of spreadsheets contain significant errors. These results are hard to interpret, as the definitions of "significant error" vary; and the samples may be biased, either towards spreadsheets that are thought likely to contain errors, or towards those that are considered particularly useful to their users, and that might therefore have been subject to more intense scrutiny.
Looking at the percentage of individual cells with errors leads to roughly similar conclusions. Field audits (again from Panko) show cell error rates from 0.38% up to 2.5%; laboratory studies indicate rates varying from 1.1 % to 21 %. Again, these results are difficult to interpret: are they percentages of all cells, cells containing formulae, or unique formulae? (If a formula is copied down a row or column, it may count as many formula cells, but only one unique formula).
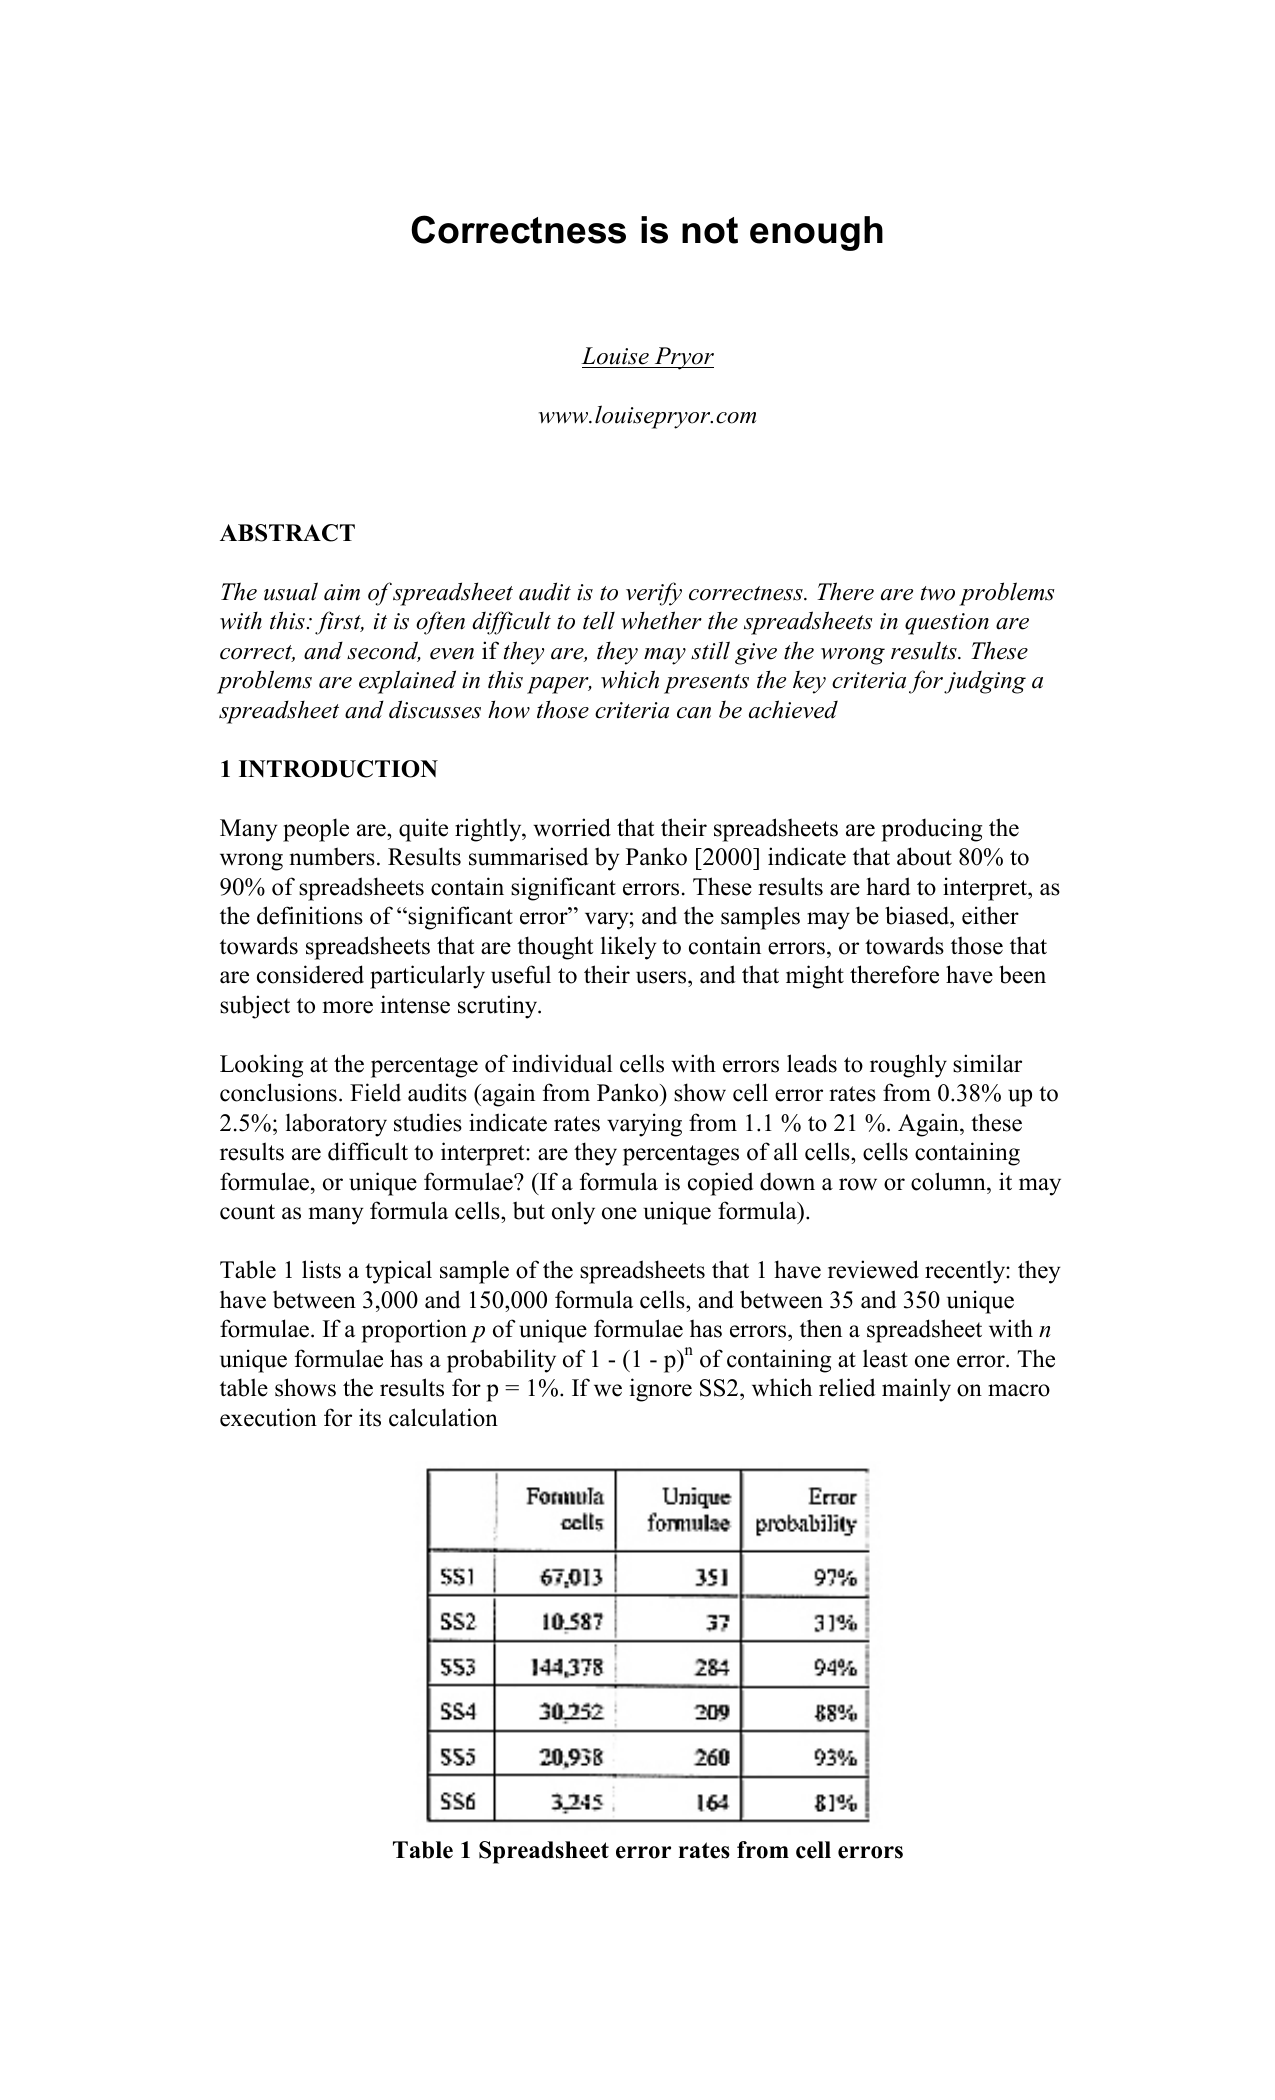
Table 1 lists a typical sample of the spreadsheets that 1 have reviewed recently: they have between 3,000 and 150,000 formula cells, and between 35 and 350 unique formulae. If a proportion p of unique formulae has errors, then a spreadsheet with n unique formulae has a probability of 1 -(1 -p) n of containing at least one error. The table shows the results for p = 1%. If we ignore SS2, which relied mainly on macro execution for its calculation Table 1 Spreadsheet error rates from cell errors (thus introducing another set of problems), the range of error probabilities is 78% to 97%. These rates are consistent with the error rates from the field audits.
It was difficult to test the predictions in Table 1 by determining whether the spreadsheets did actually contain errors. In order for this to be possible the spreadsheets must be both specified and auditable. Most spreadsheets are neither, as discussed in the next section.
Moreover, as discussed in section 3, a spreadsheet that is technically correct may still produce the wrong numbers. Possible causes include poor usability, maintainability, and performance, characteristics that are often considered to be optional extras, affecting productivity but not really central to spreadsheet quality. We’ll discuss why this attitude is misguided.
Most of the spreadsheets that I review, and a high proportion of all spreadsheets, can be viewed as financial models. As such, there are two levels to their correctness: whether the correct model is being used, and whether the model is implemented correctly.
In addition, many spreadsheets use rates, factors and other data imported from elsewhere. This is especially frequent in life insurance, but is common in other industries too.
This section considers the issues of specification and auditability and how they affect the overall correctness of a spreadsheet. In most cases, it is not enough for a spreadsheet to be correct; it must be seen to be correct too.
It is impossible to tell whether a spreadsheet is doing the right thing, in other words whether it is correct, unless you know exactly what it is meant to be doing. You need a specification; you can then check whether the specification has been implemented properly, and whether the specification is itself correct. Both these checks are needed.
Very few, if any, spreadsheets are adequately specified. Generally, the most you can hope for in the way of a specification is one along the lines of “Calculate the rates according to the inputs,” without a hint of what formulae should be used. Although a vague specification is enough to settle some issues, there are often a number of equally plausible ways of modelling the business in question. Without a detailed specification it is impossible for any reviewer to tell whether the method actually used is the one that was intended.
Perhaps the worst example of a missing specification that I have recently encountered was in an industry where capital allowances are extremely significant. One of the key issues in the review was whether they were being handled properly in the spreadsheet. The trouble was that nobody was prepared to say how they should be being handled, and it turned out that nobody had told the developer of the spreadsheet either. However, they had been given another spreadsheet and told to handle them in the same way. Unfortunately the spreadsheet supplied was totally undocumented; moreover, it emerged during discussions that it had been obtained under dubious circumstances from a competitor.
The lack of a specification is, almost certainly, a leading cause of errors; simply clarifying what the spreadsheet is meant to do can often assist in making sure that it actually does it. However, although a specification is necessary it is certainly not
The answers produced by models depend on the inputs; if they cannot be checked it is impossible to say whether the answers are correct. Many models are implemented through a ser
…(Full text truncated)…
This content is AI-processed based on ArXiv data.