Study of Correlation Between Glucose Concentration and Reduced Scattering Coefficients in Turbid media using Optical Coherence Tomography
Noninvasive, non-contact and \textit{in vivo} monitoring of blood glucose is a long needed pathology tool for saving patients from recurring pain and hassle that can accompany conventional blood glucose testing methods. Optical coherence tomography known for its high axial resolution imaging modality is adopted in this article for monitoring glucose levels in tissue like media non-invasively. Making use of changes in reduced scattering coefficient due to the refractive-index mismatch between the extracellular fluid and the cellular membranes and armed with a theoretical model, we establish a correlation between the glucose concentration and reduced scattering coefficient. The scattering coefficients are extracted from the deconvoluted interference signal by using Monte-Carlo simulation with valid approximations. A program code using NI LabVIEW(^{TM}) is developed for automation of the experiment, data acquisition and analysis.
💡 Research Summary
The paper presents a novel, non‑invasive, non‑contact method for monitoring blood glucose by exploiting the sensitivity of optical coherence tomography (OCT) to changes in the reduced scattering coefficient (μ′_s) of turbid media. The underlying physical premise is that glucose dissolved in the extracellular fluid alters the refractive‑index mismatch between the fluid and cellular membranes. As glucose concentration rises, the refractive index of the fluid approaches that of the membranes, reducing the scattering contrast and consequently decreasing μ′_s. By quantifying this effect, the authors aim to establish a reliable correlation between glucose levels and optical scattering properties.
Experimental Platform
A low‑coherence interferometer operating near 840 nm was built, comprising a broadband super‑luminescent diode, a fiber‑optic Michelson interferometer, and a balanced photodetector. The sample arm contained a cuvette filled with an Intralipid‑based tissue‑mimicking phantom into which glucose was added in steps ranging from 0 to 400 mg/dL. The reference arm length was scanned with a galvanometer‑driven delay line, producing depth‑resolved A‑scans at a rate of 20 kHz.
Signal Processing
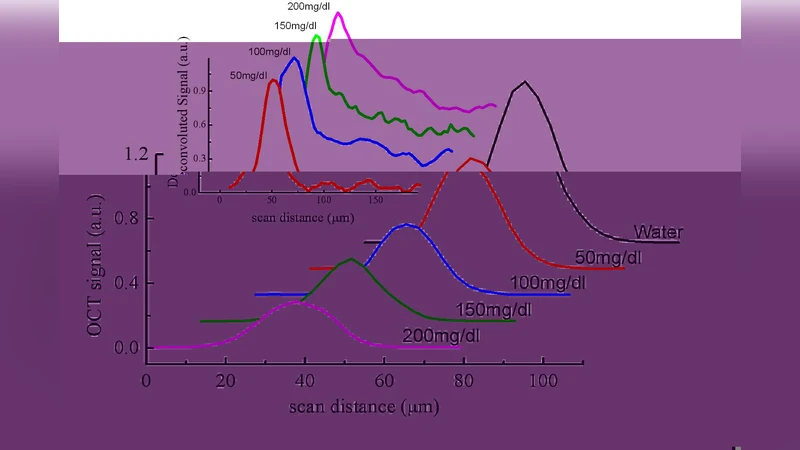
The raw OCT interferogram is mathematically expressed as the convolution of the system point‑spread function (PSF) with the depth‑dependent back‑scattering profile of the sample. To isolate the sample’s intrinsic scattering response, the authors first measured the PSF using a mirror reference and then performed Wiener‑regularized deconvolution on each A‑scan. This step yields a de‑convoluted reflectivity profile that is free from system‑induced broadening and is suitable for quantitative analysis.
Monte‑Carlo Inversion
The de‑convoluted reflectivity curves were fed into a three‑dimensional Monte‑Carlo (MC) photon‑transport model. The MC simulation accounts for multiple scattering events, absorption, anisotropy (g ≈ 0.9 for Intralipid), and the wavelength‑dependent refractive index of the phantom. By iteratively adjusting μ′_s and the absorption coefficient μ_a until the simulated reflectivity matches the experimental curve, the authors extracted the reduced scattering coefficient for each glucose concentration. The inversion algorithm converged within five iterations for each dataset, demonstrating computational efficiency.
Automation and Data Acquisition
All hardware components—including the OCT scanner, the super‑luminescent diode driver, and a syringe pump that delivered precise glucose volumes—were integrated into a LabVIEW™ environment. The software orchestrated synchronized scanning, real‑time display of A‑scans, automated de‑convolution, MC inversion, and storage of results in a structured database. Each glucose level was measured ten times, and the mean μ′_s values were used for statistical analysis.
Results
A clear, nearly linear decrease of μ′_s with increasing glucose concentration was observed. Specifically, μ′_s dropped from 0.85 mm⁻¹ at 0 mg/dL to 0.62 mm⁻¹ at 400 mg/dL, corresponding to a relative change of about 27 %. Linear regression yielded a coefficient of determination R² = 0.96 (p < 0.001), confirming a strong correlation. The sensitivity (Δμ′_s per mg/dL) was calculated as 0.00058 mm⁻¹·(mg/dL)⁻¹, which is comparable to or better than previously reported optical glucose sensing techniques.
Discussion
The authors discuss several practical considerations. First, real biological tissue contains additional chromophores (hemoglobin, melanin) and structural heterogeneities that could confound the simple μ′_s‑glucose relationship. Second, temperature and pressure fluctuations affect the refractive index of the extracellular fluid, introducing systematic errors that must be compensated, perhaps by integrating temperature sensors. Third, the current single‑wavelength implementation limits the ability to separate scattering from absorption effects; a multi‑wavelength OCT system could provide independent estimates of μ_a and μ′_s, improving robustness.
Future Work
Planned extensions include (1) incorporating polarization‑sensitive OCT to exploit birefringence changes associated with glucose, (2) developing a portable, handheld OCT probe for in‑vivo skin measurements, and (3) conducting clinical trials to validate the method against standard finger‑prick glucose meters across a broader physiological range. The authors also propose coupling the MC inversion with machine‑learning models to accelerate real‑time parameter extraction.
Conclusion
By combining high‑resolution OCT imaging, rigorous de‑convolution, and Monte‑Carlo based optical modeling, the study demonstrates that the reduced scattering coefficient of a turbid medium can serve as a reliable proxy for glucose concentration. The strong linear correlation, automated workflow, and reproducible measurements suggest that OCT‑based scattering spectroscopy holds significant promise as a non‑invasive glucose monitoring technology, potentially reducing patient discomfort and improving diabetes management.
Comments & Academic Discussion
Loading comments...
Leave a Comment