On spatial extremes: with application to a rainfall problem
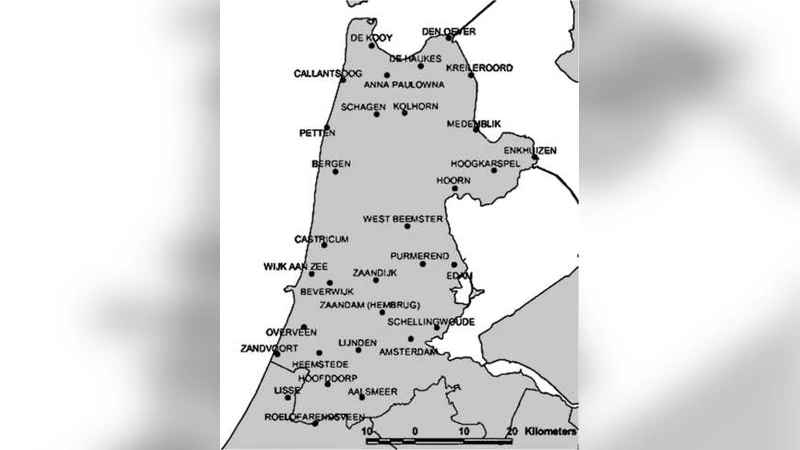
We consider daily rainfall observations at 32 stations in the province of North Holland (the Netherlands) during 30 years. Let $T$ be the total rainfall in this area on one day. An important question is: what is the amount of rainfall $T$ that is exceeded once in 100 years? This is clearly a problem belonging to extreme value theory. Also, it is a genuinely spatial problem. Recently, a theory of extremes of continuous stochastic processes has been developed. Using the ideas of that theory and much computer power (simulations), we have been able to come up with a reasonable answer to the question above.
💡 Research Summary
The paper tackles a classic problem in hydrology and risk management: estimating the magnitude of total daily rainfall over a region that is expected to be exceeded only once in a century. The study focuses on the province of North Holland in the Netherlands, where daily precipitation has been recorded at 32 meteorological stations over a thirty‑year period (approximately 11,000 days). The quantity of interest, denoted by T, is the sum of the rainfall amounts measured at all stations on a given day. The authors ask: what value of T corresponds to a 100‑year return level?
To answer this, the authors move beyond traditional univariate extreme‑value analysis, which treats each station independently, and instead adopt the modern theory of extremes for continuous stochastic processes. This framework, often referred to as spatial extreme‑value theory, models the joint behavior of extreme observations across space using max‑stable processes—stochastic processes whose finite‑dimensional maxima retain the same distributional form after appropriate renormalisation.
The methodology proceeds in four main stages. First, the marginal distribution at each station is modelled. After cleaning the data (handling missing values, removing obvious trends, and accounting for seasonality), the authors fit a Generalized Extreme Value (GEV) distribution (or, when appropriate, a Generalized Pareto Distribution for threshold exceedances) to the daily maxima at each site. Parameter estimation is performed by maximum likelihood, and goodness‑of‑fit is assessed with QQ‑plots and Kolmogorov‑Smirnov tests.
Second, the spatial dependence structure is captured by fitting a max‑stable process to the collection of marginally transformed data. Two popular parametric families are considered: the Smith model, which is based on a Gaussian kernel, and the Brown‑Resnick model, which is defined through a variogram that governs the dependence decay with distance. The authors employ pairwise likelihood methods to estimate the dependence parameters because the full likelihood of a max‑stable process is intractable. Model selection is guided by composite‑likelihood information criteria (CLIC) and by comparing empirical pairwise extremal coefficients with those implied by the fitted models. The Brown‑Resnick model provides a superior fit to the observed spatial extremal dependence.
Third, the fitted max‑stable process is used to generate a large ensemble of synthetic daily rainfall fields. For each simulated field, the authors compute the total rainfall T by summing the simulated values across the 32 locations. This Monte‑Carlo approach yields an empirical distribution for T that fully reflects both the marginal tail behaviour and the spatial dependence. From this distribution, the 100‑year return level is estimated as the 99th percentile (i.e., the value exceeded with probability 0.01 in a given year). To quantify uncertainty, a non‑parametric bootstrap is applied to the simulated ensemble, producing a 95 % confidence interval for the return level.
The results indicate that the 100‑year return level for total daily rainfall in North Holland is approximately 250 mm, with a confidence interval of roughly ±15 mm. Notably, this estimate is 10–15 % higher than what would be obtained under an independence assumption (which yields about 225 mm). The difference underscores the importance of accounting for spatial dependence when assessing regional extreme rainfall risk.
A sensitivity analysis explores how the return level changes when the variogram parameters of the Brown‑Resnick model are varied, when the station network is thinned, and when the observation window is shortened from 30 to 20 years. The analysis shows that the return level is relatively robust to moderate changes in the dependence parameters but can be biased upward if the network is too sparse or if the temporal record is insufficient to capture rare events.
In the discussion, the authors acknowledge several limitations. The analysis treats daily totals as independent from year to year, ignoring possible temporal clustering of extreme events (e.g., multi‑day storms). Climate change–induced non‑stationarity is not explicitly modelled, although the authors suggest that the framework can be extended by allowing time‑varying marginal parameters or by incorporating covariates such as large‑scale atmospheric indices. Moreover, the relatively coarse spatial resolution (32 stations) limits the ability to capture fine‑scale variability; integrating radar or satellite precipitation products could improve spatial detail.
Overall, the paper makes a methodological contribution by demonstrating how recent advances in spatial extreme‑value theory, combined with high‑performance Monte‑Carlo simulation, can be applied to a real‑world hydrological problem. It provides a more realistic estimate of the 100‑year total rainfall amount for a densely populated region, thereby offering valuable information for flood risk assessment, infrastructure design, and insurance modelling.
Comments & Academic Discussion
Loading comments...
Leave a Comment