Reducing Spreadsheet Risk with FormulaDataSleuth
A new MS Excel application has been developed which seeks to reduce the risks associated with the development, operation and auditing of Excel spreadsheets. FormulaDataSleuth provides a means of checking spreadsheet formulas and data as they are deve…
Authors: ** Bill Bekenn, Ray Hooper (Fairway Associates Ltd., 영국) **
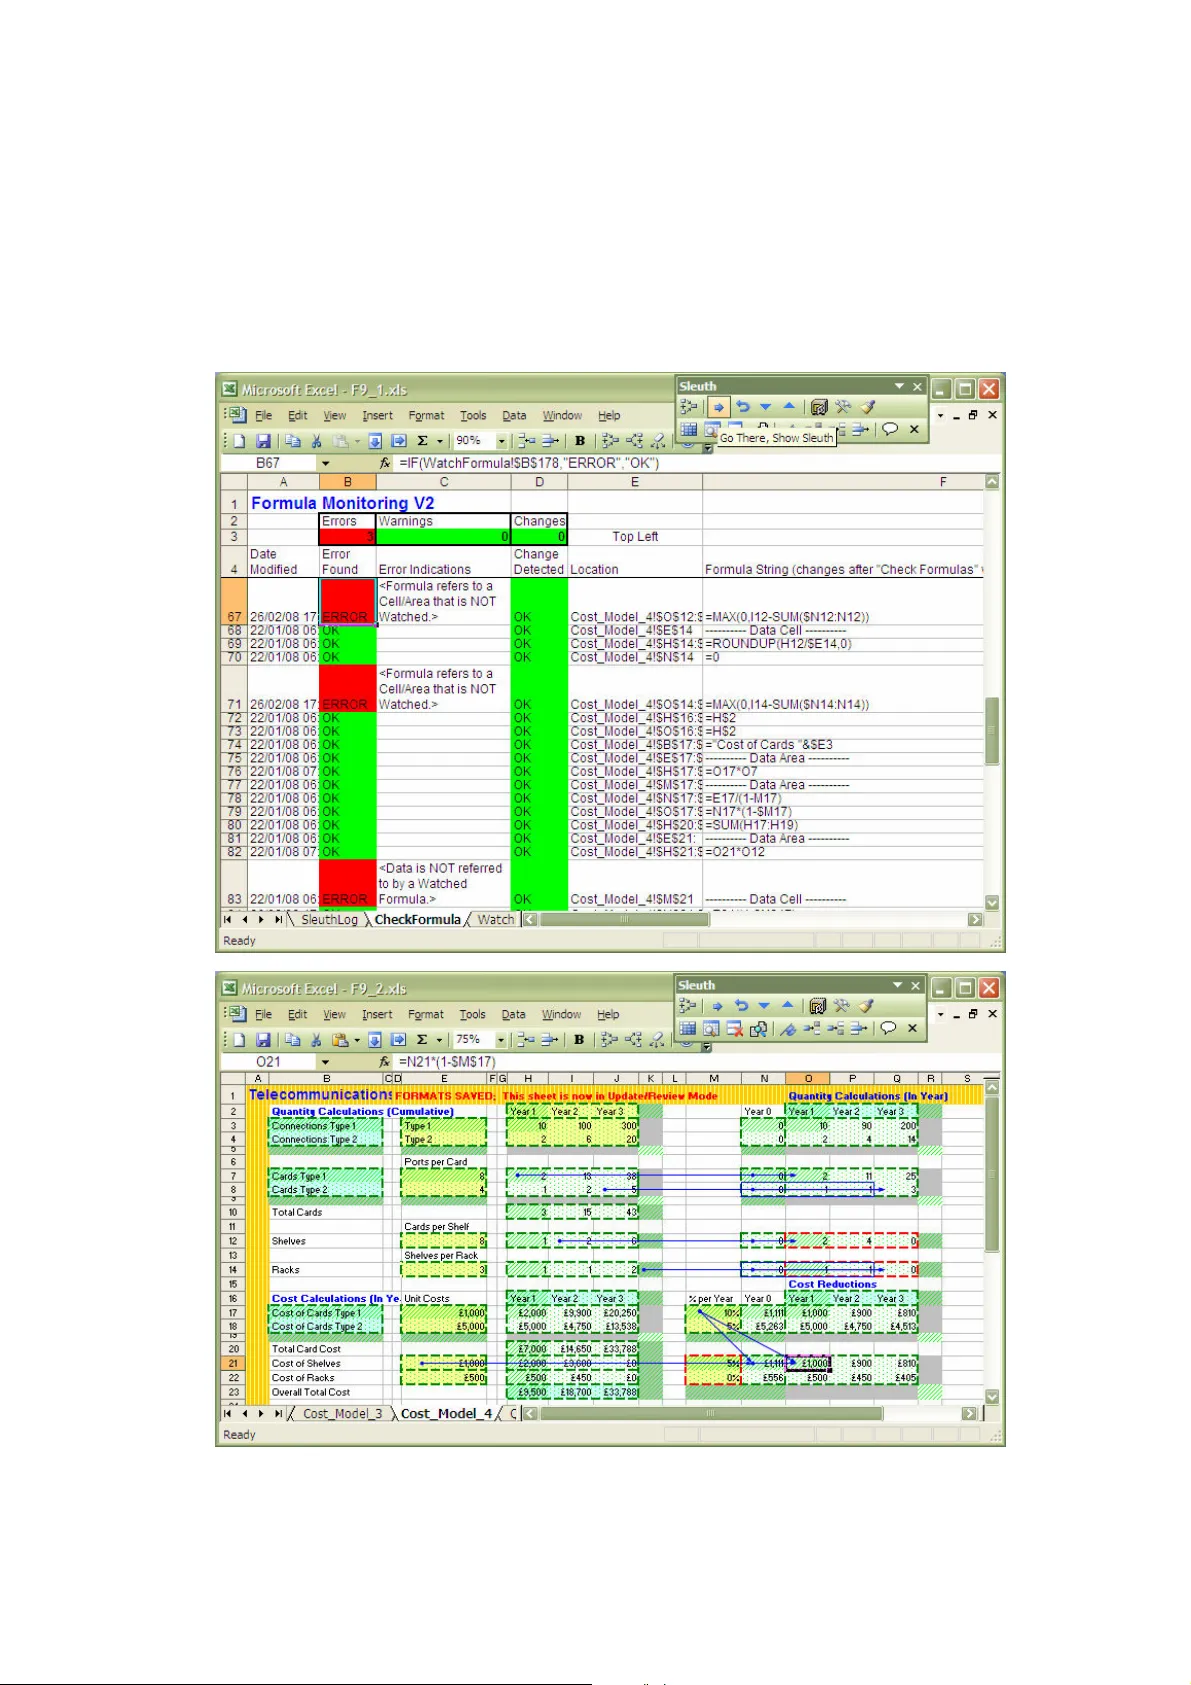
Reducing Spreadsheet Risk with F ormula D ata S leuth ® Bill Bekenn and Ray Hooper Fairway Associates Ltd. P O Box 846, Ipswich I P5 3TT, UK E mail: info@fairway associates.co.uk Web: www.fair wayassociates.co.uk ABSTRACT A new MS Excel applicatio n has been develo ped which seeks to reduce the risks a ssociated with the dev elopment, op eration and auditing of Excel spreadsheets. F or mula D ata S leuth ® p rovides a means of checking spreadsh eet formula s a nd data as they are develo ped or used, enabling th e users to iden tify a ctual or potentia l errors quickly an d th ereby halt their propa gation. I n th is paper, we will descr ibe, with exam ples, h ow th e ap plication works and ho w it can be ap plied to reduce th e risks associated wit h Excel sprea dsheets. 1. INTRODUCTION. MS Excel, li ke many powerf ul and f lexible computer applications i s prone to “misuse” and error to which even experienced users ar e not immune. I t has been estimated that 94% of spreadsheets have at least one error i n them [Panko, 2005]. There are many cases of spr eadshee t e rror opening up busines s and o ther org anisations to serious financial risk [EuSpRIG, 2007] and [Croll , 2005] or worse [Croll, 2006]. Reductions in risk can be brought about by i mprov ed development practice [O’Beirne, 2005] and [Read & Batson, 1999] and training. Many Excel users a re perhaps not fully a ware of the vulnerabilities of the application and are thus likely to remain unaware of the need for training. The role of the spreadsheet auditor will grow as companies become increasingly concerned about their vulnerability to spreadsheet error. Developers working with rapidly changing requirements have a need for an application to assist and aid t heir work to pre vent errors at source. In this paper, F ormula D ata S leuth ® will be described. T his is a new application produced to reduce the risks associated with t he development, auditing and operation of MS Excel spreadsheets. Some of Excel’s vulnerabili ties will be described, i ncluding its methods of auditing, formula analysis and error detection. An overview of the major features of F ormula D ata S leuth ® , including those central to the reduction of spreadshee t risk, will then be presented. The principles of opera tion will be described including th e WatchFormula sheet, which plays a pivotal role in the opera tion of the application. A simple example from teleco mmunications systems cost analysis will then be prese nted. 2. EXCEL VU LNERABILITIES. Excel has some features to help developers and auditors avoid or detect errors. However, in practice, these can be somewhat “hit and miss”. Excel’s security and prot ectio n features tend to be unused when spreadsheets are continually being changed. The “ green triangles” t hat warn of formula irregularities do not work in every sit uation. For e xample , a range vulnerability occurs when adding rows, so that on inserting rows above a cell with a column summ ation of formulas, no g reen warning triangle appears to show that the range is missing the new row. The order in which cells are i nserted a nd formulas are Reference Formula Flags : Change Detected, E rror Found, Final Res ult. Area Elements Reference For mula Cell/range refere nces Functions Const ants Area Properties : Location, size, watched or not watched, for mula or data. filled can also give rise to errors t hat are not flagg ed by a green triangle. The formula display feature, which places t he f ormulas in the cells (as opposed to calculated values), can pr esent the auditor w ith a daunting “spot t he error” task in all but the simplest spreadsheets. Structural issues can a rise from the m any different ways ce lls are r eferenced (r elative, absolute, mixed or N ame). Spreadsheet dev elopment and restructuring can be comprom ised by vulnerable reference dollaring causing err ors in “ copy and pa ste” a nd fill operations. The problems grow with the number of sheets and workbooks and i nter- workbook links are a sig nificant additional source of e rrors. 3. OVERVIEW O F F ormula D ata S leuth ® . F ormula D ata S leuth ® is a n Excel application in t he form of a workbook that “watches” a target Excel spreadsheet, workbook or group of workbooks. Information from contiguous areas of formulas and data (a single cell is a special case of an a rea) is recorded. For formula areas (data areas are treated slightly differently), this information falls into one of three categories as shown i n figure 1: 1. A rea Elements - information about the elements of the formulas of those areas e.g. cell references, 2. A rea Properties - information re lating to the properties of the a reas e.g. location, 3. F lags e.g. Error Found. Figure 1. F orm ula D ata S leuth ® Elements and Propert ies of Contiguous Formula A reas. Formula Area Elements are the components and term s of t he formula. Note that Area Properties include whether the area is watched or not. Only wat ched areas are recorded, other areas are “Not Watch ed” by default. The user det ermines what is watched. The information depicted in f igure 1 together with seven linked procedures, described in section 4, is accessed through a special Sleuth toolbar (shown in section 5) . The Area Elements, Properties and Flags are contained in the WatchFormula sheet t hat is added to the target workbook by the application. The user interface is designed t o allow “one-click” access t o the application’s procedures. Messages within user forms assist the user in choosing options and the course of action on flagging an error or change. The application may be used as a development tool for new spreadsheets or as an improvement tool f or existing ones . It can be used a s an auditing t ool and generates an audit trail. It may also be used in spreadsheet op eration (when only data is being changed) to ensure users do not inad vertently damag e a spreadsheet. 4. PRINCIPLES OF OPERATION. The WatchFormula sheet is at the heart of F ormula D ata S leuth ® . Information in the form of Elements, Properties and Flag s is manipulated in the WatchFormula sheet by the actio n of procedures selected f rom t he special S leuth toolbar. These pro cedures are E rror Checking and Reconciliation, Spreadsheet Restructuring and Updating, Multiple Insert/Delete, and, Sheet and Block Replication. These and other p rocedures wil l be illustrated in section 5. 4.1. The WatchFormula S heet This sheet records, in the target workbook, all the specific information about the Formula and Data Areas. For form ula areas this information is:- 1. A rea Elements Information a. the current formula string in R1C1 format for the area, b. the last watched form ula string in R1C1 format for the area, c. the parsing of formulas in to references (single ce lls or ranges and Excel Nam es), d. the details of inter- workbook links for destination refe rences. 2. A rea Properties Information a. the target sheet nam e, b. the location of the area/cell in t erms of its extent, recorded as top left and bottom right rows and colum ns, c. the details of Excel Nam es referring to watched areas, d. the details of the sources o f inter-work book links, e. the name of any area that h as been designated as a gro up (see section 4.4), f. the status, particularly w hether it is a “final result” wit h no dependencies. 3. F lags a. the occurrence of chang es to the Formula Areas, b. the occurrence of errors. Areas of cells where a form ula ha s been filled/paste d, so that all t he cells co ntain the same generic f orm ula (the reference formula of figure 1), are treated as a single formula. Selected For mula Areas appear in the WatchFormula sheet after “watching” is initiated from the Sleuth toolbar. Changes t o watched areas are aut omatically recorded as they are made, but a record of the previous Formula Area is logged. It i s pos sible to cancel the “watching” of any previous ly watched area from the Sleuth too lbar. A summary of the WatchFormula sheet is shown in a C heckFormula Sheet en tered in the target workbook autom atically by the Sleuth. This she et lists the formulas and data areas, facilitates rapid navig ation and highlights “warning s” of irregularities as well as e rrors. In Excel 2003 the WatchForm ula and CheckFormula sheets can han dle up to 10,000 form ula and data areas and 60 sing le cell or range references p er formula area. 4.2 Error Checking and R econciliation The Error Found Flag is set T rue whenever the comparison of t he current and pr eviou s watched areas shows irreg ularities in the Area Elem ents. Error checking i s instigated from t he Sleuth toolbar. There are three main types of formula irregularities that the procedure identifies: 1. F ormulas that have been “dam aged” or overwritten with data or ano ther formula, 2. F ormulas containing references to cells or ranges which have not been watched or don’t exactly m atch a watched area; these are invalid preceden ts, 3. D ata and Form ulas in Areas, which are either not referred to by other watched formulas or referred t o inconsistently; these are invalid depe ndents. Final Results a re watched and have no depen dents and are thus valid and not flagged as errors. Figure 2. Reconciliation: E xamples of Invalid Precede nts and Dependents In the case of damaged form ulas only the For m ula Elem ents of the Current and Watched Areas are c om pared. Figure 2 shows the more complex situation of re conc iliation of precedents and dependents. T he current watched area’s (centre, red box) Precede nts (left, green boxes) are examined. If the Area Properties of these Precedents are found to not exactly match those in t he WatchForm ula sheet then an error is flagged. Two examples of this situation a re shown to t he left in figure 2 where the properties ( location, size etc.) of the precedent areas (l eft, green boxes) do not match with the watched areas (l eft, red boxes) . T his depicts preced ents that are not watched (top) and partially watched (bottom) and are thus invalid. The situation of the Dependents is similar to the Prece dents with the current watched ar ea (centre, g reen box), now being the Precedent, having its Dependent (right, red box) examined. Dependents ca n only be discovered by work ing backwards to find Precedents for all watched areas. There are four possible conditions: 1. there a re, in fact, no dependents and, a. if the current area is a For mula Area it may be a Final Result, b. if the current area is a Dat a Area it is an error, 2. there are dependents but they are not watched and therefore it is not recorded that they exist (top right of figure 2), 3. there are watched dependents but they don’t m atch exactly to the current watched area (bottom right of figure 2), 4. there a re watched dependents that are m atched and there is no obvious er ror. Vulnerable reference do llaring i s also flagged as an er ror or warning by the Sleuth. Examples of this include checking tha t a single cell reference is absolute and that single row/column references use absolute row/column. Precedents Current Area WATCHED WATCHED UNWATCHED AREA Dependents 4.3 Spreadsheet Restruct uring and Updating Spreadsheets are o ften extended or enhanced with a) additional rows or columns and b) the movement of f orm ulas and da ta blocks within sheets and to d ifferent sheets. As additional d ata and formula ar eas are created they can be Watched using the Watch Formula (and Fill), Watch Data button. When blocks of form ulas and data are moved (including between sheets) the WatchFormula sheet tracks the moves and re- calculates the current for mulas for the mov ed areas and any dependent areas. T he Check W atched Formulas button can be used at any time to see whether t he movement of blocks (by "cut and paste" or "drag and drop") has caused any errors in the formulas. In most case s the Fix Selected Area/Cell, Accept Changes button can be used to correct any errors caused. However, where key cel ls have bee n deleted the Watch information may be damaged. In this case, the error wil l still be detected and can be corrected manually and then re- Watched. When areas of a she et ar e to be co m pletely re-worked the Watches can be deleted using the Delete (or clean up) Watch Entries bu tton. Once the re-work is complete the Find Formulas button can find and highlight the ne w formulas, which can also be watched individually or aut omatically. 4.4 Multiple Insert /Delet e The Sleuth has a procedure for inserting or deleting r ows or columns in m ultipl e connected watched areas (i.e. replicated structured blocks; a common feature of spreadsheets). The connected areas can be in a spreadsheet, workbook or group o f workbooks. This uses an Area Property defining each of the connected areas as a Group. The Sleuth toolbar’s Group button allows the user to define the connected areas and e nter a common Group name, which is recorded on the WatchForm ula sheet. W hen additional rows or c olum ns ar e required in all the connected areas, the row above (or the colum n to the left of) the insertion is selected in one of the are as and the Sleuth toolbar’s Inser t Rows/Columns Below/Right ( in Group) is clicked. This inserts rows below or (columns to the right) in all the connected areas with that Group name. If the insertion occurs in a formula area, then the formula is filled from th e Reference Formula of that watched area. Multiple row or column i nserts are supported. T his procedure is also availab le in the Sleuth toolb ar for deletes a nd for the more norm al insert row above (or colum n to the left). The Sleuth’s multiple insert/delete procedure is configured to obviate Excel’s range vulnerability. If, for example, the selected row is just above a column summation, when the Insert Rows/Columns Below/Right (in Group) button is clicked an extra blank row is added below the inserted row and ranges a re adjusted to i nclude it. This extra row is greyed and will be checked to e nsure it remains blank. T here is then no possibility t hat any furt her inserted row will be missed in a summation or other function relating to the altered range, provided the Sleuth t oolbar i s used. Manual row insertion now also works avoiding the range vulnera bility. 4.5 Sheet and Block Rep lication The S leuth has a procedure for replicating a set of watche d areas (which c an be in different sheets or workbooks); along w ith the replication of the information in th e WatchFormula sheet. This is similar to Excel’s “copy and paste” function, but in an intelligent f orm with checking and adjustment of the replicated areas. T he adjustment ensures the reference dollaring can be set up in a way that fills correctly even i f the dollaring selected wou ld not norm ally “c opy and paste” correc tly. All areas that are replicated tog ether end u p referencing each other (ad justed even if ab solute). Any references to un- replicated are as are left u nchang ed (un-adjusted even if relative). Overall the procedure obviates many of Excel’s “copy and paste” vulnerabilities, in particular removing the need to change the reference dollaring for “copy and paste”. T he effect of relative/absolute referencing is overridden according to what else is being re plicated at the same time. 4.6 Data Areas. The Sleuth watches Data Areas as well as Formula Areas and automatically recognises them. It will identify the fo llowing errors in a wa tched Data Area: 1. blank s; the user has the option of acce pting these as zeros, 2. form ulas; these should not exist in Dat a Areas, 3. tex t data in numerical areas and num erical data in text areas, 4. data values which are out of a bounded range, where this range may be set by the user or automatically calculated by the Sleuth. The purpose of t he bounded range feature is t o identify “rogue” data, b ut the a utom atic calculation can be refined t o reflect statistical distribu tion of the numerical data. 5. TELECOMMUNICAT IONS COST MODEL S Telecommunications c ost models are complex. They bring t ogether aspects of networks such as geography, t echn ology, ser vices, capacity, management an d interconnection. These are all i nterr elated and affect costs. There are many design trade-offs and spreadsheet models are comm only used. T he models are usually in a state of flux as the various scenarios a re examined. Ensuring the validity of a model as it i s modified is a vital requirement. A secti on from a typical Telecomm unicat ions Cost Model showing how equipment i s costed is now described. Volumes of two types of customer connections are considered. T he ports per e quipm ent c ard and the volume enab le the number of car ds to be calculated for each year. SUMPRODUCT() i s t hen used to calculate cost for each year. 5.1 Restructuring the Cos t Model Figure 3 shows the cost m odel before and after de vel opment modifications have added an additional card type (rows 4 & 8) and dragged and dropped the Year 0 column out o f main view (column G to J ). T he model is fully wat ched by the Sleuth but the modifications have been made without it. The move of Year 0 has corrupted the formulas in G6:J8, but there is no indication (green triangle) of e rror. Figure 3. Equipment Mode l – Adding a Card & Mov ing Year 0 The for mula bar shows t hat the SUMPRODUCT( ) function has not i ncluded the additional row, due to Excel’s range vulnerability. Moreover, the area, G6:H8 will no longer fill right correctly:- Cell H5 moved to G6 I5 moved to H6 Before =ROUNDUP (H2/$D5,0)-SU M($G5:G5) =ROUNDUP (I2/$D5,0) -SUM($G5:H5) After =ROUNDUP (G2/$D6,0)- SU M($J6:J 6) =ROUNDUP (H2/$D6,0)- SU M($G6:G6) Filled =ROUNDUP (G2/$D6,0)- SU M($J6:J 6) =ROUNDUP (H2/$D6,0)- SU M($J6:K 6) Clicking the Sleuth’s “Check Watched Formulas” a nd “Go T here” buttons r eveals these errors (top screen of fig. 4 ), showing also that the new rows are not include d i n the watched areas. In Fi gure 4 t he red borders and cross-hatching i ndicate errors and the orange borders show changes. These f orm atted indications on the target spreadsheet are temporary and can be removed. The errors listed ar e “< Error i n Formula.>” because G6:H8 is no longer filled r ight, and “” because G6, if filled right, would then r efer to K6 which is outside the watched Year 0. Figure 4. Sleuth Screensho t – Finding and Correcting Errors Moving Year 0 back to column G and deleting th e new rows restores t he model to its original state, but there is now a residual error (I 5:I6). This can be fixed by the Sleuth with t he Fix Selected Area/Cell button. A form i s displayed as in figure 4 and cl icking “Fix Errors” remov es the error in line with the info rmation on the form. An experienced Excel u ser m ight anticipate thes e problem s and m ake the ne cessary adjustments. However, common spr eadsheet manipulations such as these can be ha ndled in a straightforward way by the Sleuth. Instead of using the normal manual method i n Excel, the Sleuth can i nsert the additional rows i n a single operation by cli cking t he Insert Rows Bel ow button (see fi gure 5) . All formula areas are now a utomatically f illed and the SUMPROD UCT() references are automatically adjusted. Additional blank rows are inserted to protect the spreadsheet from the range vulnerability. The original formatting of the s preadshee t is then restored using the Sleuth’s “Restore Orig inal Cell Formats” button. Figure 5. Inserting Row s and Columns with the Sleuth 5.2 Operating the Cost Mod el The Sleuth has an Operati onal Mode, whi ch has fe wer features bu t still allow s “Check Watched Formulas” to be ru n at any time and operational errors to be detected. If an operator, perhaps not aware of t he vulnerability of formulas (even p rotected form ulas) to cell movement, were to move the Year 2 data to the spare column J and update Year 2 (figure 6), then this will be detected by the Sleuth as show n in figure 7. Figure 6. Moving the Year 2 Data Clicking the “Check Watched Formulas” button finds the resulting errors “” and “” in the Check Formula sheet. The errors are fixed by alte rnately clicking “Go There” and “Fix Selected Area/Cell” buttons to produce t he screens as indicated i n figure 8. The f irst message bo x in f igure 8 gives the information “” error including the upper and lower bounds of t he data set. The second message box provides t he information “” including the master formula for the fix. Figure 7. Errors Highlig hted in the CheckForm ula sheet and “Go There” (to the l ocation). Figure 8. The “Go There”, “Fix Selected Area/Cell” R epeating Sequence In Operational mode the final “Fix Sel ected Area/Cell” operation automatically restores the sheet formatting. 5.3. Reconciliation and De tection of Errors The m odel is now enhanced, in Developm ent m ode; separating cumulati ve a nd i n-y ear calculations, adding a cost decline and calculating Shel ves and Racks as well as Cards. Errors have been made i n referencing the wrong cells and filli ng plus incorrect dollaring followed by copy an d paste. The Sleuth has detected these as r econcil iation errors and the results are shown in figure 9, including Excel audit ing arrows to show referencing errors. Figure 9. Cell Referencing Detected by the Sleuth – E xcel Auditing Arrows also Shown 5.4 Tracing References The model has now ( with the help of the Sleuth during the restructuring) been split into two sheets separating t he quantity and cost calculations. The following set of steps show how t he “Trace References ” and “Go There” p rocedur es are used to analyse and trace the references from an answer back t o the source data. T he final step in f igure 10 shows how the Trace References procedure breaks down a m ore complex formula. I t evaluates the functions contained within it sepa rately and shows ho w functions are nested. Figure 10. The “Trace Ref erences” and In- Depth Formula Analysis 6. CONCLUSION The Excel application F ormula D ata S leuth ® has been described highlighting its procedures and f eatures, which diminish or remov e the susceptibility of spreadsheets to Excel’s many v ulnerabilities and consequent errors. These features include: 1. all encom passing error condition d etection that includ es, a. formula damage by overwrite, b. end to end reconciliation o f precedents and dependen ts in formula reference s, c. sophisticated data error de tection. 2. a sim ple user interface for, a. watching of all formula an d data areas, b. full error checking at any t ime, c. intelligent error fixing, d. powerful auditing v ia detailed formula analysis 3. proce dures which aid error-free spreadshee t development using, a. multiple insert/delete in re lated blocks, b. sheet and block replicat ion complete with the Sleuth watch information. In this way, m any of the risks in spreadsheet devel opment, auditing and oper ation are reduced. Examples from the world of Telecoms Cost Modelling have been examined but this type of model is very similar to ot hers in the infrastructure- costing domain. Such models often un dergo continual developm ent and are a lmost never static a s they seek to examine m any dif ferent scena rios. Spreadshee t costing model results are extremely important as they can determ ine a business’s investment in new technology, services and systems. Mistakes or errors are best prevented at source not least because there is l ittle time for auditing and rewor k later. The key to successful use of an application of this ty pe is a simple an d effective us er interface. If ri sk is to be reduced without constraining users in t heir spreadsheet development and wi thout having t o check and audit extensively, there is a need for an application which will assist, aid and then generate trust. F ormula D ata S leu th ® has been developed with these princi ples in mind. 7. REFERENCES Panko, R (2005), “What We Know Abou t Spreadsheet Errors” http://panko.shidler.hawaii.edu/ SSR/Mypapers/whatknow.htm 12:06pm 01/02/2008 EuSpRIG (2007), Sp readsheet mistakes – new s stories ht tp://www.eusprig.org/stories.htm 12 :06pm 01/02/2008 Croll, G (2 005), “The Importance and Criticality o f S preadsheets in the City o f London”, Proceedings of EuSpRIG Symposium 2005. http://arxiv.org/abs/0709.4063 Croll, G and Butler, R (2006), “Spreadsheets in Clinical Medicine – A Public Health Warnin g”, Proceedings of EuSpRIG Symposium 2006. http://arxiv.org/abs/0710.0871 O’Beirne, P (2005), Spreadsh eet Check and Control: 4 7 key p ractices to detect and prevent erro rs, S ys tems Publishing Read, N and Batson, J (1 999), “Spreadsheet Modelling Best P ractice ”, In stitute o f Chartered Accou ntants in England and Wales (ICAEW).
Original Paper
Loading high-quality paper...
Comments & Academic Discussion
Loading comments...
Leave a Comment