Avatar Mobility in Networked Virtual Environments: Measurements, Analysis, and Implications
We collected mobility traces of 84,208 avatars spanning 22 regions over two months in Second Life, a popular networked virtual environment. We analyzed the traces to characterize the dynamics of the avatars mobility and behavior, both temporally and …
Authors: Huiguang Liang, Ian Tay, Ming Feng Neo
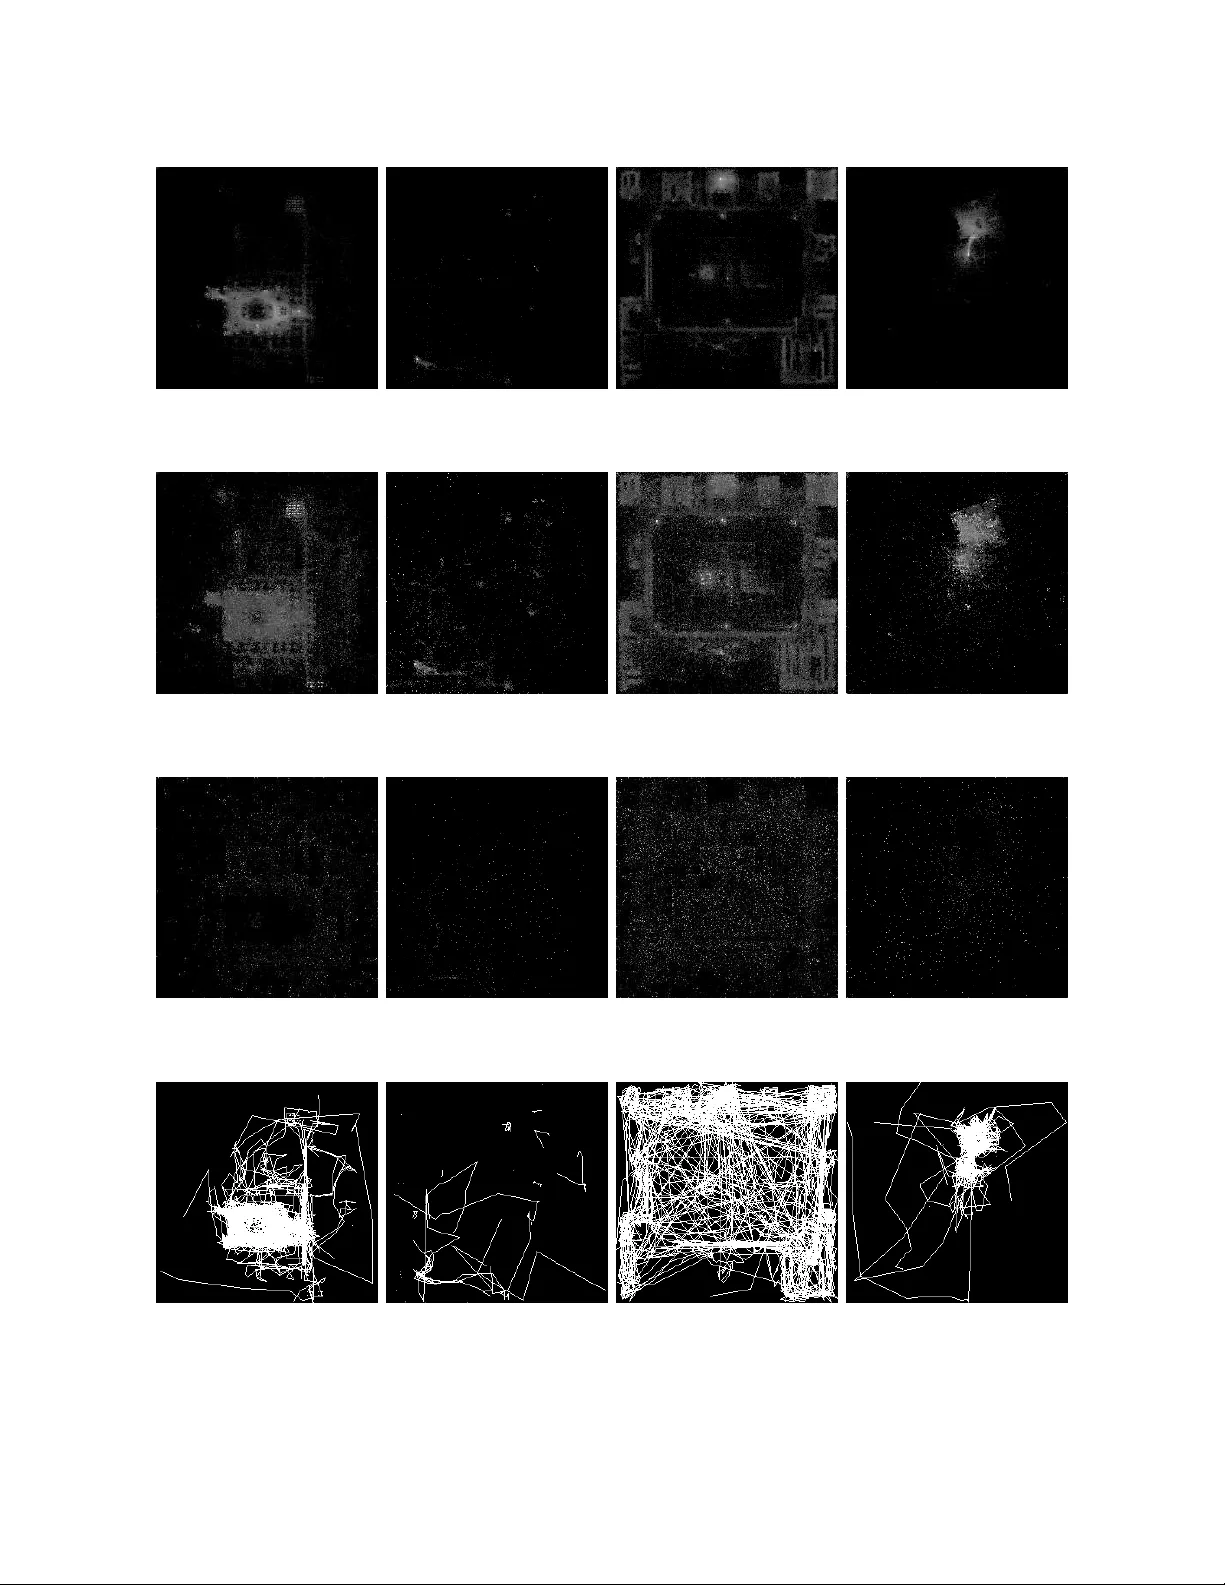
A v atar Mobility in Netw orked Vir tual En vir onments: Measurements, Analysis, and Implicati ons Huiguang Liang, Ian T a y , Ming F eng Neo Dept. of Electrical and Computer Engineering National Univ ersity of Singapore W ei Tsang Ooi Dept. of Computer Science National University o f Singapore Mehul Motani Dept. of Electrical and Computer Engineering National University o f Singapore ABSTRA CT W e collected mo bility traces of 84,208 a vatars spanning 22 re gions ov er two mon ths in Second Life, a popular networke d virtual en- vironment. W e analyzed the traces to characterize the dynamics of the a vatars mobility and beha vior , both temporally and spatially . W e discuss the implications of the our findings to the design of peer-to-pee r ne tworked virtual en vironments, interest management, mobility modeling o f av atars, server lo ad balancing and zone parti- tioning, client-side caching, and prefetching. Categories and Subject Descriptors H.5.1 [ Multimedia Info rmation Systems ]: Artificial, Augments, and V irtual Realities; C.2.4 [ Distributed Systems ]: Distributed Applications General T erms Measurement, Performance Keyw ords Network ed V irtual E n vironment, A v atar Mobility , A va tar Beha vior , Caching, Interest Manageme nt, Load Balancing, Peer-to-Peer 1. INTR ODUCTION The possibility of multiple users communicating and i nteracting with each other in a netw orked virtual environ ment (NVE) o ver the Internet has ex cited man y researchers in the pas t 20 years. Build- ing an NVE that scales to many users, while maintaining interac- tivity req uirements, ho wev er , remains a difficult challenge . Muc h research effort has gon e into reducing communication overhea d, maintaining state consistency , and managing server resources. These research ef forts were previou sly handicapped by a lack of deploy ed, open, large-scale NVE systems, on which the researchers Permission to make digit al or hard copies of all or part of this work for personal or cl assroom use is g ranted without fee pro vided that co pies are not made or distribut ed for profit or commercia l ad vant age an d that copies bear this notice and the full cita tion on the first page. T o cop y otherwise, to republi sh, to post on serv ers or t o redistri bute to li sts, requires prior spe cific permission and/or a fee. Copyri ght 200X A CM X-XXXXX-XX-X/XX/XX ...$5.00. could e v aluate the ef fectiv eness of their propose d solutions. In par- ticular , the effecti vene ss of many of these solution s depends heav- ily on the av atar beha vior , mov ements, and interactions within the NVE. Without such data, previous research mainly based their ev al- uations either on simulations wi th a simple model of av atar behav- ior (such as random way-po int mobility model), or on collected traces from small-scale games and NVEs. In recent years, ho we ver , the increase i n bandwidth to home users and availability of powerful graphics capability in commod - ity PCs hav e lead to de velopment of sev eral NVEs targeted at the Internet mass. Among the notable NVEs are Second Life, There, Activ e W orlds, and HiPiHi. Second Life is t he most popular NVE av ailable, wit h an av erage of 38,000 simultaneous users spending 28 mill ion man-hours in January of 2008 alone 1 . F urthermore, the Second Life client is open source, providing opportunities for re- verse engineering the protocols o n which Second Life ru ns. W e be - liev e that the a va ilability of such large-scale, open NVEs provides exciting opportunities for researchers to ev aluate their solutions us- ing a large amount of real traces under realistic scenarios. This belief driv es our work in this paper . This paper presen ts our ef fort in collecting and analyzing avatar traces from S econd L ife. By using a custom Second Life client, we collected the identity , action, positions, and vie wing directions of 84,208 a v atars ov er two mon ths, spanning 22 regio ns on Second Life, giv ing a total of 62 million records. W e analyze our t races to study the temporal and sp atial dynamics of a v atars. For tempo ral dynamics, we ask the follo wing questions: (i) Ho w does av atar population vary ov er time? (ii) How long does an avatar stay i n a region? (iii) Ho w often does an av atar return to the same region? (iv ) If an av atar does r eturn, how much time has passed before the av atar return s? and (v) Ho w do a vatar arriv al and departure rates va ry over time? The traces also p rovide a rich amount of information on the spa- tial distribution of av atars in a region and their move ment patterns. W e di vide the region into cells, and ask: Gi ven a cell, (i) how man y times does an avatar visit the cell? (ii) How long does an avatar stay in the cell? (iii) How f ast does an av atar move in the cell? W e al so analyze the con tact patterns among t he avatars. In par- ticular , we a re interested in characterizing (i) the number of ava tars within an av atar’ s area-of-interest, (ii) t he duration two avatars stay within each other’ s area-o f-interest, and (iii) ho w dyn amic is the set of av atars within an av atar’ s area-of-interest. Our traces and analysis are u seful in m any ways. First, the traces, 1 http://secondlife.com/whatis/econo my_stats.php which we p lan to share wi th the research community , cap ture a ctual mov ements and activ ities of large number of av atars. It can be used in trace-based simulations of NVEs, allo wi ng ne w and existing de- signs and algorithms to be ev aluated under realistic conditions. Second, the traces can be used to deri ve a nd verify ne w mobility models f or NVEs. Most research assumes a mobility model based on random walk [20, 29], random waypoint or their v ariations [9, 6, 1, 2]. Research, howe ver , has sho wn that the ev aluation results based on these simple models are significantly dif ferent from those based on actual traces. A new avatar mobility model for NVE is therefore needed. Our traces and findings serve as a crucial fir st step to wards that goal. The traces can also help in deri ving and verifying appropriate models for the spatial distri b ution of av atars in the virtual world, where pa st research has assumed that av atars are uniformly distributed [16] and distrib uted in clusters [19]. Finally , our analysis provides i nsights into how av atars behave and move in an NVE such as Second Life. This knowledg e can lead to design o f ne w and more ef fecti ve algorithms for NVEs. For instance, in design ing a peer-to-pe er NVE, it is important to u nder- stand the expected churn rate, identify peers that stay i n the sys- tem for a long time, and understand if (and ho w) t he av atars mo ve and congregate. In designing load balancing and zone partitioning schemes for NVE servers, kno wing the expected spatial distribu- tion of av atars and their tendenc y to moves across zo nes is helpful. It is not our intention in this paper to ev aluate prev ious work using our traces, nor do we intend to propose new mobility and av atar beh avioral mo dels. These are important research directions that we believ e need to be explored, but do not fit into the scope of this paper . Instead, in this paper, we discu ss our findings from our analysis of the measured t races, and ho w the findings will affect v arious aspects of NVE design in general. The rest of this paper i s structured as follo ws. W e present previ- ous w ork related to ours in Section 2. Section 3 briefly introduces Second Life. W e e xplain ho w we collect and ve rify our data in Section 4. Section 5 presents our an alysis of the traces. W e discu ss the implications of our traces in Section 6. F inally , we conclude in Section 7. 2. RELA TED WORK W e no w describe previous efforts in collecting av atar traces from network ed virtual en vironments and games. Rieche et al. [ 25] col- lected a 5-hour trace of 400 players from an online game called FreeW ar . Boulanger et al. [ 4] collected a trace of 28 players from a game they dev eloped called Orbius. The focus of their work is not on t he trace, but rather , the trace is a way to ev aluate their pro- posed algorithms. Riech e et al. use their trace to ev aluate a load balancing scheme, while Boulanger et al. use their trace to ev al- uate different interest management algorithms. Beside traces col- lected fr om games, bo th w orks u se randomly generated mov ements in their e valu ation, and both observ e significant differences in their results ev aluated using the traces and using generated mo vements. Their results highlight the importance of ha ving real mobility tr aces for researchers to ev al uate their wo rk. T an et al. [27] and Bharamb e et al. [3] collected traces from Quake III, a popular , multi-player , fi rst person shooting (F PS) game and de velope d mobility models t o describe the movemen t of the players. Pit tman et al . [24] collected a larg e trace, comparable in scale t o ours, o f players movemen t from W orld of W arcraft (W oW), a massiv ely multi- player online role playing game (MMORPG), and analyzed the dynamics of the populations, players arriv al/departure rate, session length, player distribu tion, and player mo vements. FPS games and MMORPGs have diffe rent characteristics than NVEs. Players i n fast-action, F PS games tend to move around constantly . In MMORPGs, players usually engage in quests t o gain lev el and ne w abilit ies. Pl ayers tend to gather in a location for an ev ent ( e.g. ne w monsters t o fight) and disperse afterwards. P layers also tend to mov e in groups. W e observed a differe nt pattern for NVEs. Most recently , La and Pietro hav e i ndep endently conducted a similar study on mobility in S econd Life [17]. T heir study , ho w - e ver , focuses on metrics rele v ant to mobile communica tions, such as graph theoretic properties of line-of-sight networks formed by the av atars, travel length and time of av atars, and contact oppor- tunities among av at ars. Their goal is to use the mobility traces of av atars to model human mobility for applications related to wir e- less and delay-tolerant networks. On the other hand, we focus on metrics that are of interest to systems design of NVEs. 3. SECOND LIFE Before we d escribe ho w we collected our traces, we briefly intro- duce Second Li fe in this section. Second Life is an NVE launched by Linden L ab in 2003 . It is a so-called metaver se , where users participate in creating the virt ual world by constructing buildings and authoring objects. Furthermore, users co ntrol av atars that can interact with each other , socialize, and trade user-created objects. Unlike popular massiv ely multiplayer online games (MMOG) such as W orld of W arcraft, the virtual wo rld i n Second Life is highly dynamic – users can create objec ts, place them i nto the vir- tual w orld, and write scripts to program the behavio r of the objects. In comparison, the wo rld or game maps i n MMOG are mainly static and are built by game publishers. As such, it is possible to dis- tribute t he data describing the game wo rld on D VDs. In Second Life, ho wev er , only a viewer program i s distributed to the users. Data p ertaining to t he virtual wo rld, such as terrain, objects, behav - ioral scripts, and textures, are down loaded on demand as the user explore s and interacts with t he virtual w orld. The virt ual world in Second Life is made up of r e gions . Each region is a 256m × 256m piece of land, man aged by a Second Life server process that maintains the states of all av atars and objects within the re gion. The virtual world in Second Life is not seamless – the user cannot walk seamlessly between re gions, but r ather has to teleport f rom reg ion to region. As the user teleports, the state of the a v atar is transferred to the de stination’ s si mulator (usually takes order of seconds). E ach region has a telepo rtation point called the landing point , where all arriving a v atars will appear . An acti vity unique to Second Life is camping , where a va tars can earn free virtual money by eng aging in certain activities (e.g., get paid by the hour to sit on a chair) Region o wners typically use camping to boost the popularity of the region s. W ithin a region , a user can walk, run, or fly . The user can also teleport from one place to another within a r e gion, if intra-region teleportation points exist. In t his paper , we are interested in collect- ing the mobility t races of the av atars as they mov e around within a region. W e describe ho w we collect the traces next. 4. D A T A CO LLECT ION T o co llect the traces of av atars, we deve loped a client for Second Life based on an open source library called libsecondlife 2 . Our client visits selected region s in Second Life using a bot, and by parsing up date pack ets from the servers, we ca n obtain informa tion about other av atars in the regions. W e log information about all detected av atars at ten second interv als. Second Life uses an architecture that stores the states of all av atars in a centralized server . The server pu shes information about other 2 www .libsecondlife.org av atars and objects in the region to the clients, depending on the client’ s av atar position. How t he serv er decides which informa- tion to push is unfortunately proprietary and unkn own to us. It w as therefore not clear to us whether our bot is able to track the po- sitions of e very a vatar on the region. For instance, if the server uses interest man agement techniques, then only po sitions of other av atars within the area -of-interest (AoI) of our bo t will be updated, while those outside are culled. W e inserted sev eral av atars into Second Life to determine how interest management is done. W e ob serve t hat culling i ndee d does occur for av atars outside of the AoI, but, once the bot starts detect- ing an a vatar , updates about that avatar will no longer be culled, e ven i f the av atar mov es outside the bot’ s AoI. T o track the move- ment of as many av atars as possible, we therefore place our bot at the landing point. As such, all incoming av atars wi ll be imme- diately detected by the bot and subseq uently our bot will receive update of these av atars regardless of where t he y are in the region. The existing av atars that are already in the region w hen we started our bot, howe ver , may not be tr ack ed. Fortunately , our measure- ments sho w that 95% of t he av atars stay less than an hour in the region (see Section 5.1 ). Thus, after the first coup le of hours, our bot should be able to track nearly all of the av atars in the region. 4.1 Difficulties Encounte red W e no w briefly explain several issues we ran into during our data collection process, which lead to imperfect traces. One source of imperfection in o ur traces is related to av atars that are sitti ng on objects. Second Life reports the locations of these av atars relat i ve to those objects. T o recov er the position of the av atars, we therefore need to kn ow the position of the objects t he y are sitting on. W e ob serve that pack ets containing information on objects are sometimes culled if they fall outside the bot’ s AoI. In this case, we are unable to comp ute the position of t he avatars sit- ting on these objects. Such records are removed from the trace, but only whe n we compute metrics that requ ire the positions of the av atar . About 8% of our records have unkn own av atar positions. Occasionally , our bots are kicke d out by the re gion o wner , as the o wner may not take kindly to bots. Each region allows a limited number of a vatars i nside at any one t ime, due to server’ s resource constraints. An inactiv e bot occupies a v aluable slot that could hav e been fi lled by an actively contributing av atar . On a few occasions, region own ers went as far as t o ban our bots from returning, creat- ing temporal breaks within the data set. T emporal brea ks also happen when our client crashe s due to in- suf ficient mem ory . The libsecon dlife library maintains a staggering amount of states abo ut each object and av atar in a reg ion (at least 1 GB in densely populated regions). W e hav e a script to automat- ically restart the client in such situations, b ut the bot may not be able to log back to the same region, because the region becomes full during the crash, creating temporal breaks in our traces. 4.2 V erification Positional prediction techniq ues, such as dead recko ning, are commonly used in NVE to reduce upda te frequenc y b etween server and clients at the cost of reduced consistenc y in av atar position. W e are concerned with h ow consistent the reported positions of the av atars are and if any predictions are don e at the cli ent. An experiment w as conducted to verify the consistency of the re- ported position. W e placed se ven bots on a region called Freebies, with four static bots at each corner of the region, one static bot at the center of the re gion, and two bo ts that walk around the re gion fol- lo wing a rando m walk model. W e log the positions of o ther av atars in the region as seen by each bot. For each av atar at each time in- stance, se ven r ecords of the positions are obtained. W e compute the standa rd dev iations of x and y positions of the av atars seen by these bots. W e found t hat only 1.14% of t he reported x positions and 1.39% of the reported y positions hav e a standard de viations of more than 10 meters, while 9.00% and 10.15 % of t he records hav e standard deviations of more than 1 meters for x and y posi- tions respectiv ely . There are instances w here the two bots detected the same av atar with reported positions more than 100 meters apart – this happens when the av atar t eleports wi th the re gion. Delay in recei ving updates from the server causes these discrepancies. Another concern we have is whether our bot consistently ob- serve the same set of av atars. T o verify this, we place t wo bots close together at the teleportation poin t on Freebies, and each bots recorded the number of av atars it currently knows of every 10 sec- onds for 30 minutes. W e found t hat the numbers r eported by the two bots are ve ry close. Each bot detected an average of 71.22 av atars, and the mean difference between the reported number of av atars at each scan is 1.16 (1.63%). This dif ference is cau sed by one t o t wo av atars (who are already in the re gion when we started our exp eriments) moving into the AoI of one bot but not the other . The verification experiments abo ve indicate that our collected data contain some errors, cause d b y state synchronization delay and interest man agement techniques used by the server . W ith no access to the serv er states, we can on ly collect the traces at a client, where these errors are unavoida ble. Fortunately , we found that the errors are reasona bly small and we belie ve they will n ot affec t the ge neral conclusions we obtain from the analysis of the traces. 4.3 Limitations Our traces and analysis have two limit ations. Fi rst, our bot can- not tracks mo vement of a vatars between region s. Second Life does not pro vide information about the destination of an av atar when it leav es a region. I n fact, we can not differen tiate between an av atar logging out and teleporting to another region. Second, we ignore the z-coordinates of ava tars in our analysis. Each av atar position gives the coordinate of the av atar in a 3D space. W e observe, howe ver , that most of the time the a vatars stay on the ground. W e therefore focus only on t he x- and y-coordinates. As a result, an ava tar that ho vers in the air is considered to be at the same position as anothe r av atar stan ding on the ground if they have the same x- and y-coordinates. 4.4 Regions Name Number of A v atars Date Isis 2,735 28 Mar 2008, Fri Ross 560 11 Mar 2008, T ue Freebies 3,153 11 Mar 2008, T ue The Pharm 1,537 5 Mar 2008, W ed Isis (Long) 8,795 28–31 Mar 2008, Thu to Sun T able 1: Summary of T races Analyzed While we collected data from 22 re gions ov er se veral weeks, we focus our analysis on a one-day trace from fou r reg ions i n this pa- per , namely Isis , Ross , F reeb ies , and The Pharm . A summary of these traces are sho wn in T able 1. W e focus on three popular regions, Isis, F reebies, and The Pharm. Isis has a mature adult theme. Residents can participate in paraphil- iac activities, bu y adult-no velty items, and camp. F reebies giv es aw ay free objects, clothes, accessories, and other inv entory items to any resident. It also features a very small camping area. The Pharm is a region focus only on camping. These three regions are consistently among the most popular regions in Second Life. Ross, a re gion wi th medium popularity is chosen to contrast the results from the popular regions. Ross is provided by Linden Lab to distribute information and serv es as meeting place for av atars. Besides popularity and variation in themes, we choice of these four regions is also due to the completeness of their traces. As mentioned in Secti on 4.3, we encountered temporal breaks in our traces. T he set of traces from these regions are the most complete, with only six, small breaks in between. The av erage break is 8 minutes, with the longest break being 16 minutes and 30 second s. Out of four d ays, only 0.8% of the traces are lost du e to the breaks. Besides the above traces, we also inclu ded our analy sis for a 4- day trace for Isis to study if there is an y chan ges in our observ ation ov er multiple days, covering both weekd ays and w eek ends. W e did not choose any unpopular regions to study , as those usu- ally yield few a va tars and give no in teresting results. 5. CHARA CTERIZING A V A T ARS 5.1 Session Beha vior W e now report on the session behavior of av atars based on the traces in T able 1. Population ov er Time: F igure 1(a) sho ws how region popu- lation changes over t ime. The three popular regions, Isis, F ree- bies, and The Pharm exh ibits similar patterns in population over time where there is a slight drop in population from 12 noon to 6 pm. The diurnal pattern i s not as obvious as observed in other NVEs [24 ]. The population from Ross exhibits a different pat- tern, where population increases steadily but suddenly drops. These drops could be due to server reset, causing all av atars (include our bot) to be logged out. W e observ e similar patterns when study- ing our traces from other days. Our 4-day Isis trace, for instance, exhibits similar drop, surprisingly , ev en on weekends. W e have two possible ex planations for the lack of obvious diur- nal pattern. First, Second Life limits the number of av atars visiting the regions. Fo r popu lar regions, there is a constant demand for users to enter the region – so, when a user leaves and the region has a slot open, another users is likely to enter the region. Sec- ond, Second Life users sp an many parts of the world. Acco rding to the economy statistics published by Linden Lab, about 40% of t he users come from No rth America. Another 40% come from Europe. The rest are from Asi a, S outh America, and Oceania. Users log onto Second L ife at all times of the day . T he slight drop during 12 noon to 6 pm local time corresponds to daytime in North America. The diurnal pattern caused by users i n Europe is not as obvious as the continent spans many time zones. Arriv als and Departures: Figures 1 (b) and 1(c) sho w the num- ber of arriv als and departures over time. These figures sho w that the population on t he regions is highly dynamic, as expected from the maximum number o f av atars in a region (Figure 1 (a)) and num- ber of unique av atars observed (T able 1). W e can see a high chu rn rate for Freebies, as av atars tend to drop into the region, picks up free i tems, and leav es. The churn rate is especially high from 12 midnight to 6am (up to 60 churns per hour). The churn rates for The Pharm and Ross are lo wer , due to t he camping activities and lo w popularity of the region, respectiv ely . Returning to the Same Island : W e are interested in how man y times an av atar revisits a region. Surprisingly , even within a day , we observ ed multiple visits by the same a va tar . The maximum nu mber of revisits observed is 55 (for Freebies). W e speculate that these av atars might be hoping from region to re gion. About 25 - 35% of the a v atars revisited the same region within a day . The CDF for this metric is sho wn in Figure 1(d) . Figure 1(e) sho ws t he CDF for the time that passed between an av atar lea ving the region and returning to the region. W e call this metric i nter -re turn time . The median inter-return time for the three regions on the day observed ranges from 45 minu tes to an hour . 90% of the inter-return time observ ed is less than 10 hours. Stay Time: Figure 1(f) shows the cumulati ve distribution of ho w long an av atar stays in a region. W e call this the st ay time of an av atar . W e note that this does not correspo nd to the time an avatar stays i n Second Life, since the av atar co uld hav e j ust teleported to another region rather than leaving Second Life. W e compute the stay time by logging the time between the arriv al and departure of an av atar, ex cluding all av atars that are already in the r e gion at the beg inning of our trace. The distribution of stay time is highly ske wed, close t o a po wer l a w distribution. A n obv ious ob servation is that the stay time at Ross is lo wer (median of 92 seconds) than that of Isis and Freebies (median of 448 seconds and 373 seconds). The distribution of stay time at T he Pharm is ske wed t o wards higher v alues (despite a median of on ly 427 seconds) than Isis and Free- bies, since av atars have incentiv es to stay on the island. The peri- odic reset on Ross could exp lain the shorter stay time. 5.2 Mobility W e now characterize how av atars move: where they visit, how long do they pause, ho w fast do the y mo ve, and whether they stay in group s. W e quantize the regions into 256 × 256 equal size cells , and compute a set of metri cs for each cell. F igures 2-5 show the choropleth map s of t he regions for various metrics. F igure 6 plots the CDF of the same metri cs (x-axis in log-scale). Fi gures 6(b) and 6(c) sho ws the distribution ov er all cells visited. Number of visits: An indication of cell popularity is how many times the av atars visit a cell. W e coun t the number of times an av atar enters a cell c . If the same av atar enters and leaves the cell multiple times, it is counted as multiple visits. If an av atar logs out and logs in again, S econd Life will place the a v atar at the pre vious position when it logs out. W e d o not cou nt this entry a s a n ew v isit. Figures 2(a) to 2(d) sho w the choropleth map of the number of visits t o a cell in log-scale. The number of visits to cells is highly ske wed. There are many cell s that are not visited by any avatars in our traces, and a small number of cells are visited many times. Figure 6 (a) sh ows t he CD F for numb er of v isits for all four regions. Freebies has the most visited cells (52% are visited at least once), as its activities spread to all corners of the region (Figure 2(c)). The regions have 2 (R oss) to 17 (Isis) cells that are visited more than 100 times, with the most visited ce ll having been visited 248 7 times (in Isis). This cell corresponds t o the landing point on Isis, which can be seen as the bright white spot in Figure 2(a) . Other regions sho w similar spots at their landing points. A v erage pause time: Another indication of the popu larity of a cell is the du ration a n av atar stays i n a ce ll (until it mo ves to anothe r cell, telepo rts to another region , or logs out). T he total pause time of a cell c is the sum of t he pause time of all a vatars that hav e ev er been to c . Note that since we log t he m ovem ent of av atars e very 10 seconds, the pause time has a minimum resolution of 10 secon ds. The av erage pause time of a cell is thus total pau se time div ided by number of visits. This metric indicates the stickiness of a cell. Figures 3(a) to 3(d) show t he choropleth map of the av erage pause time of a cell in log-scale. Comparing these maps t o F ig- ures 2(a) to 2(d) sho ws t here exist cells with high av erage pause time that are not visited often (for instance, the group of c ells at the top right quadrant of the map in Figure 3(a)). T he distribution of av erage pause time is again highly ske wed (F igure 6(b)). On Isis and Freebies, av atars pause for less than 100 sec onds in 9 5% of the visited cells but 11 and 5 av atars pause more than 3 hours on Isis and Freebies respecti vely . In the camping region, The Pharm, 40 0 20 40 60 80 100 120 140 160 0 5 10 15 20 25 Number of Avatars Time (Hours Since Midnight) Number of Avatars versus Time Isis Ross Freebies ThePharm (a) 0 10 20 30 40 50 60 0 5 10 15 20 25 Number of Arrivals Time (Hours Since Midnight) Number of Arrivals versus Time Isis Ross Freebies ThePharm (b) 0 10 20 30 40 50 60 70 0 5 10 15 20 25 Number of Depatures Time (Hours Since Midnight) Number of Depatures versus Time Isis Ross Freebies ThePharm (c) 0.65 0.7 0.75 0.8 0.85 0.9 0.95 1 10 0 10 1 10 2 Probability (CDF) Number of Returns to the Island Number of Returns Isis Ross Freebies ThePharm (d) 0 0.1 0.2 0.3 0.4 0.5 0.6 0.7 0.8 0.9 1 10 1 10 2 10 3 10 4 10 5 Probability (CDF) Inter-return Time (seconds) Inter-return Time Isis Ross Freebies ThePharm (e) 0 0.1 0.2 0.3 0.4 0.5 0.6 0.7 0.8 0.9 1 10 1 10 2 10 3 10 4 10 5 Probability (CDF) Stay Time on Island in Seconds (Log-Scale) Stay Time on Island Isis Ross Freebies ThePharm (f) Figure 1: Session Beha vior av atars paused mo re than 3 hours. The longest a verage pause t ime observ ed is just over 14 h ours in The P harm. A v erage speed i n a cell: For each pair of consecuti ve r ecorded av atar positions, we note the time between the records t and the distance trav eled d . The a verage speed of th at av atar is then simply d/t . W e consider d/t as the spe ed of a mov ement i n cell c , where c is the n ew cell the a vatar is in. The av erage speed in a cell is then the av erage speed ov er all movemen ts. The map for average speed is shown in Figures 4(a) t o 4(d), with the correspondin g CDF shown in F igure 6(c). Comparing these maps to Figures 2(a) to 2(d) shows bright spots ( high av er- age speed) outside of the frequently visited cell s. This observ ation confirms the intuiti on that av atars mov e quick ly (either run or fly in Second Life) i n non-interesting region s but move normally (walk) within interesting reg ions. This is confirmed in Figure 5(a) to 5(d), which sho w the trail o f the a v atars in a o ne-hour sub-trace (6am ) of the four one-day traces in T able 1. A long and straight li ne means the avatar is moving at a fast speed (inclu ding intra-region teleport). Figure 6(c) i ndicates something interesting: the average speed of about 30% of the visited cells ha ve a zero av erage speed in The Pharm and Ross, implying that some av atars nev er mov e – likely these users log in and l ea ve the session running, e xploiting camping facilities to earn virtual money (Note that Second Life leav es the av atar at their pre vious location when the user logs in). 5.3 Contact Patter ns T o characterize the spatial relationship among ava tars, we l ook at meetings among the avatars. T wo av atars meet if their distance in a region is within a certain threshold. W e use 64m as our threshold since this is the defau lt AoI distan ce in Second Lif e. Meeting Durations: Figure 6(d ) sho ws the distri b ution of meet- ing duration. Meeting durations are long – ov er 50% of the dura- tions are over 82 seconds (for Freebies) and 303 secon ds (for The Pharm). On The Pharm, 9% of the meetings are ov er an hour . A v erage Meeting S ize: A closely r elated measure we compute is average meeting size over time. For every 10 seconds, we com- puted the meeting size – the number o f av atars within their AoI. W e then co mpute, for each a vatar , the a verage meeting size over time. W e found that the meeting size i s generally large in the regions we studied. On The P harm, the ave rage meeting size for avatars i s abov e 40 for 99% of the av atars. Even on Ross, a medium popular- ity region, the median meeting size is 11.4. Meeting S tability: T o see ho w the av atars in a meeting chang e ov er time, for each av at ar a , we take the rati o of a verage meeting size ov er the number of unique av atars e ver met by a in the re gion. W e call this ratio meeting stability . If an a v atar’ s stability is 1 , then the avatar alway s meets with the same set of av atars while she is in the region. The distr ib ution of this ratio is sho wn in Figure 6(f). A v atars i n The Pharm and Ross have a high meeting stabilit y , with 50% or more ha ving a stabilit y of 0.67 and 0.79 respectiv ely . 19% of av atars have a stability of 1.0 in Ross. A vatars in F reebies sho w much mo re dyna mic behav ior , with a median stab ility of only 0 .33. 5.4 T emporal V ariation W e are interested in seeing if the general obs ervations we made abov e change o ver time. W e analyze a four-day trace from Isis, (a) Isis (b) R oss (c) Freebies (d) The Pharm Figure 2: Log -scale ch or opleth map for number of visits. Lighter colors mea ns h igher v alue. (a) Isis (b) R oss (c) Freebies (d) The Pharm Figure 3: Log-sc ale ch or opleth map fo r aver age p ause time Lighter co lors means hi gher v alue. (a) Isis (b) R oss (c) Freebies (d) The Pharm Figure 4: Log-sc ale ch or opleth map for a ver age sp eed. Lighter colors mea ns higher v alue. (a) Isis (b) R oss (c) Freebies (d) The Pharm Figure 5: Mo vement T rails from 6am to 7am 0.5 0.55 0.6 0.65 0.7 0.75 0.8 0.85 0.9 0.95 1 10 0 10 1 10 2 10 3 10 4 Probability (CDF) Total Visit to Cell (Log Scale) Total Visit to Cell Isis Ross Freebies ThePharm (a) Number of V isits 0 0.1 0.2 0.3 0.4 0.5 0.6 0.7 0.8 0.9 1 10 1 10 2 10 3 10 4 10 5 Probability (CDF) Average Pause Time in Cell (Log Scale) Average Pause Time in Cell Isis Ross Freebies ThePharm (b) A verage Pause T i me 0 0.1 0.2 0.3 0.4 0.5 0.6 0.7 0.8 0.9 1 10 -8 10 -7 10 -6 10 -5 10 -4 10 -3 10 -2 10 -1 10 0 10 1 10 2 Probability (CDF) Average Speed (Log Scale) Average Speed Isis Ross Freebies ThePharm (c) A verag e S peed 0 0.1 0.2 0.3 0.4 0.5 0.6 0.7 0.8 0.9 1 10 1 10 2 10 3 10 4 10 5 Probability (CDF) Duration of Meeting in Seconds (Log Scale) Duration of Meeting Isis Ross Freebies ThePharm (d) Meeting Duration 0 0.1 0.2 0.3 0.4 0.5 0.6 0.7 0.8 0.9 1 0 10 20 30 40 50 60 70 80 90 100 Probability (CDF) Average Meeting Size Average Meeting Size Isis Ross Freebies ThePharm (e) Meeting Size 0 0.1 0.2 0.3 0.4 0.5 0.6 0.7 0.8 0.9 1 0 0.1 0.2 0.3 0.4 0.5 0.6 0.7 0.8 0.9 1 Probability (CDF) Meeting Stability Meeting Stability Isis Ross Freebies ThePharm (f) Meeting Stability Figure 6: Distributions of Mobility-related Metrics hour-b y-hour . W e pick the number of visits to a cell as the metric to study , as it is a good indication of wheth er a cell is popular . For each cell , we sample the number of visits to that cell in each hour , and computed the standard de viation of the samples. W e fou nd very little v ariation in the n umber of v isits to the c ells, hour-b y-hour , ov er the course of four days. 99% of the cells ha ve a standard deviation less than 1.05. T he largest standard de viation, 20, is observed at the landing point. 6. IMPLICA TIONS In this section, we discuss our observ ati ons f rom the tr aces and ho w they relate to existing research in NVEs. 6.1 P eer -to-peer NVEs Centralized server architectures, such as those employed by Sec- ond Life, do not scale well to a large nu mber of players. This chal- lenge of scalability has moti vated research into alternativ e architec- tures, one of which is the peer-to-peer architecture, where clients communicate directly with other clients through an ov erlay , with- out going through the server [11 , 12 ]. A client may also share so me responsibility of the server (such as maintaining states) [3, 16]. Our traces sho w evidence of high churn rate, av eraging about one e very two minutes on the popular region s, and could hav e drastic effe ct on the efficac y of peer-to-peer NVEs. Such high churn rates imply that the system has to continuously configure the peer-to- peer o verlay and sufficient redundancy needs to be b uilt-in to pre- vent loss of information [3]. O ur analysis sho ws that the stay time is highly ske wed. This observ ation supports peer-to-peer NVEs that employ super -nodes to store states and manage other pee rs [16, 6]. The av atars who stayed for a long time in a region may be good candidates to be super nodes. Our t races also suggest a novel and interesting way to identify the potential super nodes. W e observe that t here are cell s w ithin the regions that are “stick y” – av atars tend to pause within these cell for much longer time than other cells. Thus, avatars that pause at these sticky cells are more likely to pau se for a long time. Many P2P NVE schemes build an overlay by connecting peers within an AoI as neighbors [15, 12, 8]. Our traces support this design in regions with low popularity and lo w mobility (such as Ross and The Pharm), where the meeting stabilit y is relativ ely high. For regions such as Isis and Freebies, where the AoI neighbors change frequen tly , reduc ing overhead in establishing and tearing do wn connections among neighbors remains a challenge. 6.2 Zone Partitioning and L oad Bala ncing Besides P2P architectures, another architecture that has been pro- posed t o improv e t he scalability of NVEs is to employ a cluster of servers. The game world is divided into zones, each managed by a server . This architecture is similar to what Second Life employs today . The r esearch challenge is to make the game world seamless by making zoning transparent to the users. A consequence of seamless zone partitioning is that we can dy - namically repartition the zones to balance the load on the servers [30, 7, 19, 9]. T wo important factors that affect an y load balancing schemes are population in a zone, and mov ement across zones. Our t races sho w that, unsurprisingly , the spatial distribution of av atars is f ar from uniform, especially for Isis and The Pharm. T his observ ation supp orts the need for more sophisticated partitioning scheme, beyond grid-base d partit ioning. W e also observed from our t races that av atars tend to move quickly in lo wly populated , non-interesting areas within a re gion. This cre- ates another issue in which such fast-moving a vatars hav e to be handed off from one server to another as t he y move across the zones, increasing server ov erheads. The existence of such behav- ior also points to t he importance of l oad balancing schemes that dampen sensiti vity to minor increase in load – to avoid frequent triggers of the load balancing mecha nism due to such fast-mo ving av atars. Our traces sho w that the popularity of cells does not sho w much variation o ver time, suggesting that dynamic l oad re-balan cing of zone would occur only rarely . 6.3 Inter est Management Interest management techniques suppress updates from one avatar to another av atar if t he two av atars are deemed to be irrelev ant to each other . For peer-to-peer architectures, there is no centralized authority that stores the states of all avatars. Researchers hav e pre- viously p roposed nov el, distributed schemes to determine the inter- est between two av atars [20, 26]. The ideas behind t hese schemes are that, tw o avatars exchan ge their locations and each compu tes a safe zone 3 , based on occlusions and visibility information, where they can remain in without needing to update each other . If one av atar mov es out of this safe zone, they exchan ge their location again and recompute the safe zones. Our traces mean both good news and bad ne ws for these schemes. On one hand, we found t hat in interesting cells, where there are typically many o cclusions, av atars mov e slowly . Thus a va tars need to update each other rarely . On the other hand, in non-interesting cells, there are few occlusio ns and av atars mo ve qu ickly , and thus need to update their locations to each other frequently . Since determining visibility between avatars can be expensi ve, another popular techniq ue for determining relev ancy between two av atars is to use the AoI – two peers update each other as long as their av atars are in the other’ s AoI. Our traces indicates large av erage meeting size (F igure 6(e)), suggesting high ov erhead in excha nging updates f or this technique. 6.4 Mobility Modeling Our traces are useful in designing and verifying ne w mobility models for NVEs. W e obse rved that on popular regions such as Isis and Freebies, av atars tend on congrega te in interesting places and mov e at a slower speed. T he y also mov e faster in non-interesting places, perhaps exploring and looking for interesting things, or moving from one i nteresting place to another (See Figures 5(a)- 5(d)). This ob servation suggests that simple mobility models such as random walk and ran dom w ay-point [13] are insu fficient in mod- eling mobility of all regions in NVEs such as Second Life. The mo vement within high density areas in a region seems to suggest a pathway model – where av atars mov e along constrained paths (such as corridors or bridges) and visi t various rooms [28]. This model, howe ve r, does not account for the high speed move- ments when av atars move in non-interesting cells. Thus, our mea- surements seem to suggest that a hybrid mobility model that in- corporates both random way-point mobilit y model (for outdoor) and pathw ay mobility model (for ind oor) would be mo re suitable. Our analysis also suggests the mobility model should incorporate ske wed distributions in mo vement speed and pause time. 6.5 Pr efetching 3 the term zone here has no relationship to that in Section 6.2 Prefetching is commonly used to redu ce the object access latency in NVEs [5, 10, 18, 23 ]. T he key t o successful prefetching is pre- dicting accurately which objects are needed, so that bandwidth is not wasted in retriev ing objects that will not be ev entually used. Second Li fe prefetches the data within a circular region of an av atar . W e found from our Isis and Freebies traces, howe ver , that av atars only spent 18% of their time rotating around a point. Our extended analysis of t he multiple day traces re ve als that t he popularity of the cells in a region do not change ov er days, or even ov er hours. This observa tion suggest t hat we can use short-term, historical information about the popu larity of a cell as an input to the prefetching algorithm to help with predictions. 6.6 User -based Caching Our traces show that eve n within a day , there are multiple revis- its t o the same region by the same av atar . This pattern supports user-base d caching in Second Life. It also sugg ests the possible benefits of re gion-awar e caching , which co nsiders access patterns to a region, in addition to access patterns to objects, in t he cache replacement algorithm – so that i f a user is hopping from r e gion to region, objects from a region they repeated ly visit are not e victed from the cache when they visit other re gion. 7. CONCLUSION This paper presents our effort in collecting and analyzing large traces of avatar mobility in S econd Life. W e focus on four regions with different characteristics in this paper . I t would be interesting to capture such traces on re gions which hold transient e vents (such a s parties), where popularity cou ld v ary bo th spatially and temporally . In this paper , we computed baseline metrics r elated to system design i n NVEs. One could mine the traces for answers to other interesting qu estions (such as whethe r an av atar tends to mo ve to- wards cells wi th other av atars). W e plan t o continue analyzing ou r traces to rev eal interesting patterns in av atar mobility . W e also discussed ho w our findings could impact many other aspects of NVE design and suggested se veral potentially bene fi- cial ideas (e.g., i dentifying super-n odes, region-a ware caching, and popularity-based p refetching). W e p lan to i n vestigate thes e ideas in depth and e valua te their effecti veness using our traces. Acknowledgmen t W e thank V ikram Sriniv asan of Bell Labs Research India for usefu l discussions throughou t this pro ject. 8. REFERE NCES [1] H. Backhaus and S. Krause. V oronoi-based adaptiv e scalable transfer rev isited: gain and loss of a vorono i-based peer-to-pee r approach for mmog. In Proc. o f NetGames ’07 , pages 49–54, Melbourne, Australia, 2007. [2] A. Bharambe, M. Agrawal, and S. Seshan. Mercury: supporting scalable multi-attribute range q ueries. In Proc. of SIGCOMM ’04 , pages 353–366 , Portland, OR, 20 04. [3] A. Bharambe, J. Pang, and S. Seshan. Colyseus: a distributed architecture for online multiplayer games. In Pr oc. of NSDI ’06 , pages 12–12, San Jose, CA, 2006. [4] J-S. Boulanger , J. Kienzle, and C. V erbrug ge. C omparing interest management algorithms for massi vely multiplayer games. In Pr oc. of NetGames ’06 , page 6, Singapore, 200 6. [5] A. Chan, R. W . H. Lau, and B. Ng. A hybrid motion prediction method for caching and prefetching in distributed virtual en vironments. In Pr oc. of VRST ’01 , pages 135–142 , Baniff, Alberta, Can ada, 2001. [6] A. Chen and R. R. Muntz. Peer clustering: a hybrid approach to distributed virtual en vironments. In P r oc. of NetGames ’06 , page 11, Singapore, 2006. [7] J. Chen, B. W u, M. Delap, B. Knutsson, H. Lu, and C. Amza. Locality aware d ynamic load management for massi vely multiplayer games. In Pr oc. of PP oPP ’05 , pages 289–30 0, Chicago, IL, 200 5. [8] J.F . Chen, W .C. Lin, H.S. Bai, and S.Y . Dai. A message interchange protocol based on routing information protocol in a virtual world. In Pr oc. of 19th Int. Conf . on Advanced Information Networking and Applications (AINA 2 005) , pages 377–384 , T aipei, T aiwan , March 2005. [9] R. Chertov and S. Fahm y . Optimist ic load balancin g i n a distributed virtual en vironment. In P r oc. of NOSSD A V ’06 , pages 74–79, May 2006. [10] J. H. P . Chim, M. Green, R. W . H. Lau, H. V . Leong, and A. Si. On caching and prefetching of virtual objects in distributed virtual en vironments. In Proc. o f ACM MULTIMEDIA ’98 , page s 171–180, Bri stol, UK, 1998. [11] L. Gautier and C. Diot. Design and ev aluation of MiMaze, a multi-player game on the Internet. In Internationa l Confer ence on Multimedia Computing and Systems , pages 233–23 6, 199 8. [12] S-Y . Hu, J-F . Chen, and T -H. Chen. VON: a scalable peer-to-pee r network for virtual en vironments. IEEE Network , 20(4):22–31, July-Aug. 2006. [13] D. B. Johnson and D. A. Maltz. Dynamic source routing in ad hoc wireless network s. I n Imielinski and K orth, editors, Mobile Computing , volume 35 3. 1996. [14] T . Johnson and D. Shasha. 2Q: A low o verhead high performance buf f er managem ent replacem ent algorithm. I n Pr oc. of VLDB ’94 , pages 439–4 50, San Francisco, CA, 1994. [15] J. Keller and G. Simon. Solipsis: A massi vely multi-participant virtual world. In Pr oc. of Internationa l Confer ence on P arallel and Distributed T echniques and Applications , pages 262–26 8, Las V egas, NV , 2003. [16] B. Knutsson, H. Lu, W . Xu, and B. Hopkins. Peer-to-peer support for massiv ely multiplayer games. In Pr oc. of INFOCOM ’04 , March 2004. [17] C-A. La and M. Pietro. Characterizing user mobility in Second Life. T echnical Report RR-08-212, Institut Eurecom. [18] R. W . H. Lau, J. H. P . Ch im, M. Green, H. V . Leong, and A. Si. Object caching and prefetching in distributed virtual walkthroug h. R eal-T ime Syst. , 21(1/2):143–164, 2001. [19] J. C. S. Lui and M. F . Chan. An efficient partitioning algorithm for distributed virtual en vironment systems. IEE E T ran s. P arallel Distrib . Syst. , 13(3):193–2 11, 20 02. [20] Y . Makbily , C. Gotsman , and R. Bar-Y ehuda. Ge ometric algorithms for message filtering in decentralized virtual en vironments. In I3D ’99: Pro c. of the 1999 symposium on Interactive 3D gr aphics , pages 39–46, Atlanta, GA, 1999. [21] N. Megiddo and D. S. Modha. ARC: A self-tuning, lo w ov erhead replacement cache. In Proc. of F A ST ’03 , pag es 115–13 0, San Francisco, CA, 2003 . [22] E. J. O’Neil, P . E. O’Neil, and G. W eikum. The LR U-K page replacement algorithm for database disk buf fering. In Pr oc. of SIGMOD ’93 , pages 297–306 , W ashington, DC, 199 3. [23] S. Park, D. Lee, M. Lim, and C. Y u. S calable data management using user-base d caching and prefetching in distributed virtual en vironments. In Proc. o f VR ST ’01 , pages 121–12 6, Banif f, Alberta, Canada, 2001. [24] D. Pittman and C. GauthierDicke y . A measureme nt st udy of virtual populations in massi vely multiplayer online games. In Pr oc. of NetGames ’07 , pages 25–30, Melbourne , Australia, 2007. [25] S. Rieche, K. W ehrle, M. Fouquet, H. Niedermayer , L. Petrak, and G. Carle. Peer-to-peer -based infrastructure support for massiv ely multiplayer online games. In Pr oc. of the 4th IEEE Consumer Communications and Networking Confer ence , pages 763–767, Jan. 2007. [26] A. Steed and C. Angus. Supporting scalable peer to peer virtual en vironments using frontier sets. In Pr oc. of IEEE V irtual Reality , pages 27–34, 12-16 March 2005. [27] S. A. T an, W . Lau, and A. Loh. Network ed game mobility model for first-person-shooter games. In Pr oc. of NetGames ’05 , pages 1–9, Hawthorne , NY , 2005. [28] J. T ian, J. Haehner , C. Becker , I. Stepanov , and K. Rothermel. Graph-based mobility model for mobile ad hoc network simulation. In Pr oc. of the 35th Annual Simulation Symposium , page 337, W ashington, DC, 2002. [29] K-H. V ik, C. Griwod z, and P . Halv orsen. Applicability of group communication for increased scalability in MMOGs. In Pr oc. of NetGames ’06 , page 2, Singapore, 200 6. [30] B. De Vleeschauwer , B. V an Den Bossch e, T . V erdickt, F . De T urck, B. Dhoedt, and P . Demeester . Dynamic microcell assignment for massiv ely multiplayer online gaming. In Pr oc. of NetGames ’05 , pages 1–7, Hawtho rne, NY , 2005.
Original Paper
Loading high-quality paper...
Comments & Academic Discussion
Loading comments...
Leave a Comment