The Structure of Information Pathways in a Social Communication Network
Social networks are of interest to researchers in part because they are thought to mediate the flow of information in communities and organizations. Here we study the temporal dynamics of communication using on-line data, including e-mail communicati…
Authors: Gueorgi Kossinets, Jon Kleinberg, Duncan Watts
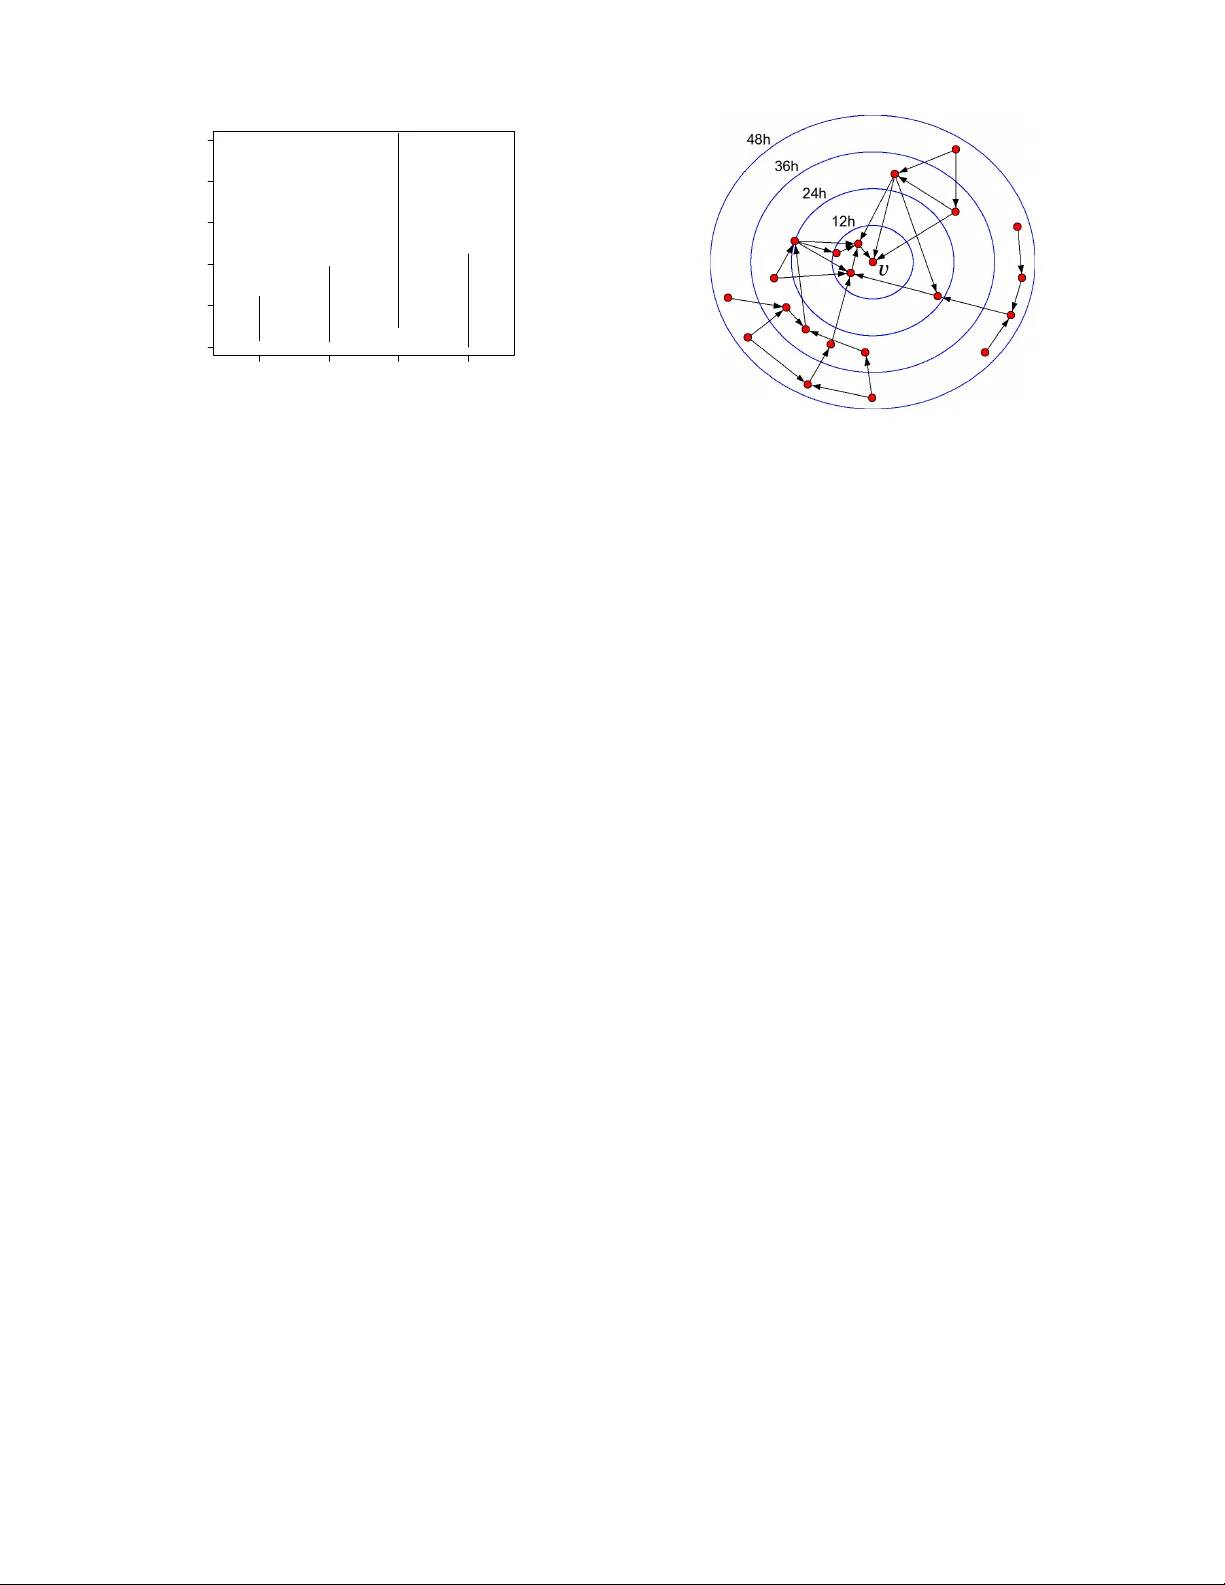
The Structure of Inf ormation P athwa ys in a Social Comm unication Netw ork Gueorgi K ossinets Dept. of Sociology Cornell University Ithaca, NY 14853 gk67@cornell.edu Jon Kleinberg Dept. of Computer Science Cornell University Ithaca, NY 14853 kleinber@cs.cornell.edu Duncan W atts Y ahoo! Research 111 W est 40th Street, 17th Fl. New Y ork, NY 10018 djw@yahoo-inc.com ABSTRA CT Social networks are of interest to researchers in part because they are thought to mediate the flow of information in communities and organizations. Here we study the temporal dynamics of communi- cation using on-line data, including e-mail communication among the faculty and staff of a large univ ersity over a two-year period. W e formulate a temporal notion of “distance” in the underlying social network by measuring the minimum time required for in- formation to spread from one node to another — a concept that draws on the notion of vector-clocks from the study of distributed computing systems. W e find that such temporal measures provide structural insights that are not apparent from analyses of the pure social network topology . In particular , we define the network back- bone to be the subgraph consisting of edges on which information has the potential to flow the quickest. W e find that the backbone is a sparse graph with a concentration of both highly embedded edges and long-range bridges — a finding that sheds new light on the rela- tionship between tie strength and connectivity in social netw orks. Categories and Subject Descriptors: H.2.8 Database Manage- ment: Database Applications – Data Mining General T erms: Measurement, Theory Keyw ords: social networks, communication latency , strength of weak ties Acknowledgments: This research was supported in part by the In- stitute for Social and Economic Research and Policy at Columbia Univ ersity , the Institute for the Social Sciences at Cornell Univer - sity , the James S. McDonnell Foundation, the John D. and Cather- ine T . MacArthur Foundation, a Google Research Grant, a Y a- hoo! Research Alliance Grant, and NSF grants SES-0339023, CCF- 0325453, IIS-0329064, CNS-0403340, and BCS-0537606. Permission to make digital or hard copies of all or part of this work for personal or classroom use is granted without fee provided that copies are not made or distributed for profit or commercial advantage and that copies bear this notice and the full citation on the first page. T o copy otherwise, to republish, to post on servers or to redistrib ute to lists, requires prior specific permission and/or a fee. KDD’08, August 24–27, 2008, Las V e gas, Nev ada, USA. Copyright 2008 A CM 978-1-60558-193-4/08/08 ... $ 5.00. 1. INTR ODUCTION Large social networks serve as conduits for communication and the flow of information [2, 11]; but information only spreads on these networks as a result of discrete communication ev ents—such as e-mail or text messages, conv ersations, meetings, or phone calls— that are distributed non-uniformly over time [10, 32]. Just because two individuals are acquainted does not imply that they have com- municated within some particular time interval, in which case no information could hav e passed directly between them. Correspond- ingly , the indirect flow of information between indi viduals requires a sequence of communication e vents along a path of intermediaries linking them. Although straightforward to state, these observ ations pose additional complications for the analysis of social networks, and can hav e important consequences for the relation between net- work structure and information flo w [14, 27]. It has been a challenge to build reasonable models for the pat- terns of communication within a social network: it is difficult to obtain data on social network structure at a large scale, and more difficult still to obtain complete data on the dynamics of a net- work’ s communication events over time. Recent research work- ing with such datasets has primarily studied communication of an event-driven nature, looking at communication within a social net- work triggered by a particular e vent or acti vity; such in vestigations hav e typically focused on communication events that ripple through many nodes over short time-scales following the triggering event. Examples of this include cascades of e-mail recommendations for products [21], cascades of references among bloggers [3, 13, 23], the spread of e-mail chain letters [24], and the search for distant targets in a social netw ork [8, 29]. These types of ev ent-driv en communication, howe ver , take place against the backdrop of a much broader set of natural communi- cation rhythms, a kind of systemic communication that circulates information continuously through the network. Pairs of individu- als communicate over time at very dif ferent rates, for an enormous range of different reasons. V iewed cumulativ ely , this background pattern enables information to piggy-back on everyday communi- cation and thus spread generally through the network. This type of systemic communication has remained essentially in visible in analyses of social networks over time, but its properties arguably determine much about the rate at which people in the network re- main up-to-date on information about each other . The present work: Systemic communication and information pathways . W e propose a framew ork for analyzing this kind of sys- temic communication, based on inferring structural measures from the potential for information to flow between different nodes. T o motiv ate this by an example, suppose we have the complete com- 1 A B C D E Wed 1 1am Wed 3pm Thu 1 pm Thu 5 pm Fri 3pm Wed 4pm Fri 8am Thu 1 1am Fri 9am Fri 4pm Wed 3pm Thu 2pm Thu 3pm Fri 1 1am Figure 1: Node B ’ s most recent potential information about node A comes via node C , not directly from A . munication history for a group of fiv e people over three days, as illustrated in Figure 1. (Edges are annotated with the one or more times at which directed communication took place.) For the sak e of this e xample, let us assume that there are no communication e vents outside the group that are relevant to the analysis. W e can now ask questions such as the following: At 5pm on Friday , what is the most recent information that node B could possibly have about node A ? Clearly B could have learned about A ’ s state as of W ednesday at 11am, when their last direct communication took place. Howev er , further inspection of the figure reveals that the most recent oppor- tunity for information to flow from A to B was in fact the Friday 9am communication from A to C , which was then follo wed by the Friday 3pm communication from C to B . W ithout knowing anything about the content of the messages, we will not necessarily kno w what, if an ything, flo wed between nodes, but this sequence of timestamps giv es us a global picture of the in- formation pathways , providing the full set of potential conduits for information to flow through the group of people. From this struc- ture, we can draw sev eral conclusions. First, still without knowing the message content, we can conclude that anything that has hap- pened to A in the past eight hours will be unkno wn to B : at Friday 5pm, B is in a strong sense (at least) eight hours “out-of-date” with respect to A . Second, assuming this interval of three days is typical of the communication dynamics within this group of five people, we can infer that direct communication does not generally provide B with the strongest opportunities to learn information about A ; rather , the indirect A - C - B path has the potential to transmit infor- mation from A to B much faster than the direct link. W e argue here that these latter two issues — out-of-date infor- mation and indirect paths — are central to an understanding of the patterns of systemic communication within a social network. The notion of individuals being out-of-date with respect to each other’ s information is an intuitiv ely natural one, and one finds implicit re- flections of it in settings ranging from the study of physical systems to social processes and fictional narrati ves. The physical world, for example, is gov erned by principle that we are at least k years out- of-date with respect to any point in space k light-years away; the notion of the light cone more generally characterizes the re gions of space-time between which information can possibly hav e flowed [28]. In sociology , the premise that occasional encounters with dis- tant acquaintances can provide important information about ne w opportunities helps form the basis for Grano vetter’ s celebrated the- ory of the strength of weak ties [11]. And in yet a different direc- tion, the idea that two individuals sometimes cannot kno w what has happened to one another, over short time spans, arises as a literary device; for example, in his novel The Gift , Vladimir Nabokov pro- vides the following grim but memorable image to con ve y the idea that it took the character Y asha’ s family several hours to learn of his suicide: ... no sooner had he reached her than both of them heard the dull pop of the shot, while in Y asha’ s room life went on for a few more hours as if nothing had happened ... [26] The role of indirect paths in social communication is also a cru- cial issue that has received relativ ely little formal attention. If we look at a social network represented simply as an unweighted graph, then any time two nodes are joined by an edge, this edge provides the most direct path between them. If we have data, how- ev er , on the times or rates at which communication actually takes place across edges, then we can discover — as in Figure 1 — that often information has the potential to flow much more rapidly via multi-step paths. In a sense, then, the A - C - B path in Figure 1 can be viewed as a “triangle-inequality violation”, in that a two-step path can be faster than a one-step path. One finds intuitiv ely nat- ural reflections of this principle in ev eryday life: a manager who talks to each of two employees much more frequently than they talk to each other, or a parent who talks to each of two adult chil- dren much more frequently than they talk to each other . W e will see later that the structure of communication in real social networks is in fact dominated by such violations of the triangle inequality . The pr esent work: V ector clocks and backbone structur es . W e now proceed to study these notions of out-of-date information and indirect paths using data for which we have complete histories of communication e vents ov er long periods of time. Our main dataset is a complete set of anonymized e-mail logs among all faculty and staff at a large university over two years [18]. W e will use this univ ersity e-mail dataset as the primary focus of discussion in the present work; b ut at the end, we also discuss the results of our anal- yses on two other sources of data: the Enron e-mail corpus [16], a widely-used dataset containing of e-mail communication among ex ecutiv es from the (now-defunct) Enron corporation; and also, in a quite different domain, the complete set of user-talk communica- tions among admins and high-volume editors on W ikipedia. T aken together , these datasets thus represent a range of different settings in which the patterns of systemic communication within a lar ge group are integral to the workflow of the group. W e find broadly similar patterns of results across all of them. W e analyze the issue of out-of-date information by adapting ideas from the field of distributed computing, which has also had to deal with the problem of potential information flow among different computing hosts — determining, for example, which machines might be affected if a gi ven host is compromised at a given point in time. In particular, we use the notion of vector clocks introduced by Lam- port and refined by Mattern to study how information spreads in distributed systems [19, 25]. (Mattern’ s de velopment, among other things, draws interesting analogies with notions of simultaneity and light-cones from special relativity [25].) Next, we formalize the notion of indirect paths by defining the network backbone — the subset of edges in the social netw ork that are not bypassed by a faster alternate path. W e propose sev eral re- lated definitions of the backbone, and for all formulations we find that the backbone is a very sparse subgraph consisting of a mix- ture of highly embedded edges and longer-range bridges. Finally , we consider how potential information flow would be affected if 2 communication were sped up or slowed do wn on certain backbone edges, and use this to draw conclusions about the effect of local communication rates on the global circulation of information. In the end, it is important to reiterate, we are using these notions of potential information flow to draw structural conclusions about social communication networks in their e veryday operation. W e do not attempt to map the actual contents of messages as they are be- ing sent, nor are we focusing on the effects of one-time, “special” ev ents that can generate novel communication flows. Rather, our goal is to approach a dual, and largely unstudied, issue — how e v- eryday patterns of communication suggest certain temporal notions of distance that are distinct from the picture that an unweighted graph provides, and how these patterns cause certain sparse sets of pathways to emerge as the lines along which information has the ability to flow the quick est. Further related work . The complete traces of communication within a network of people has been studied at moderate scales in recent years [1, 9], and very recently there have been analyses of very large-scale networks based on phone calls [27] and instant messaging [22]. These studies, howe ver , ha ve focused on struc- tural properties of the networks different from the definitions we propose here. As noted above, a number of other recent lines of research hav e focused on cascading communication triggered by specific events [3, 8, 13, 21, 23, 24], but this work too addresses issues that are quite different from our focus here. The notion of a graph annotated with the times at which the nodes communicated has been studied at a theoretical level [5, 6, 14, 15]. Holme has explored some of the theoretical definitions on network datasets [14], though in different directions from what we do here. Finally , the sub-field of distributed computing concerned with epidemic or gossip-based algorithms has focused on designing com- munication patterns that spread information quickly [7]. In con- trast, we focus here on systems that are not designed, b ut where analyses of the communication patterns over time can nonetheless provide us with insights into underlying structures in the network. 2. VECTOR CLOCKS AND LA TENCY The basic structure of the data we consider is as follows. W e are giv en a set V of people (nodes) communicating o ver a time interval [0 , T ] , and we have a complete trace of the communication events among them. Each recorded communication e vent consists of a triple ( v , w, t ) , indicating that node v sent a message to node w at time t . W e also define an unweighted directed graph that simply represents the pairs who ev er communicated; thus, we define the communication skeleton G to be the graph on V with an edge ( v , w ) if v sent at least one message to w during the observation period [0 , T ] . W e begin by briefly revie wing the approach of Lamport, Mattern, and others in the line of distributed computing research aimed at formalizing temporal lags between nodes in a netw ork [19, 25]. T o start, we consider a node v at time t and try to determine how “up- to-date” its information about another node u could be. W e can quantify this by asking the following question: what is the largest t 0 < t for which a piece of information originating at time t 0 at u could be transmitted through a sequence of communications and still arriv e at v by time t ? W e call this largest t 0 the view that v has of u at time t , and denote it by φ v,t ( u ) . The amount by which v ’ s view of u is “out-of-date” at time t is gi ven by t − φ v,t ( u ) ; we will call this the information latency of u with respect to v at time t . For example, in Figure 1, the views that B has of A , C , D , and E at Friday 5pm are, respectiv ely , Fri 9am, Fri 3pm, Thu 3pm, and Fri 11am; and hence the latencies are 8 hours, 2 hours, 26 hours, and 6 hours. (W e will define φ v,t ( v ) = t for all v and t : v is always completely up-to-date with respect to itself.) Finally , we can take all the views of other nodes that v has at time t and write it as a single vector φ v,t = ( φ v,t ( u ) : u ∈ V ) . W e refer to φ v,t as the vector clock of v at time t [19, 25]. There is a simple and efficient algorithm to compute the vector clocks for all nodes at all times in [0 , T ] by a single pass through the history of communication events ( v , w , t ) , ordered by increasing t [19, 25]. The algorithm proceeds by maintaining each vector clock φ v as a variable that is updated when v receiv es a communication. W e initialize each vector φ v to have a special null symbol ⊥ in each coordinate (except that φ v, 0 ( v ) = 0 ), indicating that no node has yet heard, even indirectly , from any other . Then, in general, when we process event ( v , w , t ) , we update the vector clock φ w to be the coordinatewise maximum of the current values of φ v and φ w (treating ⊥ as smaller than any number); this reflects the fact that when v sends a message to w , node w gets a view of each node that is the more recent of v ’ s vie w and w ’ s vie w . (When we process this ev ent, we set φ v,t ( w ) = t , since v has just heard from w .) W e run this procedure for all events, thus obtaining a value for the vector clock of each node at each point in time. Latencies in Social Network Data . W e now examine these la- tency measures in the context of real social communication data. Again, we focus on our univ ersity e-mail dataset, but in the final section we also discuss our other datasets — the Enron corpus and the communications among W ikipedia editors. For the uni versity e-mail study we start from the complete set of communication ev ents among the 8160 faculty and staff at a large univ ersity over two years, and then we preprocess this set in two ways. First, it is an interesting open question to consider the ap- propriate role for messages with large recipient lists in this type of analysis; howe ver , for the present study , we eliminate them by considering only messages with at most c recipients other than the sender , for small v alues of c (ranging between 1 and 5 ). 1 Messages with a single recipient account for 82% of all messages, while mes- sages with at most c = 5 recipients account for 97% ; the results here are stable across all these values of c , and in this discussion we focus on the case of single-recipient messages. Our second type of preprocessing is the follo ws. Because not all members of the full population used their e-mail addresses activ ely during this time, we focus on the q -fraction of highest-volume e- mail users in this set, for various values of q . In this discussion we use q = . 20 , defining a set in which each user sent or received a message at least approximately once an hour during working hours for the full two-year time period. Howev er , the results discussed here are robust as q varies ov er a wide range. W e begin our analysis by considering the distribution of infor- mation latencies — in other words, measuring how far out-of-date the rest of the world is with respect to different nodes. For a time difference τ , we define the ball of radius τ ar ound node v at time t , denoted B τ ( v , t ) , to be the set of all nodes whose latency with respect to v at time t is ≤ τ days. No w , for fixed t , the distribu- tion of ball-sizes over nodes can be studied using a function f t ( τ ) , defined as the median value of | B τ ( v , t ) | over all v ; this is simply the number of people who are within τ days out-of-date of a typi- cal node. In Figure 2 the lower curve plots (on a log-linear scale) the av erage value of f t ov er 21 fixed values of t , equally spaced around one week to account for weekly variation. W e see that af- 1 W e use a heuristic based on timestamps and file sizes to detect multi-recipient messages that a mail client or server has serialized into many single-recipient messages for purposes of transmission. 3 ● ● ● ● ● ● ● ● ● ● ● ● ● ● ● ● ● ● ● ● ● ● ● ● ● ● ● ● ● ● ● ● ● ● ● ● ● ● ● ● ● ● ● ● ● ● 0 1 2 3 4 1e−04 1e−02 1e+00 τ τ , days Median fraction of world within τ τ exp( −5.6 + 1.5 τ τ ) exp( −7 + 1.5 τ τ ) exp( −7.5 + 2.7 τ τ ) exp( −7.9 + 2.1 τ τ ) ● observed randomized Figure 2: The distribution of latencies among the 20% of highest-volume e-mail users. ter an initial 12-hour ramp-up, the the number of people at τ days latency from a typical node grows in an approximately piecewise exponential fashion. The effect is that for a typical person v in this community , there are only about 12 other people who are within a day and a half out-of-date with respect to v , while there are over 200 people within four days. Extending this curve until the ball-size is half the community , we find that the median latency between node pairs is 7 . 5 days. Now , to put the quantity 7 . 5 days in context, we can compare it to other possible measures of “distance” in the network. If we look at unweighted distances (i.e. simple “hop-counts”) in the communi- cation skeleton G , we find that the median distance between nodes is 3 , a very small number characteristic of the small-world proper- ties of such networks [29, 31]. But the simple fact that people in this community are “three degrees of separation” apart cannot be directly translated into statements about the potential for informa- tion flow , since that requires the temporal data that forms the basis for our definition of information latency . W ith temporal data in hand, we see that latency depends both on the variation in who people communicate with and also the on the variation in how frequently they communicate. W e can thus put the observ ed quantities in perspecti ve by holding the frequenc y of communication fixed, and studying how the latencies change as we vary the choice of communication partners. In particular, we compare the observed information latencies with the results of a randomized baseline, as follows. Suppose that we simulate the sequence of e-mail exchanges, e xcept that for each communication ev ent, we have the sender contact a uniformly random person rather than their true recipient in the data. In this way , the potential for information flow occurs at the speed of a random epidemic, rather than according to the actual trace of e-mail communication. The randomized latencies are generally shorter than the real latencies, and the upper curve in Figure 2 plots the median ball-sizes for this baseline. These ball-sizes also gro w in a roughly piecewise exponential fashion, and the median latency among node pairs under random- ized communication is 4 . 6 days. Interestingly , the local exponential growth rates of the real latencies and the randomized baseline are roughly the same after about 36 hours; it is the faster exponential “head start” within this first 36 hours that allows the randomized baseline to spread so much more quickly . Essentially , under the real communication pattern, the typical person resides in a kind of temporal “bubble” at the 36-hour radius, in which they can only be aware of information from about 12 other people. With randomized ● ● ● ● ● ● ● ● ● ● ● ● ● ● ● ● ● ● ● ● ● ● ● ● ● ● ● ● ● ● ● ● ● ● ● ● ● ● ● ● ● ● ● ● ● ● ● 0.0 0.1 0.2 0.3 0.4 0.5 0.6 0 5 10 15 20 25 Top q−fraction of active users Median τ τ , days Figure 3: The median latency for different q -fractions of the community , both in isolation and embedded in the full commu- nity . communication, on the other hand, information breaks out quickly to man y people; the median ball-size at 36 hours is already 50 peo- ple. This initial difference plays a significant role in the different ball-sizes multiple days later . Open worlds vs. closed worlds . Any dataset of communicating people V will be typically embedded in some much larger , unob- served set V 0 . If we could watch the communication in this larger set V 0 , the latencies even just among nodes in V would decrease, due to quick paths between members of V that snake in and out of V 0 − V . W e wish to understand this effect, so that we know how to interpret latencies as we measure them in the “closed world” V rather than the “open world” where V is embedded in a larger V 0 . In sociology , this is known as the boundary specification pr oblem [17, 20], and it is inherent in essentially any study of a social net- work embedded in some lar ger world. W e can address the ef fects of this issue in our conte xt as fol- lows. Since we are studying the q -fraction of most active users in our university e-mail set, we can ask how median latencies differ depending on whether we study this q -fraction in isolation, or em- bedded in the full set of faculty and staff (the q = 1 . 0 fraction). W e show this in Figure 3: the upper curve plots median latency as a function of q when the most active q -fraction is observed on its own, and the lower curve plots the median latency in the same set when it is observed embedded in the full community . For extremely small values of q , the effect is considerable, b ut once q exceeds 0 . 1 , the effect becomes surprisingly ne gligible. In addition to providing validation for the analysis of dif ferent q - fractions in isolation, we believ e this implicitly supports a broader type of approximation — specifically , when an activ e e-mail net- work implicitly defines a natural community on its members (as in the university community in this case), it suggests ways to reason about it as a free-standing object despite the fact that it is embedded in the unobservable global e-mail netw ork. Quantifying the strength of weak ties . In a paper that has been very influential in sociology , Granovetter proposed that weak ties — connections to people who form weaker acquaintance relation- ships, rather than close friendships — play an important role in con- ve ying information to each of us from parts of the social network that are inaccessible to our circles of close friends [11]. As a con- crete example, Granov etter found that people very often reported receiving information leading to new jobs not from close friends, 4 ● Edge range Total advance per message (days) 0 1 2 3 4 5 2 3 4 ∞ ∞ ● ● ● ● Figure 4: The distribution of clock-advances per message as a function of edge range. but from more distant acquaintances; the close friends were per- haps more motiv ated to help in tracking down job leads, b ut the more useful information came through the distant acquaintances. Granov etter formalized this by introducing a parameter that we call the range of an edge e = ( v , w ) , defined to be the unweighted shortest-path distance in the social network between v and w if e were deleted; the range is thus the (unweighted) length of the short- est “alternate path” between the endpoints [11, 30]. Most edges in a typical social network will hav e range two, indicating that v and w have at least one friend in common. Granovetter’ s argument was that edges of range greater than two are generally weak ties — i.e., edges connecting us to acquaintances with whom we have less frequent communication — and that these long-range edges are the sources of important information to their endpoints. How- ev er , he noted [12] that despite intervie w-based methods to e xplore this principle, it has been an open question to provide quantitative evidence for it on social-netw ork datasets. W e argue here that our vector -clock analysis can provide evi- dence for this phenomenon. If we recall the algorithm that com- putes the vector clocks, the basic step is to update the clock of a node w when it receiv es a message from some other node v . Let us define the advance in w ’ s clock to be the sum of coordinate wise differences between φ w before the update from v and φ w after the update from v . Intuitively , the adv ance is then the potential for new information about the rest of the world that w has gained as a re- sult of this single communication with v — a way of formalizing the type of information-flo w that Grano vetter’ s work addresses. T o get at his observation, we can thus ask: if ( v , w ) is an edge in the communication skeleton G of range greater than two, does each communication from v result in an unusually large advance to w ’ s clock? While this is a subtle effect to capture, we see evidence for pre- cisely this in Figure 4. As a function of edge range r , we plot the median clock-adv ance per message ov er all edges in G at the given range r (the open circles in the plot), as well as the 25 th and 75 th percentiles (the vertical line segments). Due to the active commu- nication within this group over two years, there are no edges of finite range larger than four; the infinite-range edges are bridges whose removal would disconnect the network. (Since one side of each of these bridges is typically an extremely small set of nodes, it is not necessarily surprising to see a typical clock advance that is smaller than the case of range 4 .) In summary , we see that the clock-advance per message increases with edge range, particularly for edges of range 4 , thus suggesting that long-range bridges can Figure 5: A drawing of a small part of a backbone H t com- puted from the university e-mail data, sho wing only the por- tions induced on a particular node v and all nodes within 48 hours latency of v . Concentric circles denote ball radii increas- ing by 12 hours each, and the distance of each node from the common center is its latency from v . indeed be effecti ve in transferring information from otherwise dis- tant parts of the network. 3. B A CKBONE STR UCTURES Having considered methods for analyzing the notion of out-of- date information, we now use this to study the second issue men- tioned at the outset — the structure of fast indirect paths — by introducing a concept that we call the backbone . Defining the backbone . T o develop this idea, we start by recalling the observation from the example in Figure 1, where the direct A - B edge was a slower conduit for potential information from A to B than the indirect path A - C - B . Let us say that an edge ( v , w ) in the communication skeleton G is essential at time t if the value φ w,t ( v ) is the result of a vector -clock update directly from v , via some communication e vent ( v , w, t 0 ) where t 0 ≤ t . In other words, the edge is essential if w ’ s most up-to-date view of v is the result of direct communication from v , rather than a sequence of updates along an indirect path from v to w . Thus for example, in Figure 1, consider all edges linking to B in the communication skeleton: the edges ( C, B ) and ( E , B ) are essential at Friday 5pm, b ut the edges ( A, B ) and ( D , B ) are not. W e define the backbone H t at time t to be the graph on V whose edge set is the collection of edges from G that are essential at time t . (Although H t is a directed graph, we will also sometimes study properties of it as an undirected graph, simply by suppressing the directions of the edges.) Thus the backbone reflects those commu- nications responsible for all nodes’ up-to-date views at a giv en time t — i.e., those that are not “bypassed” by some indirect path. As a visual illustration, Figure 5 depicts a small part of a back- bone H t computed from the univ ersity e-mail data, drawing only the portions induced on a particular node v and all nodes within 48 hours latency of v . An aggregate backbone . The backbone is defined at each point in time via vector -clocks; but it is also useful to have a single graph that summarizes in an analogous but simpler way the “ag- gregate” communication over the full two-year period, and to be able to compare this simplified structure to the backbones defined thus far . W e can define such an aggre gate structure by approximat- 5 0 200 400 600 0 5 10 15 20 Time (days) Mean degree in backbone Figure 6: The av erage degree over time in the backbone, with the horizontal line depicting the average degree of ≈ 5 in the aggregate backbone H ∗ . ing communication between pairs of nodes as perfectly periodic. For each edge ( v , w ) in the communication skeleton G such that v has sent ρ v,w > 0 messages to w over the full time interval [0 , T ] , we define the delay δ v,w of the edge ( v , w ) to be T /ρ v,w . This can be vie wed as the gap in time between messages from v to w , if communication from v to w were ev enly-spaced. Now consider the weighted graph G δ obtained from the com- munication skeleton G by assigning a weight of δ v,w to each edge ( v , w ) . The path of minimum total delay between two nodes x and y — i.e., the path with minimum sum of delays on its edges — represents the fastest that information could flow from x to y in this “aggregate” setting where communication is ev enly spaced. W e can now ask which edges are essential in an aggregate sense: if, ov er the full time period studied, the y are not bypassed by faster indirect paths. Thus, we say that an edge e = ( v , w ) in G δ is essen- tial if it forms the minimum-delay path between its two endpoints, and we define the aggr egate backbone H ∗ to be the subgraph of G δ consisting only of essential edges. (F or the sake of easier ter- minology , we will sometimes refer to the backbones H t at fixed times t as instantaneous backbones , by contrast with the aggre gate backbone which is based on an aggregate construction that takes all times into account.) W e note that the construction of the aggregate backbone H ∗ can be done more efficiently than by simply considering each edge of G δ separately . Rather , we can compute a weighted shortest-paths tree rooted at each node of G δ , using the delays as weights; the union of the edges in all these trees will be H ∗ , by the following proposition. P RO P O S IT I O N 3.1. An edge e = ( v , w ) belongs to H ∗ if and only if it lies on the minimum-delay path between some pair of nodes x and y . P RO O F . The “only if ” direction is immediate, so we focus on proving that if e lies on the minimum-delay path between some pair of nodes x and y , then it is essential. W e do this by contra- diction: suppose e lies on the minimum-delay path P x,y between some nodes x and y , but it is not the minimum-delay path between its endpoints v and w . This means that there is a path P v,w of strictly smaller delay than the edge ( v , w ) . Now let P x,v be the subpath of P x,y from x to v , and let P w,y be the subpath of P x,y from w to y . Concatenating P x,v , P v,w , and P w,y would give an x - y path of strictly smaller delay than that of P x,y , which is the contradiction we seek. 1 2 5 10 20 50 200 500 1 2 5 10 20 Degree Backbone degree ● ● ● ● ● ● ● ● ● ● ● ● ● ● ● ● ● ● ● ● Figure 7: In-degree (circles) and out-degree (crosses) in the aggregate backbone as a function of degree in the full commu- nication skeleton G . The sublinear growth indicates that the backbone eliminates edges from high-degree nodes at a greater rate. Density and node degrees of the backbones . While the commu- nication skeleton is a fairly dense graph, we find that the back- bones and the aggregate backbone are surprisingly sparse — in other w ords, from the point of vie w of potential information flo w , a significant majority of all edges in the social network are bypassed by faster indirected paths. In particular , Figure 6 shows the average degree in the instanta- neous backbones H t as a function of time. Note that there are clear boundary effects as the vector clocks get “up to speed, ” but after this initial phase the average degree stabilizes to approximately 13 ev en as the backbone itself changes o ver time. The aggreg ate back- bone H ∗ is sparser still: its average degree is approximately five (the horizontal line in Figure 6). For comparison, the average node degree in the communication sk eleton is approximately 50 . In sum- mary , ev en in this community of active users of e-mail, the typical person has only fi ve contacts that are not bypassed by shorter paths in steady-state ov er a long time period. The fact that the instantaneous backbones H t are roughly 2 . 5 times as dense as the aggreg ate backbone indicates the local b ursti- ness of communication in the network: at any particular point in time, people hav e essential communication with certain contacts that are not sustained in steady-state ov er the full tw o-year interv al. It thus becomes natural to ask how much ov erlap there is between the instantaneous backbones H t and the sparser aggregate back- bone. W e find in fact that the o verlap is substantial: each backbone H t , on aver age, contains roughly 3 / 4 of the edges from H ∗ . Of course, which particular edges of H ∗ appear in any one H t varies considerably with t . Thus, it is reasonable to think of the instan- taneous backbones H t as roughly consisting of a large but vary- ing piece of the aggregate backbone, supplemented with transient edges whose membership in the backbone changes more rapidly ov er time. Considering the backbone also sheds further light on the role of high-de gree nodes in the social network. It has been argued that high-degree nodes play a crucial function in the structure of short paths in unweighted graphs [4]. It has also been argued, ho w- ev er , that the importance of these “hubs” diminishes considerably once temporal effects are taken into account [10]. W e find support for both arguments: high-degree nodes in the full communication skeleton G indeed hav e many incident edges in the aggreg ate back- bone; howe ver the fraction of a node’ s edges that are declared es- 6 ● ● ● Edge range Fraction in backbone 0.0 0.2 0.4 0.6 0.8 1.0 2 3 4 ∞ ∞ ● ● Figure 8: Proportion of edges in the backbone for each edge range. The lower curve is for the aggregate backbone and the upper curve is f or the instantaneous backbones. The horizontal lines represent the overall fraction of edges in the r espective backbones. ● ● ● ● ● ● ● ● ● ● ● ● ● ● ● ● ● ● ● ● 0.0 0.1 0.2 0.3 0.4 0.5 0.6 0.0 0.1 0.2 0.3 0.4 0.5 0.6 Edge embeddedness Fraction in backbone Figure 9: Proportion of range-2 edges in the backbone as a function of embeddedness. Symbols are as in Figur e 8. sential strictly decr eases with degree. As Figure 7 illustrates, nodes of degree k in G have an average degree of approximately k 0 . 6 in the aggregate backbone H ∗ ; thus, the fraction of a node’ s edges that are essential is decreasing in its degree as k − 0 . 4 . A corre- sponding effect holds for the instantaneous backbones H t , where nodes of degree k in G have average degree approximately k 0 . 65 , an exponent that remains stable over time after an initial start-up period. Thus the backbones have a kind of “leveling” effect on the degrees, in which the spread between low and high degrees is con- tracted faster than just proportionally when we move from G to its backbones. Structure of the backbone . Intuitiv ely , the backbone is trying to balance two competing objecti ves: representing edges that span different parts of the network, which transmit information at long ranges; and representing v ery rapidly communicating edges, which will typically be embedded in denser clusters and transmit informa- tion at short ranges over quick time scales. In fact, we will see in Figures 8 and 9 that the mixture of edges in the backbone achieves precisely a version of this trade-off. For this discussion, we view the backbones as undirected graphs simply by suppressing the di- rections of the edges. In Figure 8, we sho w the proportion of edges from G that belong to the backbones, as a function of their range. (Recall that the r ange of an edge e is defined as the distance between the endpoints of e , when e itself is deleted.) The lower curve depicts the aggregate backbone, while the upper curve depicts the average over instan- taneous backbones. In each case, we see that there is an under- representation of edges of the intermediate range 3 , with a greater density at the two extremes of range 2 and range 4 . The large pro- portion of range- 4 edges in the backbone is another reflection of the strength-of-weak-ties principle discussed earlier — long-range edges serve as important conduits for information. T o understand the picture at the other extreme, with edges of range 2 , it is useful to further refine this set of edges using the notion of embeddedness. W e define the embeddedness of an edge to be, roughly , the frac- tion of its endpoints’ neighbors that are common to both. Formally , for an edge e = ( v , w ) , let N v and N w denote the sets of neighbors of the endpoints v and w respectiv ely . W e define the embeddedness of e to be | N v ∩ N w | / | N v ∪ N w | . Thus, highly embedded edges intuitiv ely occup y dense clusters, in that their endpoints ha ve man y neighbors in common. W e see in Figure 9 that highly-embedded edges are also overrepresented in both the aggregate and instanta- neous backbones. This may be initially surprising, since edges of large embeddedness have many possible two-step paths that could short-cut around them; their presence in the backbone is thus a re- flection of the generally elevated rate of communication that takes places on such edges. T aken together , then, these results on range and embeddedness indicate a striking sense in which the backbone balances between two qualitatively different kinds of information flow: flows that arriv e at long range over weaker ties, and flows that travel quickly through densely clustered regions in the network. 4. V AR YING SPEED OF COMMUNICA TION W e note that although the social communication patterns we are studying arise organically (rather than being centrally designed), one can nev ertheless study how the resulting latencies depend on local variations in communication styles. One could ask this ques- tion in the context of communication within a large organization, for example: how do individuals’ decisions about communication strategies af fect the ov erall rate of potential information flo w in the organization? Of course, analysis of such questions can also po- tentially provide insight into the design of information-spreading mechanisms in engineered networks as well [7]. In particular , we study what happens to information latencies when each node keeps its set of contacts the same, but varies the relativ e rates of its communication with these contacts. Suppose we assume the communication skeleton G represents the complete set of potential communication partners for each person, and we allo w people to change the individual rates at which they send messages to these partners, while keeping their total daily volume fixed. Are there simple ways to change individual rates that will reduce the shortest-path delays among pairs in the aggregate backbone? As a baseline for comparison, we can consider the optimal re- duction in delay , given a central planner with complete knowledge of the network. Here is a concrete way to formalize this optimiza- tion question in general. W e are given a directed graph G , with a total rate ρ v for each node v . W e are also given a set S of pairs of nodes in G whose shortest-path delays we want to reduce. Each node v can choose a rate ρ v,w at which to communicate to each of its neighbors w , subject to the constraint that P w ρ v,w = ρ v . These rates define delays δ v,w = T /ρ v,w as in our construction of the aggregate backbone. (Rates ρ v,w can be set to zero, in which case the resulting edge ( v , w ) is taken to have infinite delay .) Now , 7 0.0 0.5 1.0 1.5 2.0 0 20 40 60 80 100 γ γ Median delay (days) Figure 10: Median shortest-path delay in the aggregate back- bone (solid line) as a function of the load-reweighting parame- ter γ . Dashed lines represent the 25 th and 75 th percentiles of the shortest-path delay . the question is: for a giv en bound δ , can we choose rates for each node so that the median shortest-path delay between pairs in S in the aggregate backbone is at most δ ? As formulated, this optimization problem is intractable. T H E O R E M 4.1. The delay minimization pr oblem defined above is NP-complete. Pr oof Sketch. W e reduce from the 3-SA T problem. Given a set of variables x 1 , ..., x n and clauses to satisfy , we construct a graph G , pairs S , and node rates ρ v as follows. For each variable x i , we construct three nodes u i , v i , w i with edges ( u i , v i ) and ( u i , w i ) . For each clause C j , we construct nodes s j and t j ; then, for each variable x i in clause C j , we add edges ( s j , u i ) and ( v j , t j ) if x i occurs positiv ely in C j , and we add edges ( s j , u i ) and ( w j , t j ) if x i occurs negati vely in C j . Each node is giv en a rate of 1 . Finally , we ev aluate the median shortest-path delay for the pairs S = { ( s j , t j ) } . Now , if there is a satisfying truth assignment, then we can put a rate of 1 on edge ( u i , v i ) if x i is set to T rue , and a rate of 1 on edge ( u i , w i ) if x i is set to F alse . W e can also put a rate of 1 on edges ( s j , u i ) where x i is a variable that satisfies C j . This makes all shortest-path delays between pairs in S equal to 3 ; con versely , if the median shortest-path delay between pairs in S can be made equal to 3 , then each pair in S must have delay 3 , in which case a satisfying assignment can be determined from the paths that are used. Load-leveling vs. load-concentrating . While this intractability shows the difficulty in optimally accelerating communication, a more realistic goal is to consider simple local rules by which indi- viduals in a network might vary their rates of communication so as to influence the potential for information flow . A basic qualitative version of this question is the following: for accelerating potential information flow , is it better to talk ev en more activ ely to one’ s most frequent contacts, or to balance things out by increasing communi- cation with the less frequent contacts? W e could refer to the former strategy as load-concentr ating , since it pushes more traffic onto the already-high-volume edges, and we could refer to the latter strategy as load-leveling , since it tries to le vel out the traf fic across edges. W e can study this in the univ ersity e-mail data by choosing a re- scaling exponent γ and modifying the rates of communication on the edges emanating from each node v , changing ρ v,w to ρ γ v,w and then normalizing all rates from v to keep its total outgoing message volume the same. V arying γ thus smoothly parametrizes a family of different strategies, with values γ > 1 corresponding to load- concentrating strategies — since already-large rates are amplified — while values γ < 1 correspond to load-leveling strate gies. In Figure 10, we show the effect of these strategies on the me- dian shortest-path delay in the aggregate backbone. W e note, first of all, the interesting fact that γ = 1 is close to the best possible for shortest-path delays; in other words, the existing rates of com- munication are close to optimal, in terms of potential information flow , over this class of strategies. Howe ver , there is still room for improv ement in the shortest-path delay: the optimal median, over all γ , occurs at γ ∗ ≈ 1 . 2 . The fact that γ ∗ > 1 indicates an in- teresting and perhaps unexpected result: that increasing the rate of communication to the most frequent contacts actually has the ef fect of reducing shortest-path delays — a result at odds with the intu- ition that making stronger use of infrequent contacts and weak ties is the way to reduce latency . Node-dependent delays . There is an extension of the model that sheds further light on this finding. Suppose we extend the notion of delay to hav e not just delays δ v,w on each edge, but also a fixed delay of ε at each node, so that the total delay on a path becomes the sum of the edge and node delays. In other words, as information flows it incurs additional delays from each node that handles it. Naturally , as ε increases, there is a larger penalty for paths that take more hops, and minimum-delay paths increasingly come to resemble those of minimum hop-count. This leads to a denser backbone, as fewer edges are rendered inessential. The value of γ at which network latency is optimized decreases with ε , cross- ing γ ∗ = 1 at ε ≈ 4 days. Thus, as the speed of diffusion path- ways is determined increasingly by node-specific (rather than edge- specific) delays, the backbone becomes denser , and the importance of quick indirect paths diminishes. Moreo ver , as node delays in- crease, the optimal re-scaling of communication for reducing net- work latency transitions from load-concentrating to load-le veling. 5. CONCLUSIONS The basic definitions of social network analysis hav e been pri- marily built on graph-theoretic foundations rooted in unweighted graphs. Here we have e xplored ho w this perspectiv e changes when one makes integral use of information about how nodes communi- cate over time. Rather than explicitly tracking the content of this communication, we dev elop structural measures based on the po- tential for information to flow; in this way , we can get at elusive notions around the network’ s e veryday rhythms of communication. W ith this view , some of the direct connections in the network become much longer, due to low rates of communication, while other multi-step paths become much shorter, due to the rapidity with which information can flo w along them. W e find that adapting the notion of vector-cloc ks from the analysis of distributed systems provides a principled way to measure how “out-of-date” one person is with respect to another, and we find that the sparse subgraph of edges most essential to keeping people up-to-date — the backbone of the network — provides important structural insights that relate to embeddedness, the role of hubs, and the strength of weak ties. Finally , this style of analysis allows us to study the effects on infor- mation flo w as nodes v ary the rate at which they communicate with others in the network, ranging from strategies in which communi- cation is concentrated on heavily-used edges to those in which it is lev eled out across many edges. This style of analysis is applicable to any setting in which a group of individuals is engaged in acti ve communication with the goal of 8 exchanging information, and when there is data av ailable on the temporal sequence of communication events. As discussed earlier , we have also explored the measures defined here in other e-mail datasets (the Enron corpus), as well as in settings that are quite different from e-mail networks — in particular, we hav e applied vector -clock and backbone analysis to the communications among admins and other high-activity editors on W ikipedia, using edits to user-talk pages as communication ev ents. Wikipedia is a set- ting where it is particularly easy to get public data with complete communication histories, but it is also representativ e of communi- ties that maintain themselves through on-line communication and coordination (large open-source projects and large media-sharing sites are other examples). Although the dynamics and patterns of communication in all three of our datasets are quite dif ferent, we find that a large number of the qualitative findings discussed for the university e-mail do- main carry ov er to the other settings studied, including the sparsity of the aggregate and instantaneous backbones and the variation in node de grees. In particular , the typical aggregate backbone degrees around 5 and the recurring sub-linear “compression” of de grees — where nodes of degree k in the full skeleton ha ve typical backbone degree ∼ k c for c ≈ 0 . 5 – 0 . 6 in all three datasets — are common patterns that seem to call for a deeper theoretical explanation. On the other hand, compared to the university e-mail dataset, we find that the “core” of activ e communicators is much smaller in both the Enron corpus (since it is data from a limited set of employees’ mail- box folders) and in W ikipedia (due to the specifics of community dynamics), and this makes the range of an edge in the unweighted communication skeleton harder to interpret and to correlate with other measures for both these other domains. In a sense, this is nat- ural: principles about long-range edges and their ef fects are derived from properties of large populations with natural sub-communities — as we find in the uni versity e-mail data — and it is not clear that long-range edges carry the same meaning in much smaller popula- tions. In general, we see the analysis framework proposed here as a way of comparing the different kinds of communication dynamics within different communities. Further in vestigation of these no- tions could ultimately shed light on the principles that govern the dynamics of different types of information, and how these princi- ples interact with the directed, weighted nature of social communi- cation networks. 6. REFERENCES [1] L. Adamic and E. Adar . How to search a social netw ork. Social Networks , 27(3):187–203, 2005. [2] L. A. Adamic, B. A. Huberman. Information dynamics in the networked w orld. Springer Lec. Notes. Phys. 650(2004). [3] E. Adar, L. Zhang, L. A. Adamic, and R. M. Luk ose. Implicit structure and the dynamics of blogspace. In W orkshop on the W eblogging Ecosystem , 2004. [4] R. Albert, H. Jeong, and A.-L. Barab ´ asi. Error and attack tolerance in complex networks. Natur e , 406:378–382, 2000. [5] K. Berman. V ulnerability of scheduled networks and a generalization of Menger’ s theorem. Networks , 28(1996). [6] E. Cheng, J. W . Grossman, and M. J. Lipman. T ime-stamped graphs and their associated influence digraphs. Discr ete Applied Mathematics , 128:317–335, 2003. [7] A. J. Demers, D. H. Greene, C. Hauser, W . Irish, J. Larson, S. Shenker , H. E. Sturgis, D. C. Swinehart, D. B. T erry . Epidemic algorithms for replicated database maintenance. Pr oc. 6th A CM Symp. Principles of Distributed Comp. , 1987. [8] P . Dodds, R. Muhamad, and D. W atts. An experimental study of search in global social networks. Science , 301(2003). [9] J.-P . Eckmann, E. Moses, and D. Sergi. Entropy of dialogues creates coherent structures in e-mail traffic. Pr oc. Natl. Acad. Sci. USA , 101:14333–14337, 2004. [10] D. Gibson. Concurrency and commitment: Network scheduling and its consequences for diffusion. J ournal of Mathematical Sociology , 29(4):295–323, 2005. [11] M. Granovetter . The strength of weak ties. American Journal of Sociology , 78:1360–1380, 1973. [12] M. Granovetter . The strength of weak ties: A network theory revisited. Sociolo gical Theory , 1:201–233, 1983. [13] D. Gruhl, D. Liben-Nowell, R. V . Guha, and A. T omkins. Information diffusion through blogspace. In Pr oc. 13th International W orld W ide W eb Conference , 2004. [14] P . Holme. Network reachability of real-world contact sequences. Physical Revie w E , 71:046119, 2005. [15] D. Kempe, J. Kleinberg, and A. K umar . Connectivity and inference problems for temporal networks. In Pr oc. 32nd A CM Symp. on Theory of Computing , pages 504–513, 2000. [16] B. Klimt and Y . Y ang. The Enron corpus: A new dataset for email classification research. In Pr oc. 15th Eur opean Confer ence on Machine Learning , pages 217–226, 2004. [17] G. Kossinets. Ef fects of missing data in social networks. Social Networks , 28:247–268, 2006. [18] G. Kossinets and D. W atts. Empirical analysis of an ev olving social network. Science , 311:88–90, 2006. [19] L. Lamport. Time, clocks, and the ordering of e vents in a distributed system. Comm. A CM , 21(7):558–565, 1978. [20] E. Laumann, P . Marsden, D. Prensky . The boundary specification problem in network analysis. In R. S. Burt and M. J. Minor , editors, Applied Network Analysis , 1983. [21] J. Leskov ec, L. Adamic, B. Huberman. The dynamics of viral marketing. Pr oc. 7th ACM Conf. Elec. Commer ce , 2006. [22] J. Leskovec and E. Horvitz. W orldwide buzz: Planetary-scale views on an instant-messaging netw ork. In Pr oc. 17th International W orld W ide W eb Conference , 2008. [23] J. Leskovec, M. McGlohon, C. F aloutsos, N. Glance, and M. Hurst. Cascading behavior in lar ge blog graphs. In Pr oc. SIAM International Confer ence on Data Mining , 2007. [24] D. Liben-Nowell and J. Kleinberg. T racing information flow on a global scale using Internet chain-letter data. Pr oc. Natl. Acad. Sci. USA , 105(12):4633–4638, Mar . 2008. [25] F . Mattern. V irtual time and global states of distributed systems. W orkshop on P arallel and Distrib uted Algs. 1989. [26] V . Nabokov . The Gift . (English translation by M. Scammel and V . Nabokov .) V intage, 1963. [27] J.-P . Onnela, J. Saramaki, J. Hyvonen, G. Szabo, D. Lazer , K. Kaski, J. Kertesz, and A.-L. Barabasi. Structure and tie strengths in mobile communication networks. Pr oc. Natl. Acad. Sci. USA , 104:7332–7336, 2007. [28] E. F . T aylor and J. A. Wheeler . Spacetime Physics: Intr oduction to Special Relativity . W .H. Freeman, 1992. [29] J. Tra vers and S. Milgram. An experimental study of the small world problem. Sociometry , 32(4):425–443, 1969. [30] D. J. W atts. Small W orlds: The Dynamics of Networks Between Or der and Randomness . Princeton U. Press, 1999. [31] D. J. W atts and S. H. Strogatz. Collectiv e dynamics of ’ small-world’ networks. Natur e , 393:440–442, 1998. [32] H. C. White. Everyday life in stochastic networks. Sociological Inquiry , 43:43–49, 1973. 9
Original Paper
Loading high-quality paper...
Comments & Academic Discussion
Loading comments...
Leave a Comment