Fair Access Provisioning through Contention Parameter Adaptation in the IEEE 802.11e Infrastructure Basic Service Set
We present the station-based unfair access problem among the uplink and the downlink stations in the IEEE 802.11e infrastructure Basic Service Set (BSS) when the default settings of the Enhanced Distributed Channel Access (EDCA) parameters are used. …
Authors: Feyza Keceli, Inanc Inan, Ender Ayanoglu
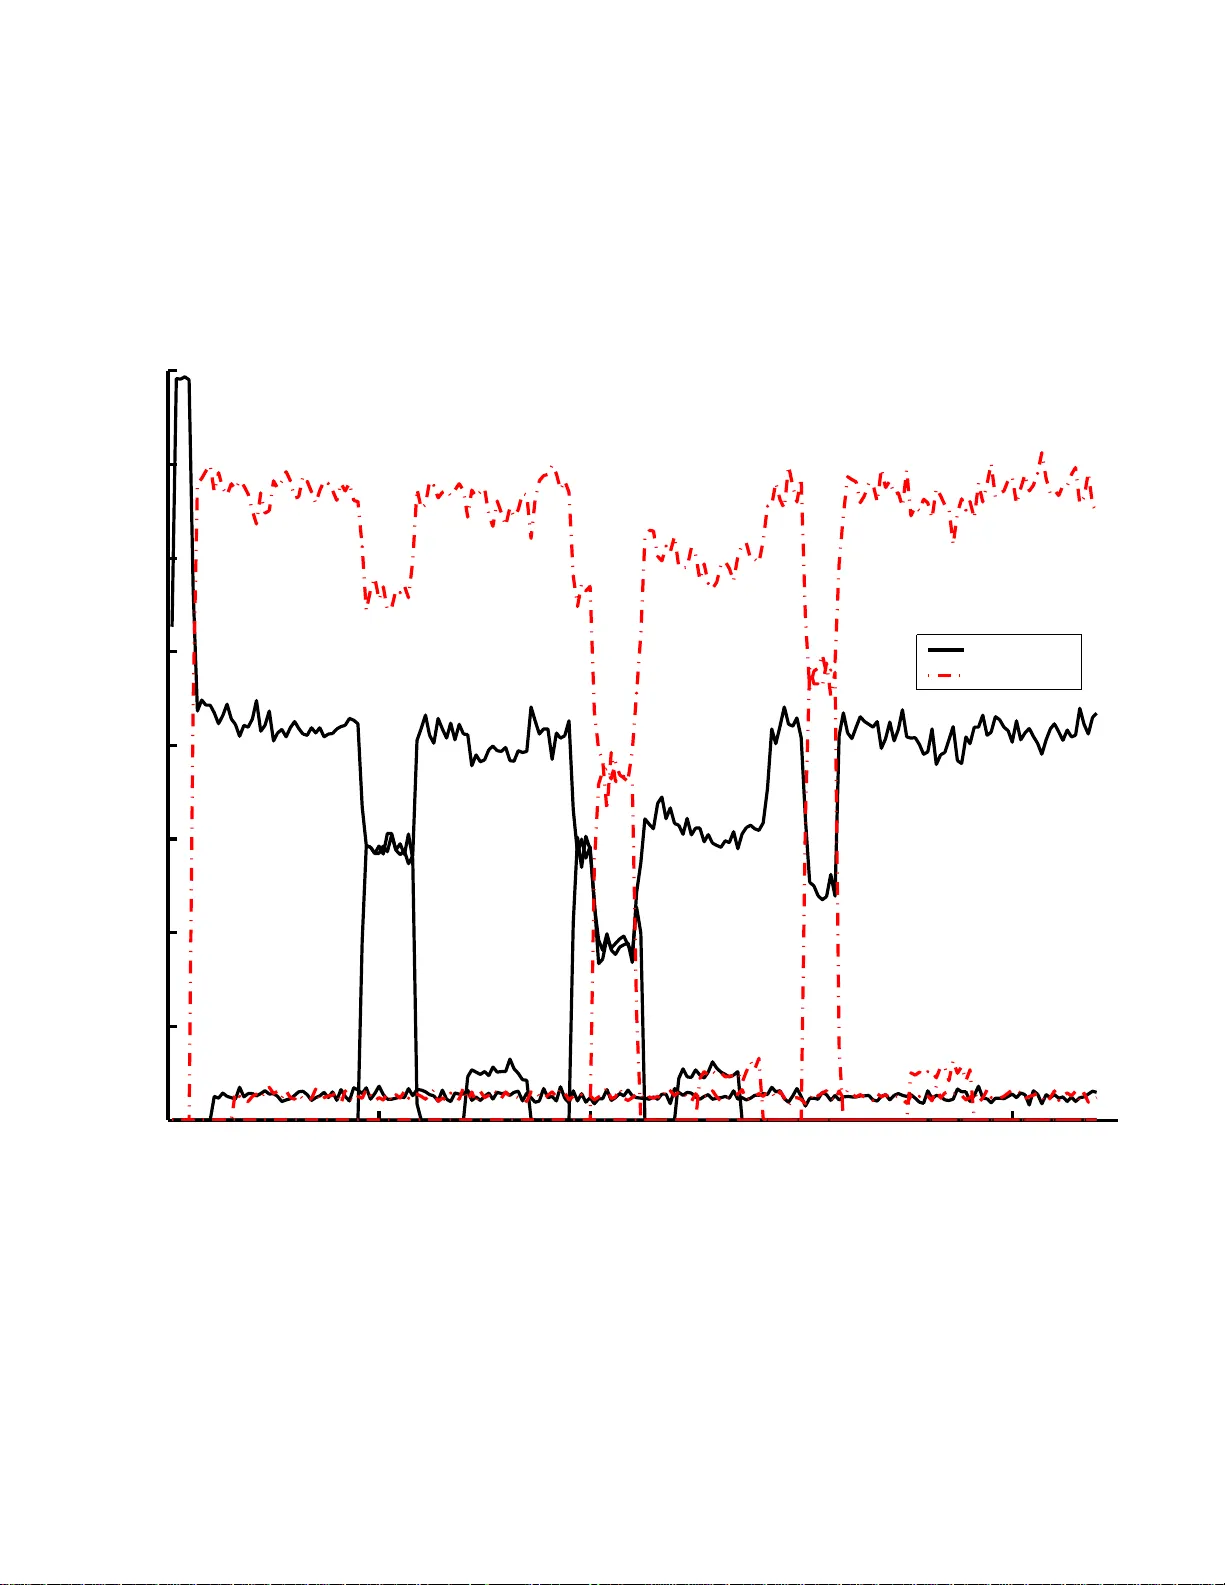
1 F air Access Pro visioning through Contention P aramet er Adaptation in the IEEE 802.11e Infrastructure Basic Service Set † Feyza Ke celi, Inanc Inan, and Ender A yanoglu Center for Perv asiv e Communi cations and Computing Department of Electrical Engineering and Comp uter Science The Henry Samueli School of Engineering Univ ersity of Californi a, Irvin e, 92 697-2625 Email: { fkeceli, iinan, ayanoglu } @uci .edu Abstract W e present the station-based unfair ac cess problem a mong the uplink and the downlink stations in the IEEE 802.1 1e infrastructure Basic Service Set (BSS) wh en the default settings of the Enhance d Distributed Channel Access (EDCA) parameter s are used. W e discuss how the transport layer p rotoco l character istics alleviate the unfairness p roblem . W e design a simp le, practical, and standard-co mpliant framework to be emp loyed at the Access Point (AP) fo r fair and efficient access pr ovisioning. A dynam ic measuremen t-based EDCA param eter adaptatio n block lies in the cor e of this framework. The pro posed framew ork is unique in the sense that it consider s th e characteristic d ifferences of T ransmission Contr ol Protoco l ( TCP) an d User Datag ram Protoco l (UDP) flows and the c oexistence of stations with varying bandwidth o r Quality-o f-Service (QoS) requiremen ts. V ia simulatio ns, we show that our solution provides short- an d lon g-term fair access for all stations in the uplink a nd downlink employing TCP a nd UDP flows with non-u niform packet rates in a wire d-wireless heterog eneous network. In the meantime, the Qo S requ irements of coexisting real-time flows are also maintained. I . I N T RO D U C T I O N The IEEE 802.11 W ireless Local Area Network (WLAN) is built around a Basic Service Set (BSS) [1]. While a number of st ations may gath er to form an independent BSS with no connectivity to the wired network, t he commo n depl oyment is t he infrastructure BSS whi ch includes an Access Point (AP). In the latter case, the AP provides the connection to the wired network. † This work is supported by the Center for Perva siv e Communications and Computing, and by National S cience Foundation under Grant No. 0434928. Any opinions, findings, and conc lusions or r ecommendation s expressed in this material are t hose of authors and do not necessarily reflect the vie w of the Nati onal S cience Foundation . 2 The IEEE 802.11 standard [1] defines Distributed Coordination Function (DCF) as a cont ention-based Medium Access Control (MA C) m echanism. Th e 802.11e standard [2] updates t he MA C l ayer of the former 802.11 standard for Quality-of-Service (QoS) provisioning. In particular , the Enhanced Distributed Channel Access (EDCA) function of 80 2.11e is a QoS enhancement of the DCF . The EDCA scheme (similarly to DCF) uses Carrier Sense Multiple Access with Collisi on A voidance (CSMA/CA) and slot ted Binary Exponential Backoff (BEB) mechanism as the basic access m ethod. The majo r enhancement to support QoS is that EDCA differentiates pack ets us ing different priorities and maps them t o specific Access Categories (A Cs) that use separate queues at a station. Each A C i within a station ( 0 ≤ i ≤ 3 ) contends for the channel independent ly of the others. Lev els of services are provided through diffe rent assignments o f t he A C-specific EDCA parameters; Cont ention W indow (CW) s izes, Arbitratio n Interframe Space (AIFS) values, and T ransmit Opportunity (TXOP) limits. Both the D CF and t he EDCA are defined such that each s tation in a BSS uses th e same cont ention parameter set. Therefore, f air access can be achie ved i n the MA C layer for all t he contending statio ns i n terms of the a verage number of granted acce ss opport unities, o ver a suf ficiently long interv al. Ho we ver , this does not translate i nto achieving a fair share of bandwidth between uplink and do wnlink stations 1 in the infrastructure BSS. An approximately equal number of acce sses that an uplink A C may get is shared among all downlink flows in the sam e AC of the AP . This l eads to the u plink/downlink unfairness probl em where each individual downlink st ation gets comparably lower bandwidth than each in dividual uplink station gets at t he application layer . As it will be described in detail in Section II-A, the transport layer protocol characteristics alleviate this MA C layer originated unfairness prob lem significantly , especially when bi- directional reliable comm unication is em ployed and/or flows with varying bandwidth requirements coexist. W e propose a no vel frame work which mainly consists of a m easurement-based EDCA parameter adaptation block. In the proposed frame work, the AP measures the n etwork activity during periodic adaptation intervals. Then, the EDCA parameter adaptati on block emp loys the measurement resul ts to dynamically adapt th e EDCA parameters i n order to provide W eighted Fair Access (WF A) between the uplink and the d ownlink s tations. W e present a simulation -based analysis s howing the importance o f the EDCA parameter selection of low priorit y A Cs on the performance of hi gh priority A Cs (mainly on A Cs using realti me flows with 1 In this paper , we consider the scenarios where a station only runs uplink flows or do wnli nk fl o ws. Therefore, each station can be named as an uplink station or a downlink station. The same labeling holds for ACs as well.W e choose to present this generalization in order to keep the discussion easy t o understand. 3 Quality-of-Service requi rements). As our analysis s hows, a joi nt CW and TX OP adaptatio n not only provides fair access b ut als o does not degrade the QoS su pport for higher priority A Cs. A key insig ht of this st udy is that ou r s olution consid ers t he effe cts of d iffe rent transport layer protocols on the design of the frame work for fair access p rovisioning. User Datagram Protocol (UDP) and T ransmission Control Protocol (TCP) are the most widel y used transport l ayer protocols. UDP employs one-way commun ication. As a result, the UDP flo ws are nonrespons iv e and do not react to network congestion. As we sho w , the proposed WF A scheme requires an add itional rate allocation block fo r fair UDP access in a scenario consis ting of stations with dif ferent bandwidt h requirements. Con versely , TCP defines reliable bi-directional communication where th e backward link provides t he necessary feedback for effic ient rate allocation in the forward l ink. Althoug h WF A is directly applicable, we show that there is a simple extension of WF A for TCP , nam ely Extra Priorit ized Downlink Access (EPD A). The proposed EPD A scheme implicitly makes use of the TCP b eing bi-di rectional and the 802.11e MA C being fair i n the uplink in order to resolve the unfair access problem. W e show that the propo sed frame work provides short- and long-term st ation-based weighted fair access both in the uplink and downlink for a wide range of s cenarios. In the meantime, t he QoS requi rements of coexisting real-time flo ws are main tained. The proposed scheme is full y com pliant with the 802.1 1e standard. It does not require an y changes at the stations or the higher layer p rotocols o f th e AP . The rest of the paper is organized as follows. W e describe t he unfair access problem and the related literature in Section II. W e also define how we quantify fair access for the practical scenario where the bandwidth requi rement of each statio n di f fers. In Section III, we carry out a simu lation-based analysi s in order to study th e side ef fects of the choi ce of b est-ef fort traffic EDCA parameters on QoS provisioning. W e describe the proposed frame work in Section IV. The performance ev aluation of th e propos ed scheme is the topic of Section V. Finally , we provide our concluding remarks in Section VI. I I . B AC K G RO U N D In this section, we first present the uplink/downlink unf airness problem in the IEEE 802.l1e infrastructure BSS. W e then provide a brief literature re view on the subj ect. Finally , we describe how we quantify the fair access for a practical scenario where st ations d emanding bandwidth lo wer and higher than a fair per -station channel capacity coe xist. 4 A. Pr obl em Definition In the 802.11e WLAN , a band width asy mmetry exists between contending upli nk and downlink stati ons within a sp ecific A C, since the A C-specific MA C layer contention parameters are all equal for the AP and the st ations. If N statio ns and an AP are always cont ending for the access to the wireless channel using the same A C, each host ends up having approx imately 1 / ( N + 1) share of t he t otal transmissions over a long t ime interval. Th is results in N/ ( N + 1 ) of t he transmis sions to be in t he uplin k, whi le only 1 / ( N + 1) of the transmi ssions to be in the downlink. Consequently , total bandwidt h is unfairly sh ared between i ndividual uplink and downlink stat ions, as st ated pre viously . The u nev en b andwidth share result s in downlink flows experiencing significantly lower th roughput and lar ger d elay . The congesti on at the AP may result in cons iderable packet l oss dependi ng on the size of i nterface buf fers. In the practical case of each downlink s tation having different bandwidth requirement s and s ource packet rate, the li mited b andwidth of the AP cannot ev en be shared in a fair m anner b etween t he d ownlink stations. As we will show via si mulations in the sequel, t he packets of a coexisting high-rate downlink flo w may domin ate th e AP MA C buf fer and the coexisting l ow-r ate downlink flows m ay suffe r ev en if t heir b andwidth requi rement is lower than the fair sh are of the AP bandwidth. T herefore, a sp ecific unfairness problem origi nates from t he nonuni form use of th e AP buf fer w hen the AP b andwidth is limit ed (compared t o the traf fic lo ad). The results may even b e more catastrophic in the case of TCP flows. The TCP recei ver returns TCP A CK packets to the TC P transmi tter in order to confirm the successful reception of data pack ets. In the case of m ultiple upl ink and do wnlink st ations in the WLAN, returning TCP A CKs of upstream TCP data are queued at the AP togeth er wit h the downstream TCP data. Wh en t he b andwidth asymmetry in the forward and reverse path builds up the q ueue in the AP , the dropped packets impair t he TCP flow and congest ion control m echanisms w hich assume equal transmissi on rate both in the forward and re verse path [3]. TCP’ s timeout mechanism initiates a retransmissi on of a data packet if it h as not been acknowledged du ring a timeout duratio n. When the packet loss i s s e vere in the AP buf fer , downstream flows wil l experience frequent timeouts resulting in significantly low throughput. On the other hand, any received TCP A CK can cumulatively acknowledge all the data packets sent before the data packet the A CK i s intended for . Therefore, upstream flo ws with large con gestion windows will not probably experience such frequent timeouts. In this case, it is a low probabil ity that many consecutive TCP AC K los ses occur for the same flo w . Con versely , flows with small congestion wind ow (fe wer packets currently on flight) may experience 5 frequent timeouts and decrease their congestio n win dows e ven more (note the no nuniform use of the AP buf fer in t his case as well). Therefore, a n umber of upli nk stati ons may starve in terms of throughput while others enj oy a high throu ghput. This results in unfairness between individual up link stati ons on top of t he unfairness between the u plink and the d ownlink. In order to illust rate these unfairness condit ions, we carried out ns -2 sim ulations [4],[5] employing the default EDCA algorithm in the infrastructure BSS. W e randomly picked a scenario consisti ng of 12 uplink and 12 downlink stations. W e repeat t he experiments for the cases when all the connection s employ i) UDP and ii) TCP . Each connection i s i nitiated between a separate wireless statio n and a separate wired stat ion where AP is th e gateway between the WLAN and the wired network. Other sim ulation parameters are as stated in Section V. The results are provided on the left hand side of Fig. 1 (denoted as Default). Each empty colum n i n Fig. 1 represents the offered traffi c load for the specific connecti on. T he colum ns are filled up to the l e vel of the a verage through put that an individual statio n gets. Th ese results illust rate, when default EDCA is used, i) there exists throughput unfairness between the uplink and the d ownlink stations, ii) do wnlink UDP stations suf fer from bandwidth e ven if they have a lo wer bandwidt h requirement than the fair channel access capacity , ii i) there exists throughput unfairness am ong uplink TCP connections, and i v) data packe t losses at the AP buf fer alm ost shut do wn all downlink TCP connections. The results on t he right hand s ide sh ow the throughput ob tained when the prop osed alg orithm, WF A, is em ployed. The proposed frame work and t he simulation results will be described in Sections IV and V, respectively . B. Related W ork The st udies in the lit erature related to the unfair access p roblem dis cussed in this paper can be grouped into two. The first group employs queue management techniques, packet filtering schemes, or transport layer s olutions withou t any changes i n 802.1 1 MA C access parameters. The second group main ly propo ses parameter di f ferentiation between the AP and the stations to combat t he p roblem. The first group of studi es m ostly focuses on TCP . In [6], the effect of the AP buf fer size in the w ireless channel band width allocation for TCP is studied. The proposed solutio n of [6] is to manipu late advertised recei ver wi ndows of the TCP packets at the AP . In one of our pre vious works, we calculated the accurate advertised recei ver wind ows for efficient and fair TCP access for a generic WLAN s cenario [7]. The uplink/downlink fairness problem i s studied in [8] using per-flo w queueing. A si mplified approach is proposed in [9] where two s eparate queues for T CP d ata and A CKs are used. In another previous work, we proposed u sing congestion control and filtering techniques at the MA C layer to solve the TCP uplink 6 unfairness p roblem [10]. W e extended this technique for coexisting downlink and uplink flows in [11]. T wo queue management strategies are proposed in [12 ] to im prove T CP fairness. A rate-limiter operating on the uplin k traffic at the AP is proposed i n [13] to provide fair access for TCP . The use of si ze-based scheduling policies to enforce fairness among TCP connectio ns is proposed in [14]. The second group of studies focuses on solving the unfairness problem by content ion access parameter diffe rentiation. Di stributed algorithm s for achieving MA C layer fairness in 802.1 1 WLANs are proposed in [15], [16]. In [17], it is proposed that the AP access the channel after Point Int erframe Space (PIFS) completion without any backof f when the utilization ratio drops below a threshold. On the other hand, the access based on PIFS completion does not scale for the case when there are multipl e A Cs at the AP , i.e., 802.11e. Achieving weighted fairness between uplink and downlink in DCF is st udied through mean backof f distribution adjustm ent in [18]. A simulation -based analys is is carried out for a specific scenario consist ing of TCP and audi o flo ws both in the uplink and the do wnlink in [19] propo sing AIFS and CW dif ferentiation. As we sh ow in this paper , st icking with stat ic parameters may no t resolve the unfairness problem at an arbitrary traffic load e ven if the access for AP is prioritized. An experimental study is carried out in [20] propos ing mainly the use of TXOPs at the AP in order to combat TCP uplink and downlink unfairness. The us e of TXOP is ev al uated i n [21 ] for temporal fairness provisioning among stations employing diffe rent physical data rates. A m echanism that suggests i) T XOP tuning (based on downlink t raf fic load as in [20]) for preventing delay asymmetry of real-time uplink and downlink UDP flo ws and ii ) CW tuning for efficient channel utilization is proposed in [22]. In this paper , we s how that the load-based TXOP differentiation of [20] and [22] degrades QoS support for coexisting relatime flo ws when these schemes are empl oyed for fair best-effort data access provisioning . An adaptiv e priority control m echanism is employed in [23 ] t o balance the upl ink and do wnlink delay of V oIP traffic. Our work presented i n this paper falls into the second category . The key differences of o ur work from the pre vious studies are that our sol ution consid ers i ) di ff erent transport layer characteristics (for UDP and TCP), i i) varying application layer bandwidth requirements am ong stati ons (not ju st the asymptotical case of very high load), and iii ) varying network conditions over ti me (parameter adapt ation). W e als o carry out an extensive analysis on t he effects of EDCA parameter tuning performed at the A P on main taining QoS requirements of coexisting real-time flows. As we will show in Section III, the results va lidate our approach in this paper and in [24] for joint CW and TXOP adaptation . Note that the work presented in this paper extends our work in [24] by mainly considering the va rying application layer bandwidth 7 requirements amo ng stati ons. C. F airness Measur e Most of th e studies in the literature quantify the fairness by empl oying Jain’ s fairness index [25] or providing the ratio of the throughput achiev ed by i ndividual or all flo ws in the specific directions. On the other h and, such measures have the im plicit assumpt ion of each flo w or station demanding asym ptotically high bandwidth (i.e., i n saturation and having always a packet ready for transmiss ion). As these measures quantify , a perfectly fair access translates i nto each flow or station receiving an equal b andwidth. On the other hand, in a practical scenario of stations with finite and differe nt bandwi dth requirements (i.e., so me stations in no nsaturation and experiencing frequent idle ti mes wit h no packets to transmit), th ese m easures cannot directly be used to quant ify the fairness of the system. W e define the fair access in a scenario where stati ons wit h differ ent bandwidth requirement s as follows. • T he stati ons in nonsaturation either in th e uplink o r the downlink (i.e., with total bandwidt h require- ment lower than t he fair per-station channel capacity in the specific direction) receiv e the necessary bandwidth to serve their flo ws. Such stati ons are named as nonsaturated statio ns in the sequel. • T he stations in saturation either in the uplink or the downlink (i.e., wit h t otal bandwidth requirement higher than the fair per-station channel capacity in t he s pecific direction) receive an equal bandwidth. Such st ations are named as saturated station s in the sequel. In order to quantify fair access, we propose to use the MA C queue p acket loss rate for nonsaturated stations together wit h the comparison on channel access rate for satu rated stations . Note that the latter can employ Jain’ s fairness ind ex, f , which is defined in [25] as follows: if there are n concurrent saturated connections i n the network and the throughput achie ved by connection i is equal to x i , 1 ≤ i ≤ n , t hen f = ( P n i =1 x i ) 2 n P n i =1 x 2 i . (1) The fairness index lies between 0 and 1. Note that, in a fair scenario, ev ery s aturated station gets an equal th roughput (i.e., f = 1 ) and e very n onsaturated stati on achiev es a packet loss rate of 0 at th e MA C queue. I I I . E D C A P A R A M E T E R A N A L Y S I S The main motiv ati on behi nd the design of EDCA is providing a framew o rk where the medium access of coexisting flows can be priorit ized according to t heir appl ication layer traffic class. The main intent ion 8 is to provision QoS for real-time flows b y p rioritizing their access over b est-ef fort and b ackground traf fic. On th e other hand, as also shown in the literature, uplink/downlink unfairness problem can be combatted by the assig nment of A C-specific EDCA parameters with respect to the t raf fic direction inst ead of the traf fic class. In this section, we point out the fact t hat s pecial care must be taken in th e design of such frame work so that the QoS requirements of the coexisting real-time flo ws can be maintained (the main intention of QoS p rovisioning behind th e EDCA design is not jeopardized) 2 . The soluti on for resolvin g the upl ink/downlink unfairness problem using EDCA parameter d iffe renti- ation is p retty clear: Prioritize the access of th e giv en A C at the AP . Th is can s imply be achie ved by assigning the specific A C at the AP i ) a lower AIFS v alu e, ii) a lower CW , iii) a high er TXOP limit, or iv) any joi nt com bination of these, when compared to the assigned parameters of the specific up link A C. The challenge is to find the parameters that would provide w eighted channel access while preserving QoS demands of higher prio rity realtim e flows. Let’ s first briefly revie w the ef fects of E DCA parameter selection on the achiev abl e uplink/downlink throughput ratio within an A C. • E ach A C can either transm it or st art decrementing it s backof f coun ter if t he channel is detected to be idle for the duration of the A C-specific AIFS value [2]. This means that the access for A Cs with higher AIFS va lues are further delayed compared to the A Cs wit h lower AIFS values ev ery time t he channel becomes busy . At low channel lo ad, the effe ct o f AIFS on prioritization is not significant, since t he backoff countdown is not frequently interrupted by other transmiss ions. Con versely , at high channel load, AIFS prioritization b ecomes a significant factor . Every tim e t he channel is grabbed, thi s directly means a further delay on t he station s wi th lower priority (i.e., l ar ger AIFS) when compared to the stations wit h higher priority . • T he stations pick a b ackof f va lue uniformly d istributed between 0 and the current CW size and complete a backof f count down before transmission [2]. Upon g aining access to the medium , each A C may carry out multi ple frame exchange sequences as long as the total access duration does not go over it s TXOP limi t [2]. The channel access ratio between uplink and downlink within an A C var ies almost linearly with respect to t he selection of C W min 3 and T X O P values in asym ptotical 2 The 802.11e standard suggests the use of an admission control algorithm for QoS provision ing. In an ideal scenario, t he admission control algorithm pre vents the access of a real-time station if its admittance to the network can degrade the overall QoS. This also means that, in an ideal scenario, QoS is preserved, all real-time stations are nonsaturated, and unfairness problem does not exist for QoS stations. Therefore, in this paper , we consider the best-effo rt t raffic that no admission control is or can be applied. 3 As [2] defines, the initial value of AC-spe cific CW is C W min . At every retransmission the CW i s doubled, up to C W max . 9 conditions (saturation). Following our analytical calculation in [24], the approximate channel access ratio U i,u/i,d between uplink and d ownlink within A C i , namely A C i,u and A C i,d , can be calculated as U i,u/i,d ∼ = C W min,i,d N T X OP i,u C W min,i,u N T X OP i,d (2) when AI F S i,u = AI F S i,d and both di rections are saturated. Note that N T X OP i denotes th e m aximum number of packets that A C i can fit into o ne TXOP . Simply by us ing (2), we can calculate a set of C W min and T X O P values for A C i,d that would approximately achieve a predetermin ed throughpu t ratio U i,u/i,d for given C W min and T X O P va lues of A C i,u , and v ice versa. On th e other hand, the throughput ratio achieved by AIFS differe ntiation i s yet to be approximated via a simple linear relationsh ip as i t can be d one in (2) for CW and TXOP . Therefore, in t his work, we cons ider joi nt CW and TXOP differe ntiation in p rovisioning weighted fair access. AIFS diffe rentiation is only used between A Cs to provide priorit ization between realtime and best -ef fort flows. W e carried out a simulation-based analysi s to further analyze the ef fects of CW and TXOP dif ferentiation on bo th fair access and QoS provisioning. W e consider a scenario with t wo active A Cs. For both A Cs, we use a traffic model wit h Poisson packet arri vals. The transport layer protocol i s UDP for bot h A Cs. W e use 1 1 Mbps 802.11b PHY and assume that t he wi reless channel is errorless. The high priority traf fic uses A C 3 with EDCA parameters AI F S = 2 , C W min = 7 , C W max = 15 , T X O P = 1 . 504 ms both at the AP and the stations (as suggested in [2]). W e consid er 5 upl ink and 5 downlink high priority flows generated at 250 kbps. W e int entionally do not satu rate the high priority A C, so that the lower priority A Cs do not starve and the effects of CW and TXOP selection can b e observed. This also correspon ds to a practical scenario si nce the traffi c l oad should b e well controlled and an admissio n control algorithm should keep the high priori ty A C nonsatu rated to support parameterized QoS [26], [27]. The low priority A C is considered t o be serving best-ef fort traf fic. W e set the traf fic load s o high that the low prority A C is saturated b oth at the stati ons and t he AP . Thi s i s also a valid assum ption to analyze the worst-case scenario, since no admiss ion cont rol is applied for best -ef fort traf fic category in practice. W e consider four different cases in assi gning the EDCA parameters of t he AP and the stations for the low p riority t raf fic. • Default: Both t he AP and the stati ons use the same p arameters which are t entativ ely set as AI F S = 3 , C W min = 31 , C W max = 511 , T X O P = 0 . 10 • T XOP differ entiation: T he AP is assigned a TXOP regarding the t otal number of downlink flo ws n d , i.e., T X O P = n d · T exc , where T exc is the ti me required to complete a data frame exchange (includ ing MA C/PHY overhead). Not e that this is similar to the approach proposed in [20], [22]. • CW d iffe rentiation: The AP is assigned a smaller C W min = 7 . The stations are assigned a C W min regarding th e to tal num ber of do wnlink flows C W min = 7 · n d . • J oint CW and TXOP adaptation: W e employ our joint adaptation approach, WF A, as propos ed in this p aper in the sequel. Note that in the last t hree cases, the parameters are set s o that a utilization ration of 1 between uplink and d ownlink can be app roximately achieved. Fig. 2 and Fig. 3 s how the f airness in dex and the total through put for the best-ef fort A C, respectively . Fig. 4 and Fig. 5 show the average delay and the a verage jit ter experienced by QoS flo w s for i ncreasing number of l ow p riority uplink and downlink station s, respectively . W e can extract the following insight s from the presented simulation-based analysis. • As sh own in Fig. 2, stati c CW and TXOP differentiation cannot maintain fair access as a result of the fact that the channel access ratio as calculat ed by (2) is only an approxi mation. The design of an analytical model which captures all network d etails in order to calculate th e exact parameters is hard and complex. Dy namic adaptatio n as proposed in this paper simply preserves weig hted fair access. • As shown in Fig. 3, when compared to the default case, both TXOP dif ferentiation and CW differ - entiation improve channel utilization. In th e former case, channel contention overhead is decreased by the use of TXOP . In t he lat ter case, the stations are assigned larger C W min values s o t hat the collision ove rhead is decreased while the downlink enjoys a higher channel access rate with the assigned sm aller C W min value. • As shown i n Fig. 4, as t he num ber of best -ef fort flows increases, em ploying TXOP differentiation at the AP for low priority t raf fic jeopardizes the Qo S of high priority flows (the average del ay in creases exponentially). If a packet belonging to a QoS flow arri ves wh ile the channel is b usy because o f a best-eff ort transmission, the QoS packet has to wait a long time until the transmis sion is completed. On t he other hand, in the case of CW d iff erentiation, when best-effort flows access the channel, t hey hold the channel for a much shorter du ration at ev ery access whi ch means a smaller access overhead for th e QoS stations. • A s maller CW selectio n at the AP for l ow priority flows does not degrade QoS o f higher priority 11 flo ws in the same order of TXOP differentiation. In the specific scenario, the downlink best-effort flo ws use the sam e C W min as the QoS flo ws are assigned. The differentiation i s st ill maintained via diffe rent AIFS va lues. Moreover , the access frequency for the stations are decreased since they use lar ger CW values (compared to the default EDCA and TXOP di f ferentiation cases). Con versely , the total throughpu t for the best -ef fort traffic in creases (due t o lower collision overhead) and the QoS stations experience a low packet delay . • A similar di scussion as for delay hol ds on t he jitter of QoS flows as per the results presented in Fig. 5. Fig. 6-9 sh ow the results when best-effort flows empl oy TCP . As can be seen from Fig. 7-9, s imilar discussions on the comparison hold for throug hput of the best ef fort flows, delay and j itter experienced by QoS flows. Howe ver , as shown in Fig. 6, b oth TXOP differentiation and CW differentiation provide fair access among TCP flows (differ ent than UDP). These schemes impl icitly make use of the results of capture ef fect in fair access provisioning. As a result of capture ef fect, the EDCA parameters settings fa vors the do wnlink access in bo th CW dif ferentiation and TXOP di f ferentiation. As the resul ts present, while this causes unfair access between up link and downlink UDP flows, fair medium access is s till maintained among T CP flows (when TCP does not employ the delayed A CK mechanism). The reasoning behind this behavior is actually wh at m otiv ates t he design of propos ed EPD A algorithm in the sequel and will be described in detail i n Section IV -E. Similar discus sions hold when the station s use 5 4 M bps 802. 11g PHY layer as presented in Fig. 1 0-17. This analysis mo tiv ates the jo int use of CW and TXOP dif ferentiation for efficient and fa ir medi um access. A mu ltiple packet exchange in a TXOP im proves chann el utili zation by decreasing contention overhea d. On the oth er hand, as our analys is i mplies, the TXO P limi t assigned should not go over a threshold for concurrent fair access and QoS p rovisioning. Altho ugh we provide the resul ts for the proposed WF A scheme in Fig. 2 - 4, we provide the discussion on WF A performance in Section V after the frame work is described i n Section IV. I V . A F R A M E WO R K F O R F A I R A C C E S S P R OV I S I O N I N G An EDCA parameter adaptation block lies in the core of the proposed framew ork. The adaptation block employs the basic idea of prioritizing the access of the AP so that the uplink/downlink unfairness problem can be resolved. The adaptati on block empl oys a novel joint CW and TXOP diffe rentiation scheme in order to provide weighted fair access wit hin an A C whi le p reserving QoS of coexisting realti me flows. 12 The proposed EDCA parameter adaptati on procedure has two main ph ases; i) n etwork activity m ea- surement durin g an adaptation in terva l and ii) d ynamic parameter adaptation. As previously stated, we design t his scheme for W eighted Fair Access provisio ning, therefore name as WF A. A. Network Activi ty Measur ement during an Adaptation Interval The AP measures the network activity for β beacon intervals whi ch we define as an adaptati on interval. At the end of each adaptation interval, the EDCA parameters are adapted rega rding measurement results as d escribed in the sequel. During th e adaptati on int erv al, th e AP scans for t he u nique sou rce and desti nation MA C addresses observed both in the uplink and the downlink to estimate the number of active uplink and downlink stati ons, n u and n d , respectively . For each station i n the downlink, it uses exponential moving aver aging 4 in order to calculate th e av erage number of packets recei ved for transmiss ion and the number o f packets successfull y transmitted duri ng an adaptation int erva l. For each station in the upl ink, it also uses exponential m oving a veraging in order to calculate the a verage number of packets successfull y recei ved in the wireless link (i.e., the a verage n umber of packets an up link statio n transmi ts successful ly) during an adaptati on int erv al. B. Dynamic P arameter Ada ptation If a new stati on is detected to be starting transmissio n or an existi ng stati on is detected to b e conclu ding transmissio n i n th e last adaptation interva l, in the dyn amic parameter adaptation ph ase, mainl y an EDCA parameter decision procedure is completed employing simple and approximate analytical calculations. Otherwise, the dynamic parameter adaptation phase handl es the fine tu ning on the C W min and T X O P values. Our m otiv ati on behind distinguis hing these two cases is to im prove the con ver gence rate of the parameter tu ning (e.g., in case an abrupt change is needed in ED CA parameters due to sev eral flo w s starting/sto pping t ransmission in the last adaptatio n interval). A go od initi al guess also enables carrying out the tun ing on the parameters in smaller steps (i.e., fine tuning) which enhances the stability of the parameter adaptati on. a) P a rameter Decision : In a saturated scenario, a good guess on the appropriate EDCA parameter settings that would approxim ately achiev e a predetermined channel access ratio between uplink and downlink can be made using t he t otal num ber of do wnlink st ations [24]. 4 The formula for calculating an exponential moving average is x t = δ y t − 1 + (1 − δ ) x t − 1 , where y t is the observ ati on during the last time interv al ( t − 1 , t ) , x t is the movin g average for all observation s until at time t , and δ i s the constant smoothing factor (0 ≤ δ ≤ 1) . 13 In this p aper , we improve our previous work [24] by releasing the assumption of every station being in s aturation. As described in Section II-C, a fair scenario with each station having an equal weight in terms of m edium access corresponds to nonsaturated stati ons being served wi th no packet l osses at the MA C queue and the satu rated stati ons sharing the rest of the bandwi dth equally . In such a case, the ratio of the to tal fair b andwidth of the AP t o the total fair bandw idth of a saturated st ation for the specific A C cannot be determined di rectly from the total number of stations. W e introduce the concept of effective number of downlink statio ns using A C i , e i,d , in order to quanti fy this ratio app roximately . The value of e i,d corresponds to an approximate number of s aturated station s that would cons ume an approximately equal b andwidth as t he AP consumes in a fair s cenario. Due to characteristic differences of UDP and TCP , the calculation for e i,d is transpo rt protocol dependent as will be described individually in Sections IV -C and IV -D . Let U i be the tar get utilization ratio between saturated uplink and downlink stations using A C i 5 . Then, in case a change in n u or n d is detected, we m ake the p arameter decisio n as follows. • Us ing th e linear relationship in (2), a set of possible C W min,i values for the AP is calcul ated u sing C W min,i,d = C W min,i,u · N T X O P i,u e i,d · U i · N T X O P i,d (3) for varying N T X O P i,d values from 1 t o a thresho ld, N T X O P ,thr esh . Note t hat C W min,i,u and T X O P i,u are used as t hey were assigned in the pre vious adaptation interva l 6 . • T he calculated C W min,i values that are not integers are rou nded to the closest integer value. W e hav e quantified the ef fect of rounding on uplink /downlink access ratio and have defined a simple extension of t he BEB algorithm which can be employed for non-integer CW v alues in [28]. In this paper , we opt out using t his extension. • T he decision on the C W min,i - T X O P i pair is made by ens uring that C W min of a low priority A C (at the AP or a station) is not small er than C W min of any higher priority A C. If any C W min - T X O P pair does not satisfy this simple prioritization rule, we double C W min,i (and therefore C W max,i ) of the statio n, and complete ano ther round of calculation t o decide on a new set. Thi s process continues until a decision is made. Although the results in this paper are presented for th e cases which prefer the pair with the N T X O P i,d value is at least 2 (for decreased content ion overhead) and C W min,i,u 5 Note that we define a t arget utilizati on ratio between saturated uplink and down link stations. In a fair scenario, the nonsaturated stations recei ve the bandwidth they demand and are not subject to any weight. 6 C W min,i and T X OP i of the stations are initialized to the valu es suggested in [2] in the very first adaptation phase. 14 is at m ost θ = 4 ti mes the d efault C W min,i,u suggested in [2] (for preventing ve ry large C W min,i,u assignments so that the stati ons do not suffer from bandwidth), the performance di f ference is observed to be m ar ginal for other selection schemes (preferring the pair wit h N T X O P i,d = N T X O P ,thr esh , random selection, etc.). Every beacon interv al, the AP announces the values of the A C-specific ED CA parameters to the stat ions. The stations overwrite their EDCA parameter setti ngs with the new values i f any change is detected. Du e to the specific d esign of the EDCA Parameter Set element in the beacon packet, t he st ations can only employ C W values that are int eger powers of 2, i.e., the AP encodes the corresponding 4-bit fields of C W min and C W max in an exponent form. The proposed method initializes CW parameters of the s tations to default values and us es exponents of 2 if an increase is needed. Therefore, it is compliant to the standard. A key point which t he studies in the lit erature hav e not considered is that the CW settings of the A Cs at the AP are not restricted to the powers of 2. The p roposed scheme releases this restriction being employed at the AP in the studies in the li terature [22]. The absence of this restricti on provides flexibility o n weighted fair access provisio ning, where t he AP uses any CW value i n order t o achie ve an arbitrary up link/downlink uti lization ratio. b) P a rameter T uning : Let U i,m be the measured utilization ratio during th e last adaptation interval and U i,r be t he requi red ut ilization ratio between upli nk and do wnlink saturated stations using AC i . T he parameter tu ning is done as follows ( 0 ≤ γ ≤ α ≤ 1 , χ hig h > 0 , and χ low > 0 ) 7 . • If U i,m < (1 − γ ) U i,r , t hen C W min,i,d is decreased by χ hig h . • If U i,m < (1 − α ) U i,r , then C W min,i,d is decreased by χ low . • If U i,m > (1 − γ ) U i,r , t hen C W min,i,d is increased by χ hig h . • If U i,m > (1 − α ) U i,r , then C W min,i,d is increased by χ low . • Ot herwise, no action is taken. Employing th e previously stated pri oritization rule, if CW min,i,d gets smal ler than the CW of an A C that is higher pri ority , we can take two alternati ve actions . • Do uble bot h CW min,i,u and CW min,i,d . • Do uble bot h CW min,i,d and T XOP i,d (if and only if ne w N T X O P i,d < N T X O P i,thr esh ). Note that both of these actions are expected to maintain the channel access ratio approximately at the same l e vel since the ratio in (2) can be preserved. In the simulations presented in this paper , we prefer 7 Note that χ high and χ low can take any va lue since C W min,i,d is not restricted to be an exponent of 2. 15 the former unless CW min,i,u is θ = 4 tim es the default CW min,i,u suggested i n [2]. W e observed that the performance diff ers m ar ginally ev en wh en another scheme is em ployed such as θ is assi gned anot her value or the latter of t he t wo alternative actions is preferred. As shown in Section II-A, t he i nteractions of the transport layer prot ocol and the 80 2.11 medium access layer protocol play an important rol e in how the channel access o pportunities are shared between the contending st ations. The m ost ef fecti ve difference is that while UDP uses one-way unreliable com- munication, TCP defines a backward A CK li nk for rate allocatio n and reliable data deliv ery . Lea ving the core of the fair access provisionin g algorit hm as described previously in this section, our desi gn consid ers these charac teristic diffe rences by introducing addit ional functi onal blocks as necessary . C. WF A fo r UDP 1) Effective num ber of downlink UDP stations: The effecti ve number of downlink UDP st ations mainl y depends on the num ber of saturated and nonsaturated downlink stat ions. T herefore, the AP needs to figure out the state of each station (i.e., whether it is saturated or nonsatu rated). The AP measures th e to tal channel capacity for A C i , C i , in terms of total average nu mber of successful transmissi ons duri ng an adaptation interval (using exponential aver aging over successiv e adaptation intervals). Th en, the algorith m we use i n estimating th e effecti ve num ber of downlink UDP stations is as follo ws. 1) The in itial per-station fair channel access capacity is calculated as C f ,i = C i /n i where n i is the to tal number of activ e uplink and downlink stations us ing A C i (whether sat urated or nonsaturated). 2) The saturated stations i n the u plink achie ve an approx imately equal channel access rate as they are employing the same set of EDCA p arameters. Therefore, the uplink statio ns that achiev e an ave rage channel access rate wit hin a range of the highest measured p er -station channel access rate are l abeled as s aturated. 3) W e l abel each unlabeled stati on as runn ing in saturation or no nsaturation based on th e fa ir channel capacity C f ,i . A downlink (uplink) stati on is labeled saturated if its measured packet arri val rate t o the AP from the wired l ink (from the wi reless link) i s h igher than C f ,i . All remaining st ations are labeled nonsaturated. 4) Since the nons aturated st ations require lower bandwidth th an C f ,i , the per-station chann el capacity for satu rated st ations can be recalculated as C f ,i = C i − C i,nonsat n i,sat (4) 16 where C i,nonsat is the to tal channel capacity needed for serving nonsaturated st ations using A C i and n i,sat is the number of stations labeled as saturated. 5) The l abeling procedure in step 3 is repeated. If the previous label of at l east one station i s changed in step 3, the iteratio ns contin ue. Otherwise, the most recent calculated C f ,i is an estimat ion on the per -station fa ir share for saturated stat ions. Then, the ef fectiv e number of downlink UDP stations using A C i , e i,d , can simply be calculated as e i,d = C i,non sat,d + n i,sat,d · C f ,i C f ,i . (5) where C i,nonsat,d is the total channel capacity needed for serving non saturated do wnlink stations using A C i and n i,sat,d is the number of downlink stati ons labeled as saturated. 2) F ai r Rat e Allocation (FRA): As previously described in Section II-A, if saturated and nonsaturated downlink st ations coexist, non saturated statio ns suffer from signi ficant packet losses although th ey require a bandwidth s maller than t he per-station fair channel access capacity . Even when the uplink/downlink fairness problem is resolved via the p roposed EDCA parameter adaptati on scheme, t his probl em persits if there is at least one sat urated station in th e downlink. W e in troduce an FRA block on top of the AP MA C queue whi ch is essentially a packet filter (or a token bucket filt er). If a downlink st ation is detected to be consuming bandwidth hig her than the fair channel access rate C f ,i , the packets arriving at the rate higher than the fair access rate are dropped from the queue. This o pens up the buf fer sp ace for n onsaturated stations which can achie ve their demanded bandw idth. The packet drop probabilit y p d,i,j for saturated downlink station j us ing A C i is calculated simply as follows. p d,i,j = A i,j − C f ,i A i,j (6) where A i,j is the a verage packet arriv al rate for th e corresponding downlink st ation. Note that p d,i,j adapts to C f ,i changes as a result of EDCA parameter adaptation. The UDP results presented in th is paper for th e propos ed WF A scheme employs t he proposed FRA block at the AP . D. WF A for TCP 1) Effective n umber of downlink TCP stations: As TCP d ata rate i n the forward lin k depends o n TCP A CK rate in the backward l ink and is adjusted according to network congesti on, i t is hard to est imate 17 whether a T CP flow is saturated or no t at the AP . Therefore, t he m easurement-based est imation algorit hm in Section IV -C.1 may not always be applicable. As the TCP A CK traffic of upli nk stations t ra verses the AP in downlink, the downlink TCP bandwi dth also depends on t he number of upli nk TCP stations. Let e very b TCP data be acknowledged with one TCP A CK 8 . T hen, define η i,d = n i,d + n i,u b . (7) As we h a ve also confirmed via simulat ions, if we di rectly employ (7) in (3) directly as the number of ef fectiv e downlink stations, the i nitial parameter g uess is usually far from t he correct parameter setti ng that would provide weighted fair access in scenarios nons aturated stations exist. This is because th e effe ctive number of T CP stations as calculated by (7) implici tly assumes that every stati on to be saturated. This makes parameter tuning phase unstable and con ver g e in a longer duration. T o improve th e stabil ity of p arameter tunin g, we linearly normalize η i,d according to the m ost recent contention parameters and t he corresponding measured num ber of flo ws (as denoted with superscript p in (8)) in the calculati on of the effecti ve number of downlink TCP flows. e i,d = C W p min,i,u · η i,d C W p min,i,d · η p i,d (8) As it can be seen by emp loying (8) in (3), setti ng e i,d as in (8) enables the us e of the already con ver ged contention parameters as a basis for calculating the ne w parameters. As also obs erved via simu lations, thi s approach improves th e con ver g ence p roperties of parameter tuning for TCP (or in a generic case when it is hard to classify stations as saturated and nonsaturated). E. Extra Prioritiz ed Downlink Access (EPD A) for TCP W e also propose an alternativ e and practical solution for TCP fairness provisioning: Provide the AP Extra Prioritized Downlink Access (EPD A) op portunity , so that the corresponding A C queues of the TCP flo ws always remain nonsaturated at the AP . Th e reasoning behind this novel idea is t wo-fold; i) this a voids the TCP packet drops at the AP whi ch is t he main cause for unfairness as shown in Section II-A, and i i) such an approach makes the fairness provisioning rely only on the u plink access and 802 .11 MA C is fair to all competing uplink stations (given that t here are no packet losses at the AP). Note that alt hough this can result in m aking the non-AP stations saturated, no b uffer overflo w is actuall y observed d ue to 8 A typical value for b is 2. When b > 1 , i t is called delayed TCP A CK mechanism. 18 our practical assum ption t hat TCP congestio n win dows are set regarding the a vailable buf fer space at t he TCP senders and receiver s. As th e slow li nk limits th e th roughput for all TCP stations (in thi s case, the slow l ink is the upstream data link for uplink TCP stations and t he ups tream T CP A CK l ink for downlink TCP stati ons) and 802.1 1 MA C provides fair access to all uplin k stations, upl ink/downlink unfair access problem can simply be resolved. When the delayed TCP A CK mechanism is used, the proposed EPD A schem e priorit izes the downlink stations over uplink stati ons. As pre viously mention ed, the up stream access is fairly d istributed among upstream data link of upl ink statio ns and the upstream TCP A CK l ink of downlink st ations. On the other hand, ever y one upstream TCP A CK stands for b dat a packets. Since the AP queues are nonsat urated, the saturated downlink TCP stations enjoy b times higher data packet transmiss ions th an th e saturated uplink stations can transm it over a suf ficientl y lo ng interval. Therefore, the channel u tilization ratio U in EPD A is determin ed by TCP data-to-ack ratio, b . Note that in an 802.11e infrastructure BSS, it is highly probable that the downlink load wil l be s ignificantly h igher than the uplink load. Therefore, m aintaining a downlink to uplink access ratio U > 1 can als o be practical. The EDCA parameter adaptation block uses the queue size as an i ndication for dynamically adapting the parameters in EPD A scheme. Therefore, the dyn amic parameter tuning rul es diffe r from WF A and is as fol lows. • If a verage AP queue size in an adaptati on interval is larger t han a t hreshold value, q thr esh , then C W min,i,d is decreased by χ low . • If a verage AP queue size stays under th e threshold value, q thr esh , then C W min,i,d is increased by χ low . • Ot herwise, no action is taken. In s imulations , we observed that doubling t he E DCA TXOP (the v alue calculated in the parameter decision p hase) for the specific A C at the AP is suffic ient to enable t he proposed EPD A scheme. Altho ugh we used l ar ger EDCA TX OP size in t he simu lations presented in this paper , using smaller CW v al ues is also applicable. Note that the EDCA parameter settings for t he EPD A s cheme is also up to the previously stated rules that need to be emp loyed in order to maint ain dif ferentiation amon g different AC s and QoS support for real-time st ations. 19 V . S I M U L A T I O N R E S U L T S W e carried out sim ulations in ns-2 [4],[5] in order t o e valuate the performance of the p roposed algorithms. W e cons ider a network topology where each wi reless statio n initiates a connection with a wired station and the traffic i s relayed to/from the wired network through the AP . The data connections use either U DP or TCP Ne wReno. The UD P connections employ the traffic mo del w ith exponentially distributed packet int erarri val tim es. The TCP traffic either uses a File T ransfer Protocol (FTP) agent , which models bulk data transfer or a T elnet agent, which simulates the behaviour of a user with a termin al emulator or web bro wser . In the e xperiments, saturated TCP s tations employ FTP and nonsaturated TCP stations use T elnet agents. Unless otherwise stated, the flows are considered to be lasting the s imulation duration. In some experiments, short flows are used which sim ulate a fixed size data transfer and lea ve the system after all the data is transferred. The def ault TCP NewReno parameters in ns-2 are used. The U DP and TCP flows are mapped to AC 1 and A C 0 , respectiv ely , where the initi al EDCA parameters are AI F S 0 = AI F S 1 = 3 , C W min, 0 = C W min, 1 = 31 , C W max, 0 = C W max, 1 = 511 , T X O P 0 = T X O P 1 = 0 . These access parameters are selected arbitrarily (the un fairness problem exists regardless of the selection if AP and the st ations use equal va lues). All t he stations are assumed to h a ve 8 02.11g PHY using 54 Mbps and 6 Mbps as the d ata and basic rate respectiv ely [29] whi le wired link data rate is 1 00 M bps. The packet size is 1500 bytes for all flows. The buf fer size at the stations and the AP is set to 100 packets per A C. The receiv er advertised congestion window li mits are set to 42 packets for each flow . Note that t he s cale on the buff er s ize and TCP cong estion window limit are inherited from [6]. Althoug h th e current practical l imits may be lar ger for congest ion windows and smaller for buf fer sizes, the unf airness problem e xists as long as the ratio of buff er size to congest ion wi ndow l imit is not arbitrarily large (which is not the case in practice). The beacon i nterval is 100 ms. W e found β = 10 , α = 0 . 05 , γ = 0 . 25 , χ hig h = 5 , and χ low = 1 to be appropriate t hrough extensive simulatio ns. W ireless channel is assumed to be an Addi tiv e White Gaussian Noi se (A WGN) channel. On t op of the ener gy-based PHY m odel of ns-2, we implemented a BER-based PHY m odel according t o t he framew ork presented in [30] using the way of realization in [31]. Our model considers th e channel n oise power i n Signal-to-Noise Ratio (SNR) [5]. A packet is detected at th e receiver if the recei ved power is ov er a specified threshold. Then, the packet error probabilit y is calculated u sing the theoretical model presented in [30] re garding the channel SNR, t he modul ation type used for the t ransmission of t he packet, and the packet size. If a randoml y drawn number is hig her than the calculated probabil ity , the packet is assumed 20 to be receive d correctly , otherwis e the packet is labelled as erroneously decoded, and discarded. W e set wireless channel noise levels such that each station experiences a finite packet error rate (PER). W e repeat the tests for the A WGN channel SNR values when PER i s 0%, 0.1% or 1% for UDP and TCP data packets. W e set the required ut ilization ratio U i,r = 1 as i n all of t he previous studies i n t he literature. a) Scenario 1 - Pr oblem Definition: W e repeated the same set of experiments as d escribed for the default case in Section II-A. As t he resul ts on the right hand side of Fig. 1 show , WF A provides fair access for both UDP and TCP in the case of coexisting flows wit h dif ferent bandwidth requirements . F itting perfectly to t he fair access definition i n Section II-C, the nons aturated stations achieve th e bandwidth th ey demand, whi le the saturated s tations achieve an equal b andwidth for both UDP and TCP scenarios. b) Scenario 2 - V arying Number of Flows ov er T ime / Adaptation Stabili ty: W e tested th e performance of WF A and EPD A when the nu mber of active stations v ary over tim e. The experiments are repeated for the cases when all the stations either employ UDP or TCP wit hout delayed A CKs. The p resented results are for the errorless channel. Fig. 18 shows t he instantaneou s through put of each UDP station achieves wi th respect to t ime. Initially , there are 2 upli nk and 2 downlink stati ons, one in each direction has a p acket rate of 10 Mbps, and t he other has a packet rate of 0.5 Mbps . Over the course of the s imulation , 4 uplink and 4 downlink stations (with packet rates of either 20 Mbps or 1 M bps) i nitiate connection s at diff erent t imes, stay active for 1 5 seconds, and lea ve the system. As the results present, fair access is always maintained when t he number of activ e connections vary over time. Every ti me a saturated UDP uplink or downlink stat ion joins the network, th e bandwidth is fairly sh ared. The nonsaturated uplink and downlink statio ns do not su f fer from scarce b andwidth (while they coexist with s aturated s tations). Fig. 19 and Fig. 20 show the resul ts wh en statio ns use TCP , and WF A and EPD A is empl oyed, respectiv ely . Initially , there are 2 upli nk and 2 downlink stations, one in each direction employs an FTP agent and the other empl oys a T elnet agent with a p acket rate of 0.5 Mbps. Over time, 4 upli nk and 4 downlink stations (FTP or T elnet) initi ate connection s at diff erent t imes. FTP stations leav e the system after a tot al of 6000 packets are transferred (which approxim ately lasts around 15 seconds for the specific scenario). T eln et stations have a packet rate of 1 Mb ps and leave after 15 seconds. As t he result s p resent, fair share of the bandwidth is alwa ys m aintained am ong TCP stations. W e present the results for t he same scenarios i n Fig. 21 and Fig. 22 when the delayed TCP AC K mech- anism is enabl ed. WF A can maintain fair access between uplink and downlink as the EDCA parameters 21 are adapted accordingly . On the other hand , as previously m entioned in Section IV -E, downlink access is fa vored in EPD A due to the use of delayed TCP A CKs. In EPD A, the AP has prioritized access and is no more the b ottleneck. The upstream access is fairly distributed among upstream data li nk of u plink stations and the upstream TCP A CK link of do wnlink stations. As every one upstream T CP A CK stands for b = 2 data packets in the specific scenario, do wnlink stations enjoy a comparably higher bandwidth. EPD A resolves the critical unfairness problem (In Default scenario, ju st a few upload flo ws can sus tain high throughput as discussed in Section II-A). The weight between the uplin k and th e downlink d epends on the TCP data-to-ack ratio. Fig. 23-27 show the instantaneous C W min and N T X O P values used at the AP and the st ations over the course of simulati on for the same s cenarios as described above . Note that the parameter adaptation block selects the initial TXOP v alues to be equal to 2 · T exc in the downlink and 0 in t he upl ink 9 . As the result s show , the parameter adaptatio n is stable and con verges pretty qu ickly in all s cenarios. As the flo ws start or sto p, we see bumps in assigned EDCA parameters (parameter decisi on p hase). If needed fine tuning further adapts parameters at the end of following adaptati on intervals. The sim ulation resul ts show no unstable behavior in the dynam ic adaptation of parameters over a wide range of s cenarios. c) Scenar io 3 - Incre asing Number of Stations: W e tested the performance of WF A for increasing number of station s when al l the st ations ha ve i) UDP or ii ) TCP connections. W e also report t he performance of EPD A for the case o f TCP . For the specific scenario, half of the UDP st ations in each direction generate pack ets at 10 Mbps and the other half has different packet rates selected betw een 150 Kbps and 550 Kbps (as in Scenario 1). For TCP , half of the st ations u se t he FTP agent, while the other half us e the T elnet agent with packet rates between 150 Kbps and 550 Kbps. Unless otherwise st ated, TCP recei vers employ the delayed T CP AC K mechanism. Fig. 28 and Fig . 2 9 compares the p erformance in terms of fair access and total throughput for default EDCA and WF A for i ncreasing number of UDP st ations in each direction, respectively . In, Fig. 28, the right y-axis denotes the fairness index, f , among the saturated st ations, while the left y-axis denotes the a verage Pack et Loss Rate (PLR) for nonsaturated stations. As the results present, the proposed WF A scheme can provide fa ir access (i .e., f = 1 and P LR = 0 ) irrespective of the number of station s. As Fig. 29 shows, high channel utilization is also m aintained. W e repeated th e same scenario for TCP stations. Fig. 30 and Fig. 31 compare the performance in 9 A TXOP duration equal to 0 means that the specific AC can only transmit 1 packet per channel access [2]. 22 terms of fair access and total throughp ut for default EDCA, WF A, and EPD A for increasing number of TCP stations in each direction, respectively . Both WF A and EPD A schemes resol ve the u plink/downlink unfairness probl em. As described in Section IV -E, the downlink achieves higher channel access share in EPD A when TCP delayed A CK schem e is used. That’ s why the fairness index is f = 0 . 9 for EPD A. The sam e set of experiments are repeated when PER is set t o 0.1 % and 1% in the wireless channel. Fig. 32-39 present the corresponding resul ts. The ef fects of wireless channel errors are marginal on the average throughput and fairness performance as t he M A C le vel retransmissi ons efficiently com bats wireless channel losses. The discussion on the performance comparison of default EDCA, WF A, and EPD A remains simi lar ev en when the wireless is no t error-fre e. When TCP receivers do not empl oy delayed TCP A CK mechanism , both WF A and EDP A provides fair uplink and d ownlink access as presented in Fig. 40. The performance comparison for the same scenario is provided in Fig. 41. d) Scenario 4 - Short Fl ows: W e tested the performance of WF A and EPD A in case short TCP connections are made when there are ong oing bulk TCP transfers bot h in the u plink and downlink. In this specific scenario, we h a ve 15 upl ink and 15 downlink TCP stations where 1 0 of them in both directions generate short TCP con nections at arbit rarily selected tim es. E ach short TCP connection has a to tal of 30 packets to s end and leav e the system when the transaction is comp leted. Th e remaining 5 connections in each direction last for the who le s imulation duration. Fig. 42 shows the tot al transmi ssion duration for in dividual short TCP connections for the default EDCA, th e propo sed WF A, and EPD A schemes. Note that flo w indices from 1 to 10 represent uplink TCP conn ections whil e flow indices from 11 t o 20 represent do wnlink TCP connections. The short file transfers can be completed in a considerably shorter tim e compared to default EDCA when the proposed frame work i s used. Al though not explicitly presented, most of the downlink short TCP con nections experience connection timeouts and even cannot com plete the whol e 30 packet transaction wit hin t he simulatio n duration when the default algorith m is used. As expected, EPD A o utperforms WF A b y av oiding comparably lon ger packet delays at the AP buf fer . These results also indicate that t he p roposed schemes are short-term fair . e) Scenar io 5 - Coexisting Realti me Fl ows: The sp ecific s imulation scenario is previously described in Section III. The av erage delay th at realtim e connections experience are ev aluated in Fig. 4. The results clearly i ndicate that as t he numb er of best -ef fort flows increases, fair access can be achieved at the expense 23 of a sign ificant degradation of Qo S support for high priority flows i f on ly TXOP differentiation is used. Note that this i dea is employed in [20],[22]. Am ong the compared schemes, WF A is the only one that provides fair access together wit h hig h channel uti lization and marginal degradations on QoS provisioning. f) Scenario 6 - V arying Number of Fl ows among S tations: W e t ested the performance of the prop osed algorithms when there are v arying number o f i) UDP or ii) TCP connections at an upl ink or a downlink station. In this specific scenario, we assume all the best effort flows to be i n satu rated state. W e repeated the tests for different nu mber of stations in the network wh ere one t hird of t he s tations ha ve 1 connection, the ot her one t hird of the stations hav e 2 conn ections and th e remainin g stations have 3 connections. The total nu mber of uplink and downlink st ations is equal. Fig. 43 shows the fairness index amon g per-station access bandwitdh when the best-eff ort flows em ploy UDP . Sim ilarly , Fig . 44 shows the fairness index among st ations for TCP (when the delayed A CK mechanism is disabled). As the results clearly p resent, the proposed m ethods provide perfect fairness independently of the number of acti ve flows at a statio n. Fig. 45 and Fig. 46 show the total t hroughput of the stations when t he best ef fort flo ws use UDP and TCP , respectively . As it can be seen from Fig . 45, the proposed WF A algorithm achiev es a higher throughput than the default algorit hm as a result o f higher T XOP values used at the AP and high er CW values at ST As (fewer collisions occur when the num ber of stations increases). Howe ver , this is not the case for TCP flo ws, as only a fe w flo ws sh are the whole bandwidth in the default scenario (all of the downlink TCP flows and some of the up link TCP flows are totally shut down due to the reasons as describ ed in Section II-A), they can increase their congestion windows comparably to l ar ger values on the ave rage (hi gher t hroughput) and there are fe wer stations contending for access (fewer col lisions). Although the def ault scheme may obt ain a higher bandwi dth ut ilization than the proposed algorit hms, i t still fails to provision fair access as s hown i n Fig. 44. g) Scenario 7 - V ar ying TCP Congestion W indows: In this scenario, we g enerate TCP connections with receiver advertised congesti on window sizes of 12, 20, 42, or 84. W e var y th e number of FTP connections from 4 to 24 and the wired link delay from 0 to 50 ms. For each scenario, the number of flo ws usin g a s pecific cong estion window size is uniformly di stributed among the connections (i.e., when there are 12 uplo ad and 12 download TCP flows, 3 of the upload/download TCP con nections use the congestion wi ndow size W , where W is selected from the s et S = 12 , 20 , 42 , 8 4 ). T he wireless channel is assumed t o be errorless. The TCP delayed A CK mechanism is enabled. 24 Fig. 47 shows t he fairness index among all connections. W e compare the default DCF results with the results o btained when th e AP employs the proposed WF A scheme. As t he results im ply , wi th the introduction of the proposed control bl ock at t he AP , a better fair resource all ocation can b e achiev ed. Howe ver , a perfect fairness i s not observed w hen the link delay is higher and the num ber of flo ws is lower . In these cases, the bandwidth-delay prod uct is larger than t he receiver advertised TCP congestion window size for connections with small congestion wi ndows. As a result, the t hroughput is li mited by the congestion window itself, not by the network bandwidth. In Fig. 48, we plot the total TCP throughput . The proposed WF A scheme can main tain high channel utilization. h) Scenario 8 - Smaller AP Buffer Size: W e repeated the experiments of Scenario 3 when AP has a buf fer size 20 packets. The wi reless channel is errorless. The delayed TCP A CK mechanism is enabled. Fig. 49 - Fig. 52 present show the result s. Wh en the AP b uffer is smaller , the WF A scheme result s in 5% PER for n onsaturated UDP flo ws as can be seen from Fig. 4 9. Such l osses are i nevitable when the buf fer size is too small . Sti ll, the performance improvement in terms of fair access over the default DCF is very significant. As the other results imply , other performance improvements are i ndependent of th e AP buf fer size and simil ar discussions hol d. V I . C O N C L U S I O N The work presented in thi s paper u ses the idea of direction-based traf fic differe ntiation in order to resolve t he uplink/ downlink unfair access problem in the 802.11e infrastructure BSS. W e carried out a simulatio n-based analysis which showed that joint CW and TXOP dif ferentiation is effecti ve in fair and ef ficient channel access provisio ning with m arginal degradation on QoS su pport. This result is empl oyed in a novel measurement-based d ynamic EDCA parameter adaptati on algorit hm, namely WF A, t hat can provide a predetermined utili zation ratio between up link and downlink stations of the s ame A C while keeping the prioritization among A Cs. The p roposed WF A scheme is uniqu e in the s ense t hat its desig n considers i) dif ferent transport layer protocol characteristics (for UDP and T CP), ii ) the coexistence of station s with dif ferent band width re- quirements (additional rate allocati on block for UDP), i ii) v arying network conditio ns o ver time (parameter adaptation). Alth ough WF A is directly applicable for TCP , we sh owed that there is a simpler extension of WF A, namely EPD A. The EPD A scheme im plicitly m akes use of th e TCP being bi-directional and the 802.11e M A C being fair in the upl ink in order to resolve the unfair access problem. 25 Through extensive s imulation s, w e showed that the propos ed framew ork provides s hort- and long-term station-based weighted fair access and efficient channel util ization for a wide range of s cenarios. The QoS support for coexisting realtim e connections is maintained at the same lev el (as of default EDCA). The proposed framework is s tandard-compliant. R E F E R E N C E S [1] I EEE Standar d 802.11: W ireless L AN medium access contr ol ( MAC) and physical layer (P HY) specifications , IEEE 802.11 Std., 1999. [2] I EEE Standar d 802.11: W ireless LA N medium access contr ol ( MAC) and physical layer (PHY) specifications: Medium access contr ol (MAC) Quality of Service (QoS) Enhancements , IE EE 802.11e St d., 2005. [3] H . Balakrishnan, V . Padmanab han, and R. H. Katz, “The Effects of Asymmetry on TCP Performance, ” ACM Baltzer Mobile N etworks and Applications (MONET) , 1999. [4] ( 2006) The Network Simulator , ns-2. [Online]. A vailable: http://www .isi.edu/nsnam/ns [5] I EEE 802.11e HCF MA C model for ns-2.28. [Online]. A v ailable: http://newport.eecs.uci.edu/ ∼ fkeceli/ns.htm [6] S . Pil osof, R. Ramjee, D. Raz, Y . S havitt, and P . S inha, “Understanding TCP Fairness ov er Wireless LA N, ” in Pr oc. IEEE Infocom ’03 , April 2003. [7] F . Kece li, I. Inan, and E. A yanoglu, “Fair and Efficient TCP Access in IEEE 802.11 WLANs, ” in IEE E WCNC ’08, Las V e gas, Nevada, USA , March 2008. [8] Y . W u, Z. Niu, and J. Zheng, “Study of the TCP Upstream/Down stream Unfairness Issue with Per-flow Queueing ov er Infrastructure- mode WLANs, ” W ire less Commun. and Mobile Comp. , pp. 459–471, June 2005. [9] J. Ha and C.-H. Choi, “TCP Fairness f or Uplink and Down link Flows i n WLANs, ” in Pr oc. IEEE Globecom ’06 , Nov ember 2006. [10] F . Keceli, I . Inan, and E. A yanoglu, “TCP A CK Congestion Control and Filtering for Fairness Provision in the Uplink of IEEE 802.11 Infrastructure Basic Service Set, ” in Pro c. IEEE ICC ’07 , June 2007. [11] —— , “Achie ving Fair T CP Access in the IEEE 802.11 Infrastructure Basic Service Set, ” in IEEE ICC ’08, Beijing, China , May 2008. [12] M. Gong, Q. W u, and C. Williamson, “Queue Managemen t Strategies to Improv e TCP Fairness in IE EE 802,11 Wireless L ANs, ” in Pr oc. IEEE W iOpt ’06 , April 2006. [13] N. B lefari-Melazzi, A. Detti, I. Habib, A. Ordine, and S. Salsano, “TCP Fairness Issues in IEEE 802.11 Networks: Problem Analysis and Solutions Based on Rate Control, ” IEEE T rans. W ir eless Commun. , pp. 1346–13 55, April 2007. [14] G. Urvoy-K eller and A. -L. Beylot, “Improving Fl o w-lev el Fairness and Interactivity in WLANs using Size-based Scheduling Policies, ” Institut Eurocom, Sophia-Antipolis, T ech. Rep. RR-07-206, Novembe r 2007. [15] N. H . V aidya, P . Bahl, and S. Gupta, “Distributed Fair S cheduling i n a Wireless L AN, ” in Pr oc. ACM Mobicom ’00 , August 2000. [16] T . Nandagop al, T . Kim, X. Gao, and V . Bharghav an, “Achie ving MA C Layer Fairness in Wireless Packet Networks, ” in Pr oc. ACM Mobicom ’00 , August 2000. [17] S . W . Kim, B.- S. Kim, and Y . Fang, “Do wnlink and Uplink Resource Allocation i n IEEE 802.11 Wireless L ANs, ” IEEE T rans. V eh. T echnol. , pp. 320–32 7, January 2005. [18] J. Jeong, S. Choi, and C.-K. Kim, “Achieving W eighted Fairness between Uplink and Downlink in IEEE 802.11 DCF -based WLANs, ” in Pro c. IEEE QSHINE ’05 , August 2005. [19] C. Casetti and C. F . Chiasserini, “Improving Fairness and Throughpu t for V oice Traf fi c in 802.11e EDCA, ” in Proc. IEEE PIMRC ’04 , September 2004. 26 [20] D. J. Leit h, P . Cli ffo rd, D. Malone, and A. Ng, “TCP Fairness in 802.11e WLANs, ” IEE E Commun. Lett . , pp. 964–966, Novem ber 2005. [21] I. T innirello and S. Choi, “Efficiency Analysis of Burst Transmissions wit h Block A CK in Contention-Based 802.11e WL ANs, ” in Pr oc. IEEE ICC ’05 , May 2005. [22] J. F reitag, N. L. S . da Fonseca, and J. F . de Rezende, “T uning of 802.11e Network Parameters, ” IE EE Commun. Lett. , pp. 611–613 , August 2006. [23] S . Shin and H. Schulzrinne, “Balancing Upli nk and Downlink Delay of V oIP T raf fic in WLANs using Adaptiv e Priority Control (AP C), ” in Pro c. IEEE QSHINE ’06 , August 2006. [24] F . Keceli, I. Inan, and E. A yanoglu, “W eighted Fair Uplink/Downlink A ccess Provisioning in IEE E 802.11e W LANs, ” in I EEE I CC ’08, Beijing, China , May 2008. [25] R. Jain, The Art of Computer Systems P erformance Analysis: T echniques for Experimental Design, Measur ement, Simulation, and Modeling . John W iley and Sons, 1991. [26] H. Zhai, X. Chen, and Y . Fang, “How W ell Can the IE EE 802.11 W ireless LAN S upport Quality of Service?” IEEE Tr ans. W ireless Commun. , pp. 3084–30 94, Novemb er 2005. [27] I. Inan, F . K eceli, and E. A yanoglu, “Multimedia Capacity Analysis of the IEEE 802.11e Contention-based I nfrastructure Basic Service Set, ” ArXiV cs.IT/ 0707.2836, July 2007. [Online]. A v ailable: arxiv .org [28] F . Kece li, I. Inan, and E. A yanoglu, “Fairness Provision i n the IEEE 802.11e Basic S ervice Set, ” ArXiV cs.OH/ 0704.1842, April 2007. [Online]. A v ailable: arxiv .org [29] IE EE Standar d 802.11: W ir eless LAN m edium access contr ol (MA C) and physical layer (PHY ) specifications: Further Higher Data Rate Extension in the 2.4 GHz Band , IEEE 802.11g Std., 2003. [30] D. Qijao and S . Choi, “Goodput Enhancement of IEEE 802.11a Wireless L AN via Link Adaptation, ” in Pro c. IEEE ICC ’01 , June 2001. [31] M. Lacage. (2006) Ns-2 802.11 Support. INRIA Sophia Antipolis. France. [Online]. A v ailable: http://spoutnik.inria.fr/code/ns- 2 27 UDP_up UDP_down TCP_up TCP_down UDP_up UDP_down TCP_up TCP_down 0 0.5 1 1.5 2 2.5 3 3.5 4 Throughput (Mbps) Default WFA Fig. 1. Indi vidual throughput of 12 uplink UDP (UDP up), 12 do wnlink UDP (UDP down),or 12 uplink T CP (TCP up) and 12 downlink TCP (TCP do wn) when the default EDCA or the proposed WF A scheme is employed at the AP (Scenario 1 in Section V). 28 5 10 15 20 25 0.55 0.6 0.65 0.7 0.75 0.8 0.85 0.9 0.95 1 Number of flows at each direction Fairness Index ( f ) Default TXOP diff. CW diff. WFA Fig. 2. Fairness index f for UDP data traffic when there are 5 uplink and 5 downlink realtime flows using 11 Mbps 802.11b P HY (Scenario 5 in Section V). 29 5 10 15 20 25 3.5 4 4.5 5 Number of flows at each direction Total Throughput (Mbps) Default TXOP diff. CW diff. WFA Fig. 3. T otal throughput of all UDP flows using 11 Mbps 802.11b PHY (Scenario 5 in Section V). 30 5 10 15 20 25 0 10 20 30 40 50 60 70 Number of flows at each direction Ave Delay (ms) Default TXOP diff. CW diff. WFA Fig. 4. A verage delay for realtime flows when there i s UDP data traffic using 11 Mbps 802.11b PHY (S cenario 5 in Section V). 31 5 10 15 20 25 2 4 6 8 10 12 14 16 18 20 Number of flows at each direction Jitter (ms) Default TXOP diff. CW diff. WFA Fig. 5. A verage jitt er for realtime flows when t here is UDP data traffic using 11 Mbps 802.11b P HY (Scenario 5 in Section V). 32 5 10 15 20 25 0.2 0.3 0.4 0.5 0.6 0.7 0.8 0.9 1 Number of flows at each direction Fairness Index ( f ) Default TXOP diff. CW diff. WFA Fig. 6. Fairness index f for TCP data traffic when there are 5 uplink and 5 do wnlink realtime flows using 11 Mbps 802.11b PHY (Scenario 5 in Section V). 33 5 10 15 20 25 3 3.5 4 4.5 Number of flows at each direction Total Throughput (Mbps) Default TXOP diff. CW diff. WFA Fig. 7. T otal throughput of all TCP flows when there are 5 uplink and 5 do wnlink realtime fl o ws using 11 Mbps 802.11b PHY (Scenario 5 in Section V). 34 5 10 15 20 25 0 5 10 15 20 25 Number of flows at each direction Ave Delay (ms) Default TXOP diff. CW diff. WFA Fig. 8. A verage delay for realtime flows when t here i s TCP data traffic using 11 Mbps 802.11b P HY (Scenario 5 in Section V). 35 5 10 15 20 25 2 4 6 8 10 12 14 16 Number of flows at each direction Jitter (ms) Default TXOP diff. CW diff. WFA Fig. 9. A verage jitt er for realtime flows when there is TCP data traffic using 11 Mbps 802.11b PHY (Scenario 5 in Section V). 36 5 10 15 20 25 0.55 0.6 0.65 0.7 0.75 0.8 0.85 0.9 0.95 1 Number of flows at each direction Fairness Index ( f ) Default TXOP diff. CW diff. WFA Fig. 10. Fairness index f for UDP data tr af fic when there are 5 uplink and 5 do wnli nk realtime flows using 54 Mbps 802.11g PHY (Scenario 5 in Section V). 37 5 10 15 20 25 15 16 17 18 19 20 21 Number of flows at each direction Total Throughput (Mbps) Default TXOP diff. CW diff. WFA Fig. 11. T otal throughpu t of all UDP flows using 54 Mbps 802.11g P HY (Scenario 5 in Section V). 38 5 10 15 20 25 0 2 4 6 8 10 12 Number of flows at each direction Ave Delay (ms) Default TXOP diff. CW diff. WFA Fig. 12. A verage delay for realtime flows when there is UDP data traffic using 54 Mbps 802.11g PHY (Scenario 5 in Section V). 39 5 10 15 20 25 0.5 1 1.5 2 2.5 3 3.5 4 4.5 5 Number of flows at each direction Jitter (ms) Default TXOP diff. CW diff. WFA Fig. 13. A verage jitter for realti me fl ows when there is UDP data traffic using 54 Mbps 802.11g PHY (Scenario 5 in Section V). 40 5 10 15 20 25 0.3 0.4 0.5 0.6 0.7 0.8 0.9 1 Number of flows at each direction Fairness Index ( f ) Default TXOP diff. CW diff. WFA Fig. 14. Fairness index f for TCP data traffic when there are 5 uplink and 5 downlink realtime fl ows using 54 Mbps 802.11g PHY (S cenario 5 in Section V). 41 5 10 15 20 25 12 13 14 15 16 17 18 19 Number of flows at each direction Total Throughput (Mbps) Default TXOP diff. CW diff. WFA Fig. 15. T otal throughput of all TCP flows when t here are 5 uplink and 5 do wnlink r ealtime flows using 54 Mbps 802.11g PHY (Scenario 5 in Section V). 42 5 10 15 20 25 0.5 1 1.5 2 2.5 3 3.5 4 4.5 5 5.5 Number of flows at each direction Ave Delay (ms) Default TXOP diff. CW diff. WFA Fig. 16. A verage delay for realtime flows when there is TCP data traffic using 54 Mbps 802.11g P HY (Scenario 5 in Section V). 43 5 10 15 20 25 0 0.5 1 1.5 2 2.5 3 3.5 Number of flows at each direction Jitter (ms) Default TXOP diff. CW diff. WFA Fig. 17. A verage jitter for realtime flows when there is TCP data traffic using 54 Mbps 802.11g P HY (S cenario 5 i n Section V). 44 0 50 100 150 200 0 5 10 15 20 25 Time (s) Throughput (Mbps) Uplink Downlink Fig. 18. The instantaneous UDP throughput of individu al uplink and do wnlink stations for WF A (S cenario 2 in Section V) . 45 0 50 100 150 200 0 2 4 6 8 10 12 14 16 Time (s) Throughput (Mbps) Uplink Downlink Fig. 19. T he instantaneous TCP throughpu t of individua l uplink and downlink stations for WF A (Scenario 2 in Section V). 46 0 50 100 150 200 0 2 4 6 8 10 12 14 16 Time (s) Throughput (Mbps) Uplink Downlink Fig. 20. T he instantaneous TCP throughput of individ ual uplink and do wnlink stations for EPDA (Scenario 2 in Section V). 47 0 50 100 150 200 0 2 4 6 8 10 12 14 16 Time (s) Throughput (Mbps) Uplink Downlink Fig. 21. T he instantaneous TCP throughpu t of individua l uplink and downlink stations for WF A when delayed A C K is enabled (Scenario 2 in Section V). 48 0 50 100 150 200 0 2 4 6 8 10 12 14 16 Time (s) Throughput (Mbps) Uplink Downlink Fig. 22. T he instantaneous TCP throughput of indi vidual uplink and downlink stations for EPDA when delayed A CK is enabled (Scenario 2 in Section V). 49 0 20 40 60 80 100 120 140 160 180 200 220 0 50 100 Time (s) Contention Window (CW) 0 20 40 60 80 100 120 140 160 180 200 220 1 2 3 0 20 40 60 80 100 120 140 160 180 200 220 0 1 2 TXOP AP UDP − WFA (CW) STA UDP − WFA (CW) AP UDP − WFA (TXOP) STA UDP − WFA (TXOP) Fig. 23. C W min and TXOP adaptations at the AP and t he stat ions for WF A when best effort flows use UDP (Scenario 2 in Section V). 50 0 20 40 60 80 100 120 140 160 180 200 220 0 50 100 150 Time (s) Contention Window (CW) 0 20 40 60 80 100 120 140 160 180 200 220 1 2 3 0 20 40 60 80 100 120 140 160 180 200 220 0 1 2 TXOP AP TCP − WFA (CW) STA TCP − WFA (CW) AP TCP − WFA (TXOP) STA TCP − WFA (TXOP) Fig. 24. C W min and TXOP adaptations at the AP and the stations for WF A when best effort flows use TCP (Scenario 2 in Section V). 51 0 20 40 60 80 100 120 140 160 180 200 220 0 50 100 150 Time (s) Contention Window (CW) 0 20 40 60 80 100 120 140 160 180 200 220 3 3.5 4 4.5 5 0 20 40 60 80 100 120 140 160 180 200 220 0 1 2 TXOP AP TCP − EPDA (CW) STA TCP − EPDA (CW) AP TCP − EPDA (TXOP) STA TCP − EPDA (TXOP) Fig. 25. C W min and TXOP adaptations at the AP and the stations for EPDA when best effort fl o ws use TCP (Scenario 2 in S ection V) . 52 0 20 40 60 80 100 120 140 160 180 200 220 0 50 100 150 Time (s) Contention Window (CW) 0 20 40 60 80 100 120 140 160 180 200 220 0 0.5 1 1.5 2 2.5 3 0 20 40 60 80 100 120 140 160 180 200 220 0 1 2 TXOP AP TCP − WFA (CW) STA TCP − WFA (CW) AP TCP − WFA (TXOP) STA TCP − WFA (TXOP) Fig. 26. C W min and TXOP adaptations at the A P and the stations for WF A when best effort flows use TCP with delayed A CK (S cenario 2 in Section V). 53 0 20 40 60 80 100 120 140 160 180 200 220 0 50 100 150 Time (s) Contention Window (CW) 0 20 40 60 80 100 120 140 160 180 200 220 3 3.5 4 4.5 5 0 20 40 60 80 100 120 140 160 180 200 220 0 1 2 TXOP AP TCP − EPDA (CW) STA TCP − EPDA (CW) AP TCP − EPDA (TXOP) STA TCP − EPDA (TXOP) Fig. 27. C W min and T XOP adaptations at the AP and t he stations for EPDA when best effort flows use TCP wit h delayed ACK (Scenario 2 in Section V). 54 4 6 8 10 12 14 16 18 20 22 24 0 0.1 0.2 0.3 0.4 0.5 0.6 0.7 0.8 0.9 1 Number of UDP flows at each direction Fairness Index ( f ) 4 6 8 10 12 14 16 18 20 22 24 0 0.1 0.2 0.3 0.4 0.5 4 6 8 10 12 14 16 18 20 22 24 0 0.1 0.2 0.3 0.4 0.5 PLR Default ( f ) WFA ( f ) Default (PLR) WFA (PLR) Fig. 28. Fairness i ndex f for saturated and Packet Loss R ate (P LR) for nonsaturated UDP stations when the default EDCA or W F A is employ ed w ith 0% PER at the wireless channel (Scenario 3 in Section V). 55 4 6 8 10 12 14 16 18 20 22 24 25.5 26 26.5 27 27.5 28 28.5 29 29.5 30 30.5 Number of UDP flows at each direction Total UDP Throughput (Mbps) Default WFA Fig. 29. T otal UDP throughput when the default ED CA or W F A is employed with 0% PER at the wirel ess channel (Scenario 3 in S ection V). 56 4 6 8 10 12 14 16 18 20 22 24 0 0.1 0.2 0.3 0.4 0.5 0.6 0.7 0.8 0.9 1 Number of TCP flows at each direction Fairness Index ( f ) 4 6 8 10 12 14 16 18 20 22 24 0 0.2 0.4 0.6 0.8 1 4 6 8 10 12 14 16 18 20 22 24 0 0.2 0.4 0.6 0.8 1 4 6 8 10 12 14 16 18 20 22 24 0 0.2 0.4 0.6 0.8 1 PLR Default ( f ) WFA ( f ) EPDA ( f ) Default (PLR) WFA (PLR) EPDA (PLR) Fig. 30. Fairness index f for saturated and Packet Loss Rate (PLR) for nonsaturated TC P stations when the default EDCA, WF A, or EPDA is employe d with 0% PER at the wireless channel (Scenario 3 in Section V) . 57 4 6 8 10 12 14 16 18 20 22 24 18 19 20 21 22 23 24 25 Number of TCP flows at each direction Total TCP Throughput (Mbps) Default WFA EPDA Fig. 31. T otal TCP throughput when the defau lt EDCA, WF A, or E PD A is employed wi th 0% PER at the wireless channel (Scenario 3 in Section V). 58 4 6 8 10 12 14 16 18 20 22 24 0 0.1 0.2 0.3 0.4 0.5 0.6 0.7 0.8 0.9 1 Number of UDP flows at each direction Fairness Index ( f ) 4 6 8 10 12 14 16 18 20 22 24 0 0.1 0.2 0.3 0.4 0.5 4 6 8 10 12 14 16 18 20 22 24 0 0.1 0.2 0.3 0.4 0.5 PLR Default ( f ) WFA ( f ) Default (PLR) WFA (PLR) Fig. 32. Fairness i ndex f for saturated and Packet Loss R ate (P LR) for nonsaturated UDP stations when the default EDCA or W F A is employ ed w ith 0.1% PER at the wireless channel (Scenario 3 in Section V). 59 4 6 8 10 12 14 16 18 20 22 24 25.5 26 26.5 27 27.5 28 28.5 29 29.5 30 30.5 Number of UDP flows at each direction Total UDP Throughput (Mbps) Default WFA Fig. 33. T otal UDP throughput when the default EDCA or WF A is employ ed with 0.1% PER at the wi reless channel (Scenario 3 in Section V). 60 4 6 8 10 12 14 16 18 20 22 24 0 0.1 0.2 0.3 0.4 0.5 0.6 0.7 0.8 0.9 1 Number of TCP flows at each direction Fairness Index ( f ) 4 6 8 10 12 14 16 18 20 22 24 0 0.2 0.4 0.6 0.8 1 4 6 8 10 12 14 16 18 20 22 24 0 0.2 0.4 0.6 0.8 1 4 6 8 10 12 14 16 18 20 22 24 0 0.2 0.4 0.6 0.8 1 PLR Default ( f ) WFA ( f ) EPDA ( f ) Default (PLR) WFA (PLR) EPDA (PLR) Fig. 34. Fairness index f for saturated and Packet Loss Rate (PLR) for nonsaturated TC P stations when the default EDCA, WF A, or EPDA is employe d with 0.1% PER at the wireless channel (Scenario 3 in Section V). 61 4 6 8 10 12 14 16 18 20 22 24 18 19 20 21 22 23 24 25 Number of TCP flows at each direction Total TCP Throughput (Mbps) Default WFA EPDA Fig. 35. T otal TCP throughput when the default EDCA, WF A, or E PD A i s employ ed w ith 0.1% PER at the wireless channel (Scenario 3 in Section V). 62 4 6 8 10 12 14 16 18 20 22 24 0.55 0.6 0.65 0.7 0.75 0.8 0.85 0.9 0.95 1 Number of UDP flows at each direction Fairness Index ( f ) 4 6 8 10 12 14 16 18 20 22 24 0 0.1 0.2 0.3 0.4 0.5 4 6 8 10 12 14 16 18 20 22 24 0 0.1 0.2 0.3 0.4 0.5 PLR Default ( f ) WFA ( f ) Default (PLR) WFA (PLR) Fig. 36. Fairness i ndex f for saturated and Packet Loss R ate (P LR) for nonsaturated UDP stations when the default EDCA or W F A is employ ed w ith 1% PER at the wireless channel (Scenario 3 in Section V). 63 4 6 8 10 12 14 16 18 20 22 24 25.5 26 26.5 27 27.5 28 28.5 29 29.5 30 Number of UDP flows at each direction Total UDP Throughput (Mbps) Default WFA Fig. 37. T otal UDP throughput when the default ED CA or W F A is employed with 1% PER at the wirel ess channel (Scenario 3 in S ection V). 64 4 6 8 10 12 14 16 18 20 22 24 0 0.1 0.2 0.3 0.4 0.5 0.6 0.7 0.8 0.9 1 Number of TCP flows at each direction Fairness Index ( f ) 4 6 8 10 12 14 16 18 20 22 24 0 0.2 0.4 0.6 0.8 1 4 6 8 10 12 14 16 18 20 22 24 0 0.2 0.4 0.6 0.8 1 4 6 8 10 12 14 16 18 20 22 24 0 0.2 0.4 0.6 0.8 1 PLR Default ( f ) WFA ( f ) EPDA ( f ) Default (PLR) WFA (PLR) EPDA (PLR) Fig. 38. Fairness index f for saturated and Packet Loss Rate (PLR) for nonsaturated TC P stations when the default EDCA, WF A, or EPDA is employe d with 1% PER at the wireless channel (Scenario 3 in Section V) . 65 4 6 8 10 12 14 16 18 20 22 24 15 16 17 18 19 20 21 22 23 24 25 Number of TCP flows at each direction Total TCP Throughput (Mbps) Default WFA EPDA Fig. 39. T otal TCP throughput when the defau lt EDCA, WF A, or E PD A is employed wi th 1% PER at the wireless channel (Scenario 3 in Section V). 66 4 6 8 10 12 14 16 18 20 22 24 0 0.1 0.2 0.3 0.4 0.5 0.6 0.7 0.8 0.9 1 Number of TCP flows at each direction Fairness Index ( f ) 4 6 8 10 12 14 16 18 20 22 24 0 0.2 0.4 0.6 0.8 1 4 6 8 10 12 14 16 18 20 22 24 0 0.2 0.4 0.6 0.8 1 4 6 8 10 12 14 16 18 20 22 24 0 0.2 0.4 0.6 0.8 1 PLR Default ( f ) WFA ( f ) EPDA ( f ) Default (PLR) WFA (PLR) EPDA (PLR) Fig. 40. Fairness index f for saturated and Packet Loss Rate (PLR) for nonsaturated TC P stations when the default EDCA, WF A, or EPDA is employe d with 0% PER at the wireless channel and delayed ACK mechanism is disabled (Scenario 3 in Section V). 67 4 6 8 10 12 14 16 18 20 22 24 18 19 20 21 22 23 24 25 Number of TCP flows at each direction Total TCP Throughput (Mbps) Default WFA EPDA Fig. 41. T otal TCP throughput when t he default E DCA, W F A, or EP D A is employed with 0% PER at the wireless channel and delayed A C K mechanism is disabled (Scenario 3 in Section V). 68 0 2 4 6 8 10 12 14 16 18 20 10 −1 10 0 10 1 10 2 Flow index Transmission duration (s) Default WFA EPDA Fig. 42. T he indi vidual transmission duration for short T CP connection s (Scenario 4 in Section V). 69 10 15 20 25 30 35 0.5 0.55 0.6 0.65 0.7 0.75 0.8 0.85 0.9 0.95 1 Number of UDP flows at each direction Fairness Index ( f ) Default WFA Fig. 43. Fairness index f for stations with 1, 2 or 3 UDP flows when the defau lt EDCA, or WF A is employed ( Scenario 6 in Section V). 70 10 15 20 25 30 35 0.2 0.3 0.4 0.5 0.6 0.7 0.8 0.9 1 Number of TCP flows at each direction Fairness Index ( f ) Default WFA EPDA Fig. 44. Fairness index f for stations with 1, 2 or 3 TCP flows when the default EDCA, W F A, or EPDA is employed (S cenario 6 in Section V). 71 10 15 20 25 30 35 24 25 26 27 28 29 30 Number of UDP flows at each direction Total UDP Throughput (Mbps) Default WFA Fig. 45. T otal throughput of UDP fl o ws when the default EDCA, or WF A is employed (Scenario 6 in Section V). 72 10 15 20 25 30 35 19 20 21 22 23 24 25 Number of TCP flows at each direction Total TCP Throughput (Mbps) Default WFA EPDA Fig. 46. T otal throughput of TCP flows when the default E DCA, WF A, or EPD A i s employ ed ( Scenario 6 in Section V). 73 4 6 8 10 12 14 16 18 20 22 24 0.1 0.2 0.3 0.4 0.5 0.6 0.7 0.8 0.9 1 Number of TCP flows at each direction Fairness Index ( f ) Default, LD=0ms Default, LD=15ms Default, LD=50ms WFA, LD=0ms WFA, LD=15ms WFA, LD=50ms Fig. 47. Fairness index among all TCP flows with different congestion windo w sizes (Scenario 7 in Section V). 74 4 6 8 10 12 14 16 18 20 22 24 18 19 20 21 22 23 24 25 Number of TCP flows at each direction Total TCP Throughput (Mbps) Default, LD=0ms Default, LD=15ms Default, LD=50ms WFA, LD=0ms WFA, LD=15ms WFA, LD=50ms Fig. 48. Throughput of TCP connections when they use different congestion window sizes (Scenario 7 in Section V). 75 4 6 8 10 12 14 16 18 20 22 24 0 0.5 1 Number of UDP flows at each direction Fairness Index ( f ) 4 6 8 10 12 14 16 18 20 22 24 0 0.1 0.2 0.3 0.4 0.5 4 6 8 10 12 14 16 18 20 22 24 0 0.1 0.2 0.3 0.4 0.5 PLR Default ( f ) WFA ( f ) Default (PLR) WFA (PLR) Fig. 49. Fairness i ndex among all UDP when the AP buffer size is 20 (Scenario 8 in Section V). 76 4 6 8 10 12 14 16 18 20 22 24 25.5 26 26.5 27 27.5 28 28.5 29 29.5 30 30.5 Number of UDP flows at each direction Total UDP Throughput (Mbps) Default WFA Fig. 50. T hroughpu t of UDP connections when the AP buf fer size is 20 (S cenario 8 in Section V). 77 4 6 8 10 12 14 16 18 20 22 24 0 0.2 0.4 0.6 0.8 1 Number of TCP flows at each direction Fairness Index ( f ) 4 6 8 10 12 14 16 18 20 22 24 0 0.2 0.4 0.6 0.8 1 4 6 8 10 12 14 16 18 20 22 24 0 0.2 0.4 0.6 0.8 1 4 6 8 10 12 14 16 18 20 22 24 0 0.2 0.4 0.6 0.8 1 PLR Default ( f ) WFA ( f ) EPDA ( f ) Default (PLR) WFA (PLR) EPDA (PLR) Fig. 51. Fairness i ndex among all TCP fl ows when the AP buf fer size is 20 (Scenario 8 in Section V). 78 4 6 8 10 12 14 16 18 20 22 24 19.5 20 20.5 21 21.5 22 22.5 23 23.5 24 24.5 Number of TCP flows at each direction Total TCP Throughput (Mbps) Default WFA EPDA Fig. 52. Throughpu t of TCP connections when the AP buf fer size is 20 (S cenario 8 in Section V).
Original Paper
Loading high-quality paper...
Comments & Academic Discussion
Loading comments...
Leave a Comment