The Effect of Structural Diversity of an Ensemble of Classifiers on Classification Accuracy
This paper aims to showcase the measure of structural diversity of an ensemble of 9 classifiers and then map a relationship between this structural diversity and accuracy. The structural diversity was induced by having different architectures or stru…
Authors: Lesedi Masisi, Fulufhelo V. Nelwamondo, Tshilidzi Marwala
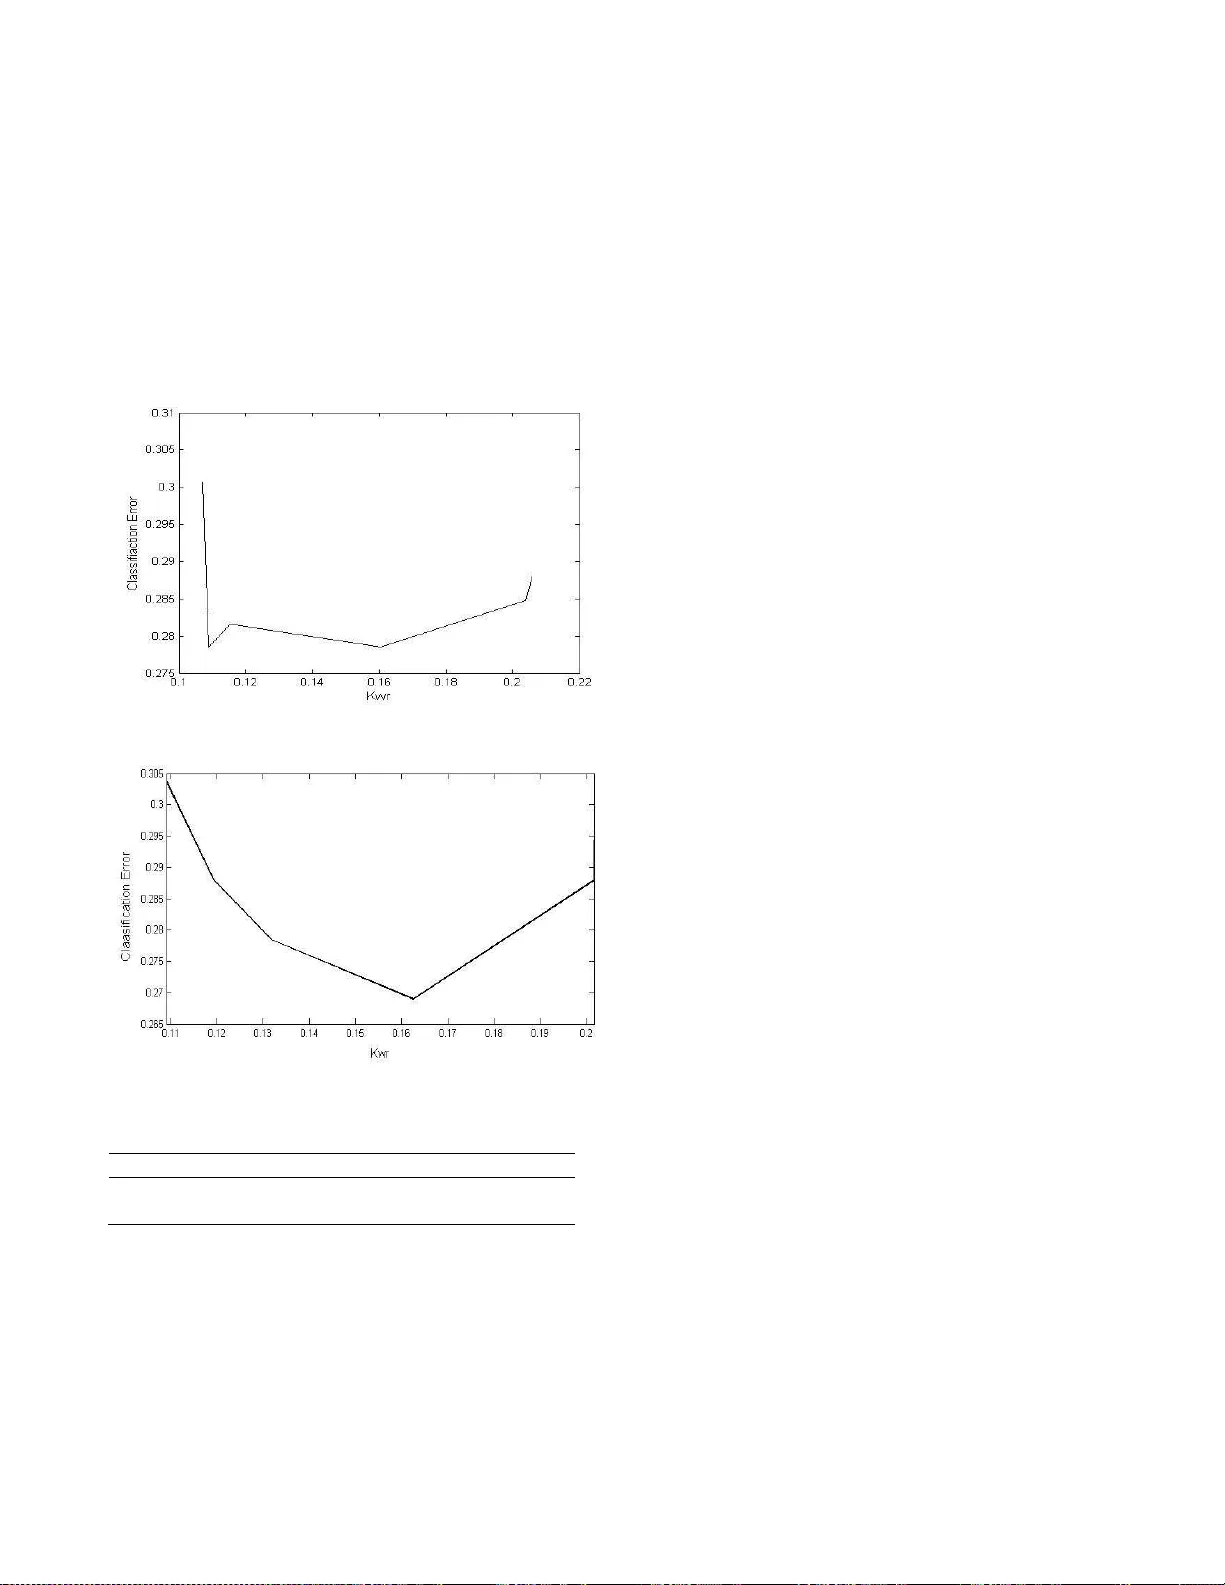
THE E FF ECT OF ST RUCTURAL DIVERSITY OF AN ENSE MBLE OF CLASSIF IERS ON CLASSIF ICATI ON ACCUR ACY Le sedi Masisi, Fuluf h elo V. Nelw amondo and Ts hilidzi M arw ala Schoo l of Electrical and Info rmation E ngineeri ng U ni ve rsity of th e Wi twaters rand Private B ag 3 Wits 2050 So uth Af rica ABSTRACT This pape r ai ms to showc ase th e measure of str uctu ral dive rsit y of an en semb le of 9 classif iers an d th e n map a relatio nship be tw een this s tructural div ersity an d accuracy . The struc tural d ive r sity was induc ed by ha ving diffe rent architec t ures or structu r es of th e classifiers Th e Genetical Algo r it h ms (GA) we r e used t o deriv e the relatio nship be t we en diversity and t he classif icatio n accuracy by evolv in g the classif iers and t h e n picki n g 9 classif iers out on an e n semb le of 60 c lassifiers. It w as found that as the ensemble bec ame diverse th e accuracy improv ed. Howeve r a t a ce rtain dive rsity measur e the accuracy began t o d r o p. The Ko havi-Wo lper t va r iance method is used to measure the dive r si ty of th e e n semb le. A method of votin g is used to aggregate the results from each classif ier. The l ow est err o r was obs erved a t a dive rsit y measure of 0.16 w ith a mean square e rr or of 0.274, w hen taking 0. 2024 as ma ximum div er sity measu red. The para m eters that we re vari ed were: the numbe r of h idden n ode s, l ea rn ing ra te and the activatio n function. KEY WORDS Genetical Algo r ithms (GA), Enssemb l e, classif icatio n, Structu ral div er sity , Iden tity Structure (IDS), multi lay ered percept ron (MLP). 1. Introduction Deve l o pin g an ef fic ient way fo r classificatio n h as be en a popula r t opic . It ha s bee n fo und th at as oppo se d to usin g one classifie r an en se mble of classif iers is more eff icient [1]-[3]. T h e r eason is t ha t a c ommittee of classif iers in making dec ision is b etter tha n one classifie r. The individual cl a ssif iers whic h fo r m this co mmittee h ave created large interest w h e n co m pared to accuracy of th e ensemb le [4]-[6]. Large r ese ar ch has b een done in optimizing th e d i v ersity of the ensemb l e a nd th e aggregatio n methods fo r the decis ion made by th e ensemb le [7]. This ha s led to develo pm ents in div ersity measu res and a r elatio n ship betwe en th ese m easu r es with the ensemb le accu r acy . Curr e nt met h ods use the outco m es of th e in dividua l classifiers of th e ensemb le t o m easure dive rsit y [8]-[13]. Th es e methods are a pp licable due to the w a y dive rsit y was defined [14]. This study foc uses on str uctural dive rsity . Th is means that, the individu al pa ramete r s of t he classif iers are used to measure structural di ve r sity as oppo sed to viewing the outco me of th e indiv idual classifie r s. This is in agreeme n t w ith Sharkey [15], w ho stated th at dive rsity can be induced by v ar y in g t h e ar chitec ture of t he classifiers. It also further implies that diversity will n o t be in duced by using diffe r ent learning sc h emes suc h a s bagg ing and boos tin g in sampli n g th e data fo r t raining, this is done so that only th e a r chitec t u r al p arameters of th e classif i ers wo uld in duce diversity . Same da ta w ill be used to train the ensemble of classif iers. Thi s w ill lead to kn o w ledge on whet h er st r uctu ra l dive rsit y h a s the potential t o pose improv ements o n the classific ation. There are a numb er o f aggregatio n s chemes suc h as minimum , maximum , product, a v erage, simp le majo r it y , weighted majo r ity , Naïve Ba y es and dec ision t emp lates to name a few, se e [14], [16]. How eve r f or this study th e majority vote scheme w as use d t o aggregate t h e individual classifiers for a final so l ution. This r epo r t includes a sec tion o n the Identity str ucture (IDS), Ko h avi- Wo l pert Variance Meth o d (KW), The neural n etw ork parameters , Ge netical A lgorithms (GA), The model, Impleme ntation, R esults a n d the n la st ly t he co nclusion and discus sion. 2. Identit y St r ucture (IDS) The Identity Str ucture (IDS) is der ive d from ta king into acco un t t h e pa ramete rs that make up a Neura l Netw ork (NN). Th es e parameters include the activatio n functio n s, numbe r of h idden n ode s and the l ea rning r ate. Ther e are other ty pes of th e Neural Ne two r ks (NN) tha t ca n be used to fo r m the IDS . A numb er o f ar tif icial mac h ines c an therefo r e be used for a h yb r id e n se mble. Howev er this is bey ond th e sco p e of th is study . F o r th is study a Multi Lay ered Perceptron (MLP ) was used. The paramete r s of co n cern we re the n umbe r o f h idden nodes , activation function and th e learni ng r ate . Th es e par ame te r s make up the Ide n t ity Str uctu re o f the classif iers (IDS). T h e IDS can be viewe d as: The IDS w a s decry pted in to a bina r y format, that co n ta ined 12 bits . That mea n s a one w ould indicate that the paramete r of t he classifie rs i s active an d a z ero would mean th e oppo sit e. Th e fir st b it r ep r es ented the ma c h ine ty p e used, the fiv e follow in g bits r ep r ese nted th e number of h idden nodes , th e following three bits th e activation functions and th e n lastly t he la st three bits repr es ented the learning ra tes used by th e classifier. Only th r ee l earnig rates we r e consider ed (0.01, 0.02, 0.03 and 0.04). That means a binary str ing of “0 0 1” would r epresent a 0.01 learning rat e. Three activation funct ions were co nsider ed hence the thr ee bits. These act ivation functio n s include the: Linea r , Logistic and th e Sof tmax. Th e fir st , se co n d and third bit of t he three b its r ep r esented the linear, Lo gi stic and the So ftmax r espec t ive l y . A one fo r th e first bit o f the decry pted IDS r ep r ese n ted the MLP as th e ma c h ine ty pe us ed for that class ifier. Th e numbe r of h idde n n ode s is set n ot to exc ee d 30, h e n ce five bits, see the f i ve bold b its on th e dec r y pted IDS be l ow. This co nver sion makes t he IDS l es s c o mplex an d wo uld r educe t he comput ati o n al co st on the calculations for dive r si ty . Suppo se that the classifier w as an MLP and had 5 hidden n odes an d used a lin ea r activation function and a lea rning r ate of 0. 02, the n the ID S wo uld be : IDS = [1 0 0 1 0 1 1 0 0 0 1 0 ] Each of th e pa ramete rs of the IDS w il l h ave to b e ev a luated fo r measu r ing diff eren ce s betwe en th e ide nt ities of th e classifie r s. The methods used to m easure diversity are as fo llows: the Yule’s Q -stati c fo r two c lassifiers, co r r elatio n co efficient ( ρ ), Kohav i-Wo lpert va r ia n ce (kw ), Entropy measure (Ent ) , m easu r e o f difficulty ( θ ) a nd Coincide n t Failure Diversity (CFD) [17], to na me a few . These m ethods are mainly appl ied at th e outco me of t he classif iers and n o t a t th e building b loc ks (structure) of t he classif iers [7]. H oweve r th e Ko h avi-W olpe rt variance ( kw ) meth od can be appli ed to measure the st r uctu ral dive rsit y , w hi c h w a s de r ived f rom the v a riance formulatio n [17]. This i s bec ause di versity in this study is def i ned as the variance a mo n g t h e arc hitectu res of th e individual classifie r s . 3. Kohav i-W olpert Variance Method (KW) This method i s applie d in m easu r ing the varia nce of th e outputs o f the classifie r s in the e n se mble. It falls unde r the family of Non-pairwise m easures [7]. As mentioned abov e t hi s equa tion is used to ev aluat e th e o utco mes of the classifiers. H ow eve r, f or this study it will be used to measu re the var ia n ce of th e di f fe r ent i de n tities of th e classif iers by evaluating the di f fe ren ce s of th e in dividu al IDS o f the classifie r s. That mea ns fo r this study : (1) , is a ve cto r of th e classifiers, L i s the total number o f classif iers. ca n b e view ed as, . Equatio n (2) def in es the ov erall v ariance calculatio n of the ensemb le. (2) j = 1,…,N, w h ere N is the n umb er o f th e ide n tity parameters (cl assifie r ty pe, complexity , activation function a n d t h e le arni n g rate). Thi s w il l result i n the variance of th e e nsemble . 4. The Neur al Netwo rk Parameters The structural dive r si ty i s based on th e pa rameters of th e neural ne two r k. See Figure 1 fo r a MLP neu ral netw ork. Figure 1: The MLP structu re s h ow in g the inputs, th e lay ers and the activ ation f unction The MLP is co mposed of th e input lay er, hidde n lay er and the output l ay er, hen ce it is multi lay ered, se e Figur e 1. An MLP i s b uilt with di f fe r ent pa r amete r s, suc h a s t h e activatio n funct ions, hidden n ode s, biases, we ights, etc. Fo r th is study diver se MLP s were created in a sense that they h ad dif fer ent l ea rn ing rates, activatio n functions an d the numbe r of h idde n n o des. This wo uld be c o n sidered as a di v erse e n semb le as compa r ed to ha vi n g the s ame MLPs w ith the same n umbe r of h idde n n o des, activat ion function and the l earni n g r ate. This can cle arly be seen from the IDS def i ned abov e. It is clear that th e diversity is not in duced on the training of t he neural n etw ork which is quiet a popul ar practic e. But diversity i s der ive d f r o m some of t he building blo cks of the indiv i du al classif iers. Se e e quati o n (3) t ha t desc r ibes th e outpu t of t h e neural ne two r k [18]. Where and are the activ a tio n functio n s at th e output lay er a n d at th e hi dde n laye r s r es pec tively , M i s the n umb er of th e h idden units, d i s the n umb er of i nput units, and are the we i ght s in the fi r st and sec ond lay er r espec t ive l y m ov in g from input i to hidden unit j, and indica te the bi ases f or the unit j. It was th e oute r activa tion functions w h ich we re vari ed to induce div ersity . It ca n also b e obs erved from equatio n (3) that va r y in g th e n u mbe r of th e hi d den n o des will a ff ect the ge n eralizatio n ability of th e neu ra l n etw ork. 5. Divers ity an d Genetical Algorithms (GA) GA ar e evolutiona r y a lgorithms that aim t o find a gl o bal so lution t o a given pr o ble m by a pply in g the pr inciple s of evo l utionary bio l ogy , su ch a s mutatio n, cr o ssove r , reproduc tion an d natural selectio n [20]. The GA h ave high capab i lities to searc h la r ge space s f or an opt imal so lution. Th e sea r ch proc ess of th e GA includes: 1. Ge neration o f a popul ation of offspring, n orma lly taken as c hr omo so mes 2. An ev aluation fu nction, that ev aluates the fittest chromo so me, i f n ot fit gen et ic ope ra tio ns take o ver, such as: m u tation an d c r oss over. The m utatio n induces diversity in the sea r ch spac e. 3. This proc ess cont inues u ntil t he fittest c hr o moso m e is attained. How e ver i n t hi s study the evaluatio n f un ctio n is t he dive rsit y measur e, the GA trie s to m ee t a certai n dive r sity (KW) among th e ensemb le of 9 classifie r s, see Figur e 2. The chromos ome s ar e the i n dexe s fo r the vec t or that co n ta ins 60 classif ie r s. The GA w il l then evo lve the classif iers fo r a spec ifie d di v ersity value. The GA face d dif fic ulti es in a ttai n ing the spec ifie d dive rsit y . T his w as because th e div ersity measure spec i f i ed could n ot be attained from the curre nt e n semb le of 60 classif iers. T o pr ev en t this prob l em from oc cur ring one w ould n eed to: • Build t h e e nsemble of 60 classif iers with know n KW values for any possible c o mbina tio n of th e 9 ensemb les. • Initially r un the GA f or a ny KW v alues an d then use the set of KW values that the GA can approxi mate. As the ta rget values in the next run. The second optio n seems muc h feasib l e than th e fi r st optio n be cause o n the fi r st opt ion it wo uld m ea n that the r e wo uld be n o n ee d for the GA. Th e fi r st option furthe r implies that the GA would be synchr onized w ith th e KW measu re. The GA was empiri ca lly optimized fo r an initial populatio n o f 20 c h r omo so m es, 28 Generatio ns w i th a cross over rate of 0.08. 6. The Mod el The model desc r ibes t he basic flow of th e algo r it hm fo r deve loping an ensemb le of 9 classif iers f r om the 90 classif iers. The method of voting w as then a pp lied o n the 9 ch o sen c lassifiers for generating th e cla ssif i cation accuracy of th e e n semble . Trai ned 60 Ensem ble GA 9 Optima l Ensemble Vote Final Dive rsity obt ained Accuracy Figure 2: The mapp ing proc ess of diversity and accuracy 7. Impl ementation A vecto r of classifiers was created w h ich w as co mposed of 60 classif iers. This w as because th e mo r e t h e classif i ers there was, the bette r the sea r c h space fo r the GA for an optimal solutio n. All t h e classifiers in the vec t or w ere trained. Th e GA onl y looke d fo r a s olution fo r an ensemb le of 9 classifie r s. This means o n ly 15% of th e classif iers out of t he ensemb le of 60 classifiers was used at a time. This w a s to ensur e r easo nable div ersity values in the search space. An odd n umb er fo r t h e en semb l e was chose n so l emnly t o avoid a tie w h en the m et h od of votin g w as used. The evaluatio n functio n was composed of t wo var iab l es, the diversity measure and the targe ted diversity ( ). See equation (5) fo r the ev aluatio n fu n ctio n . (5) Where: is th e evaluatio n fu n ctio n , is the dive r sity measu red of the 9 classif iers a n d i s the targeted dive rsit y . The targe ted dive r sity i s t he div ersity th e GA is searchi n g for in the ensemb le of 60 classif iers. That m ea ns the GA w as searching fo r a group of 9 classifie r s tha t w ould m ee t the targeted diversity . Th e str uctural div ersity of t he 60 ensemb le w as first ca lculate d an d w as fo un d to be 0.2024. Hence th e tar geted dive r sity value was r anged be l ow t hi s value (0.2024) . The GA t ri es t o optimize the ev a luati on fu n ction by finding its maximum . Equatio n (5) will reac h its maximum whe n the measured div ersity is e qual to the targeted dive r si ty . GA was th e n optimized by first searc h ing th e KW values which th e GA could n ea r ly reach an d then th ey w er e used in the sec ond r un a s the target diversity values. This was t o avoid th e GA searc h ing fo r the target values that di d n ot exist from any co m binati o n of 9 classifiers from t he 60 en semb l e of classif iers. 7.1 Vecto r of class ifiers The classif iers w er e created via the n o r mal distribut ion by creati ng them at ran do m, the activation functio n s, h idde n nodes, an d th e learni n g rate w ere ch osen at ran do m. This w as so tha t the ve ctor co n tained an e n semb le of classif i ers w hi ch w ere n ot biased. How e ver a p r ec autio n was ta ke n so th at we ak classifiers we r e n ot c r eated , all t he classifiers had th e numbe r of hi dde n nodes l arge r tha n the numb er of input fe a tures. The vec t or al so ha d classif iers that had a classific ation mean square error of l ess th an 0.45 on the validation data set. For it was di ffic ult to a ttain l o w m ean square err o r s w ith t h e da ta used. Th e en semb l e of 90 ve ct ors was optimized by usin g an e n semble tha t p r o duce d a greater dive rsit y measur e. Th is dive rsity measur e is 0.2024. Thi s wo uld be a b le to pr ovide t he GA w ith b etter classifiers that co uld gene rate the requi r ed div ersity (KW ). 7.2 The Nine Ensem ble of Class ifiers The v ali datio n d ata set w a s used to select th e nine classif iers from the vec t o r of 60 classifiers. The classifiers were dec r y pted in to a se t of b i nar y numbers as stated befo r e. This bina r y num b er r ep r ese n ted the IDS of th e individual classif i er. See table 1 fo r o n e of the ensemb le of 9 classif iers. Ta ble 1 : The IDS of t he 9 cla ssifiers C1 C2 C3 C4 C5 C6 C7 C8 C9 1 1 1 1 1 1 1 1 1 0 0 0 1 0 0 0 0 0 1 0 1 0 1 1 0 1 1 1 0 0 0 1 0 1 0 0 1 0 0 1 1 1 0 0 0 0 1 1 0 1 1 1 0 0 1 0 0 1 0 0 1 0 0 0 1 0 0 1 0 0 1 0 0 0 1 0 0 1 0 0 1 0 0 0 0 0 0 0 0 0 0 1 0 1 0 0 1 1 0 1 1 1 1 1 1 0 0 1 The ma ximu m dive rsit y given buy th e en se mble of 60 classif iers was 0.2024, h e n ce a lso th e GA c o uld n ot find any KW value beyo n d th is poi n t. This furthe r limite d the numbe r of po i nt s th at could be us ed to map th e relatio nship be twee n structural div ersity and accuracy . 8. The Data The interstate co n flict data was used fo r thi s study . Th e r e are 7 fe atur es and one output, see table 1 f or t h e data input fe a tures. Table 1: The inters tate co n flict dat a inputs values Allies 0 - 1 Contingency 0 - 1 Distance Lo g10(Km) Majo r Powe r 1 - 0 Capability Lo g10 Demo cr acy - 10 - 10 Depe n dency co n tin uo us The o utput is a bina ry numbe r, a ze r o rep r es ented no co n flict w her e else a one r eprese nted co n flict. There are a total of 27,737 case s in th e c o ld w ar populatio n. The 26,846 are the peacef ul d y ads ye a r and 875 co nflict dy ads ye a r [19]. This show s clearly that the data i s complicated for traini n g a n eu ra l netwo r k. H oweve r fo r this study i t w as just used to show h ow structura l dive rsit y r elates w i th the ensemb le accu r acy . A data sample o f 1006 w as us ed fo r tr ai ning, 317 sample s for validat ion an d 552 fo r testi ng. The tot a l data used w as therefo r e 1875. This data ha s seve n fe atur e inputs a s mentioned , h o weve r the da ta w as n ormalized be twee n 0 and 1, t o have equal importance of all t he fe atur es, by using equ ation (4): Where and are th e mi n imum a n d maximu m values of the fe atures of th e d ata samp les o bserve d, respec tively . 9. Results Figure 3 show s t h e r esults from the GA with the fir s t r u n of th e GA w ith arbit r ary target values. Howev er Figure 4 show s th e graph of er ror Vs structu ral diversity with the optimized target v alues. The figu r es we r e ob tai ned from using the valid ation data set. T he ensemb l e of 9 classif iers chose n by t he GA was th en t es ted on th e testing data set so a s to brin g m o r e sense to th e r esults, see t able 2. The testing data w a s applied on the ensemb le th at pr oduc ed 0.16 and 0 .11 dive r si ty values . Figure 3: GA predicting 6 dive r sity values Figure 4: Op t imise d GA o n the same 60 e nsemble . Table 2: C lassificat ion error o n the testi ng data set Kw Error (I nitial Kw ) Errors (Opt imized Kw ) 0.11 0.3128 0.2821 0.16 0.2821 0.2749 It can be seen that the results from Figure 3 and Figure 4 follow t he expe cted trend. The erro r decreased wit h increasing div er sity . Howeve r there is a point w h ere the degree of dive r sity become s unfavo r able. The error began to increase with an inc r ease in div ersity . Th is i s in alignme nt w ith [7], w h o stated that div er sity can eit h e r profit the sy st em or i t co uld bring abo ut poor per f orma n ce on t h e classific ati o n . I t c an a lso be observe d from t he graphs that th e data poi n ts o f in terest are n ot to scale. The occ urr ence of a ch ange i s not co n sistent. This is co uld be attributed to : • The f act that th e r e w as a l ot of r oundi n g o ff values i n the so ftware package (Matlab ), • The o th er facto r is that the ensemb le of 60 classifie r s w as not designed w ith a lin e ar o r w ith co nsistent increme nt s of dive r sity v alues. • The tar gete d div er si ty v alues mi g h t not ha v e bee n pos sib l e to be extracted from t he en se mble a n d due to that t h e GA w il l p r o vide d it s local solut ion. Mean squ are erro r was used in a ll instance s to calculate the classif icatio n accu r a cy . Howeve r it w as just used as refe r ence so as t o observe t he behavio r of th e en se mble w ith the c h anging d ive rsit y m easu r ed. 10. Con cl usion and discussion This paper prese nt ed a m easu r e of str uctu ra l diversity a s def i ned in this pape r an d th e n a r el ati o n s hi p betwe en structu ral dive r sity and classific ation ac curacy we r e mapped. As div ersity in c r ease s the gen e r alizatio n ability of th e e n se mble improv ed, t his was seen by th e classif ication erro r dec r easing. H ow e ver there w a s a point w her e dive r sity made the e n semb l e we aker to classif y . This study h as a lso shown that diversity of an ensemble can be induce d by ha v ing an ensemble that i s co mpose d of classif iers that h ave di f ferent para meters suc h as activatio n f unctions, n umbe r o f h idden n o des a n d the learning ra te. Thi s is in alignme n t w ith Sharkey [15]. The methods used w ere c o mputationally expe n siv e sin ce th ey made use of th e GA and the t r aining of 60 classifiers. This study agrees with m o st l iteratu res t ha t diversity doe s improv e th e accuracy of th e e n se mble [7]. This w as obs erved by using the testing data set on th e ensemb l e that had a low classific ati o n err o r. This s tudy was l imited by the bank of classif iers (60 classif iers) th at w ere created at r ando m. This ensemb le h ad 0.2024 diversity m easures w hi ch meant that o n ly small samp les co uld be used to ve r ify th e relat ionship b etween dive r sity an d acc uracy . All the e rr o r s on the testi ng data set sh o w ed t hat dive r sity can be used to measur e the potential fo r im p r o ve m ent on the ensemb le of classif iers. References [1] J. Kittler, M. Hatef , R. Matas & J. D uin, O n co m bin ing cl a ssif iers . Inte ll. 20 (3), 1998, 226-2 39. [2] L. Breiman, Comb in ing p r edicto rs in: A.J.C Sharkey (Ed.) , Com bining Ar tificial Neural Nets , Spri n ge r , Lo n don, 1999. [3] H . Dr ucke r, Boo stin g usi n g using n eu r al n etw orks, in: A.J.C. Sharkey (E d.) , C ombining Arti ficial Neural Nets. Springe r , Lo n do n, 1 999. [4] F. Giac int & G. Ro li, Hyb r id methods in patte rn reco gnition, World S c ientific Pr es, S ingapo r e, 2002. [5] K. Sirlant zis, S. H oque & M.C. Fairhurst, Div er sity i n multiple c l assifie r ensemb les b ased o n binary feature quantisatio n w ith app licatio n to face r eco gn iti o n , Department of Electron ics, Univers ity of Ke nt , Unit ed Kindom, 2008, 437-44 5. [6] G. mo r dec ha i, J. H . M ay & W.E. Sp angle r, Asses sin g the predictiv e accur acy of di versity m easures with domain-depe n de n t, asy metric misclass ification cos ts, Information Fuss ion 6 , 2005 , 37-48. [7] L . I. Ku n c h ev a, M . Du in & R.P.W. Skuric hina, A n expe riment study on di v ersity for bagging and b oos tin g w ith linear classif iers, Informati on Fusion 3 , 2002, 248- 250. [8] K .M. Ali & M.J. P azzani, E rror r eduction t hr oug h learning multiple desc riptions, Machin e Lear ning 24 (3) , 1996, 173-202 . [9] P.K. C han & D.J. Stolfo , On th e a cc ura cy of meta- learning fo r da ta minin, . J orna l of Intelligent Inform ation System 8 , 1 997, 5-28. [10] T.H. Dav enport, Sav ing IT's soul: human-centered info r mation manageme nt, H arvard Business R e view , 1994, 119-131 . [11] T.G. Die tteric h, An expe r imental c ompa rison of three meth o ds fo r c o n st r ucti ng en semb l es of decissio n trees : baggin g and boo sti ng, and ran do mizatio n , Machine Learning 40 (2), 2000 , 139-157 . [12] l. Ha nsen & P. Salamo n , Neu ral n etwo r k e n semb le, IEEE Transactio n on Partt en Analysis and Machine Intelligence 12 (10), 1990, 993-10 01. [13] A . Krog h & J. Vedelsby , Neural netwo r k ensemble s cross validation an d active learning, in: G. T es auro, D.S. Touretzky , T.K. Le en (E ds.), MIT Pr ess, Camb ridge, 1995. [14] A. C. S hipp & L.I. Kun c h ev a, Re lat ions h ip b etwe en co m binati o n methods and measu r es o f dive r sit y in co m bin ing classifiers , El s evier Science B. V . , UK , 2002, 135-148. [15] A. Sharkey , Multi -Net s y stems, Combining artific ial neural nets: Ensemble a n d Mo dular M ulti-net S y stems , Springer-Ver l ag , 19 99, 1-30. [16] K.Tumer & J. G h o s h , Li n ea r an d o r de r statistic s co m bin e r s fo r patt e rn classific ati o n , Combini ng Artific ial Neural N ets , Lo n do n, 1999. [17] R . Kohavi & D .H. Wolpert, Bias plus va r ia nce deco mposition fo r ze r o -one lo ss f un ctions , Mo r gan Kaufma nn, 1996, 275-283 . [18] C.M. B i shop, Neura l netw orks for pattern recognition ( Oxf ord U ni v ersity Pr ess , 1995). [19] T . M ar w ala & M. Lagazio , Mo deling an d Controlli n g Inte rstate Co n flict . [20] S. Mo h amed, Dy namic P r ote in Class ificatio n : Adaptiv e Models B ased on Incr eme n tal Learni n g Strategies. University of t he W itw atersrand , MSc theses . 2006.
Original Paper
Loading high-quality paper...
Comments & Academic Discussion
Loading comments...
Leave a Comment