Introduction to Relational Networks for Classification
The use of computational intelligence techniques for classification has been used in numerous applications. This paper compares the use of a Multi Layer Perceptron Neural Network and a new Relational Network on classifying the HIV status of women at …
Authors: Vukosi Marivate, Tshilidzi Marwala
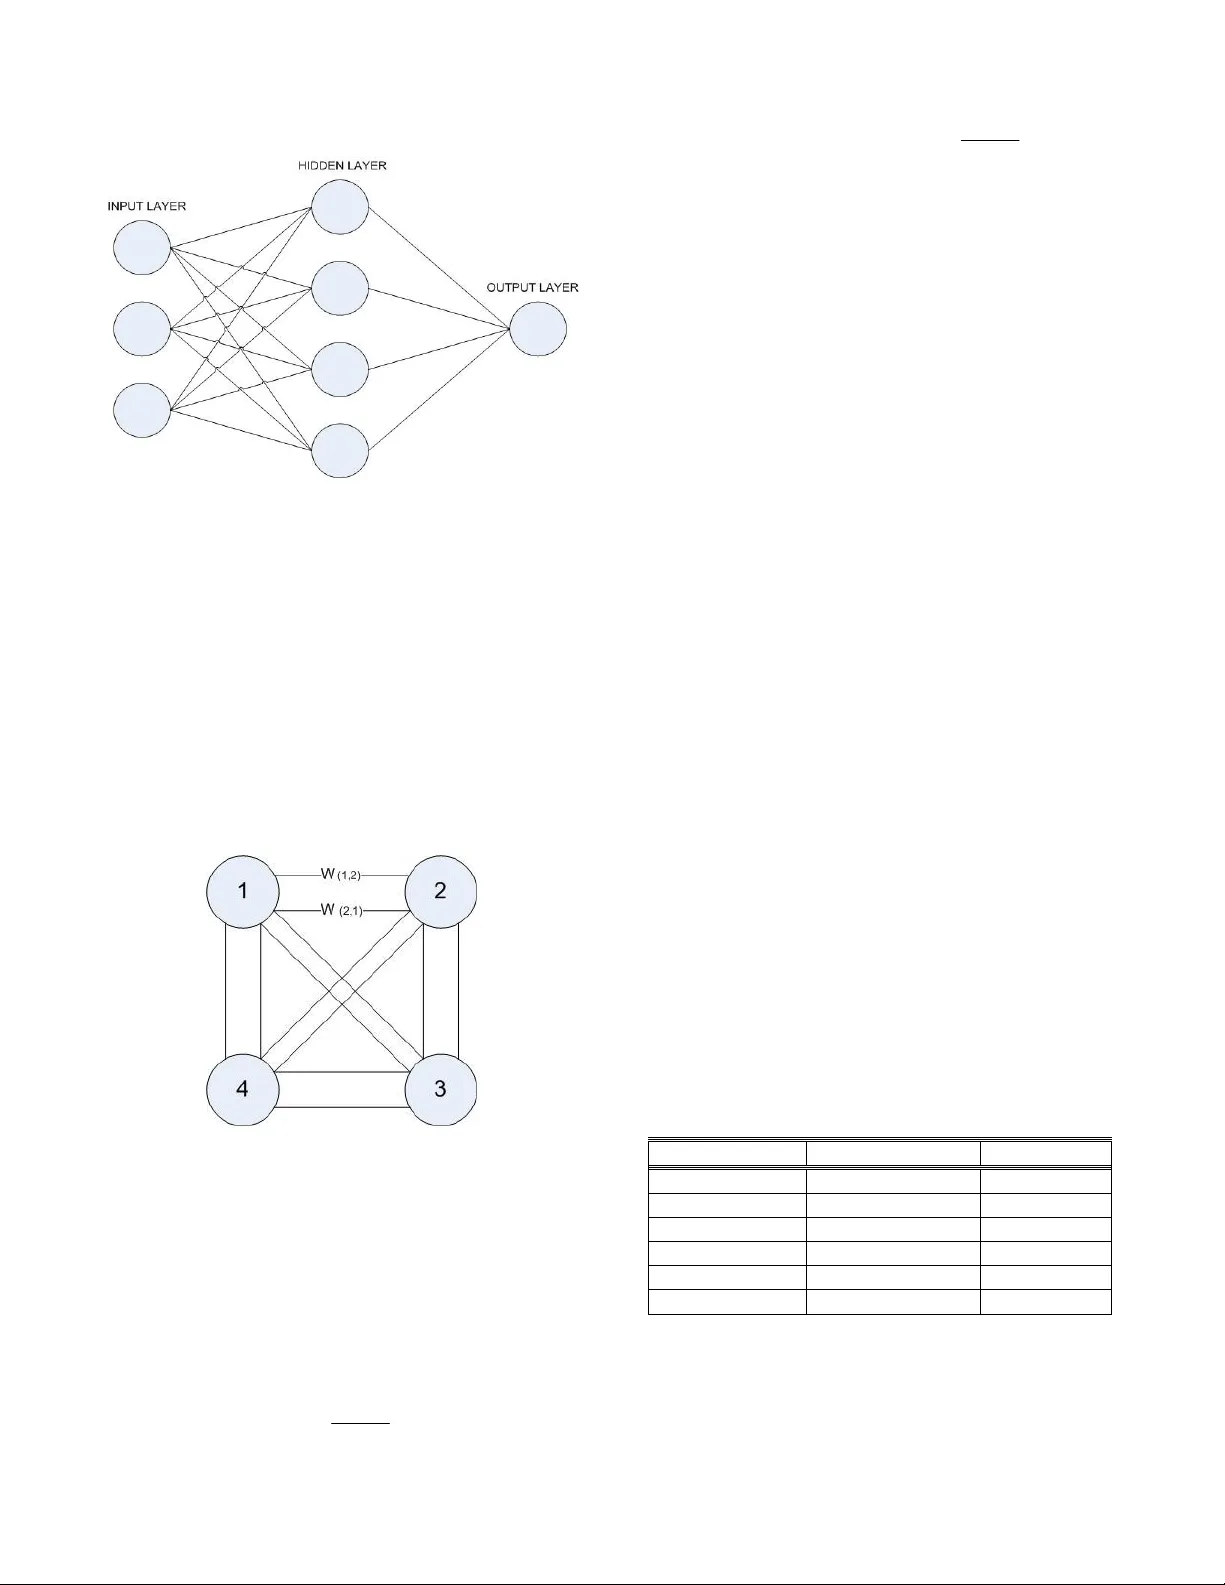
INTRODUCTION TO RELATIONAL NETWORKS FOR CLA SSIFICATION Vukosi Marivate* a nd Tshilidzi Mar wala** University of the W itwatersrand Johannesburg South Africa vukosi.marivate@ie ee.org, t.marwala @ee.wits.ac.za ABSTRACT The use of computational intellige nce techniques for classification has been used in n umerous app lications. This paper co mpares t he use of a Multi Layer Percep tron Neural Network and a new Relational Net work on classifying the HIV status of women at ante-natal cli nics. The paper discusses the ar chitecture of t he re lational network and its merit s co mpared to a neural network and most other computatio nal intellige nce classifiers. Results gathered fro m the study indicate comparable classi fication accuracies a s well as revealed relatio nships bet ween data features in the classification data. Much higher classification accuracies are recommended for future research in the area of HIV classification as well as missing data esti mation. KEY WORDS Neural Network, Re lational Network, Clas sification, HIV 1. Introduction Acquired immunodeficiency syndrome ( AIDS) is a collection of s ymptoms and infectio ns resulting fro m t he specific damage to the i mmune syste m ca used by the human immunode ficiency vi rus (HIV) in humans [1 ]. South Africa has seen an i ncrease in HI V infection rate s in recent years as well a s having t he highest number o f people living with t he virus. This res ults fro m the high prevalence rate as well as resultin g deaths fro m AIDS [2]. Research into the field is thus stron g a nd ongoing so as to try to ide ntify ways i nto dea ling with vir us in certa in areas. Thus demograp hic data are often used to class people living with HIV and h ow they are affected. T hus proper da ta collec tion need s to be done so as to understand wher e a nd ho w t he virus is spreading. T his will give mor e insight into ways in whic h ed ucation and awareness can be used to equip the South African population. B y bein g ab le to id entify factors that d eem certain people or populations in higher risk, the government can then de ploy strategies and p lans within those areas so as to help the peop le. This paper investigate s the use of a new archi tecture for classification of HIV. This method is co mpared to the neural network method that has b een used b y Le ke [3 ]. The work done in the field o f HIV classification using demographics has mostl y yield ed results tha t have 5 0% - 70% accuracy. Improve ment in the clas sification is needed to have a m uch better understanding of the underlying in formation i n the data. An important factor though is the relation bet ween the da ta features. Knowing how the features impact on e ach other will reveal factors that are highly depende nt. The r elations can then pave the way for better d ecision making by health care professionals in areas that are affecte d by HIV. This paper first gives a back ground o f the methods to be compared in Section 2. Section 3 di scuses the d ata co llection for the HIV data. Section 4 disc usses the methodolog y. Sectio n 5 discusses the res ults and Section 6 is the conclusion. 2. Background 2.1 Neura l Networks Neural Net works ar e co mputational models that ha ve t he ability to learn and model sys tems. The y have t he abilit y to model non -linear systems [4]. T he neural net w ork architecture used in this pape r is a multila yer percep tron (MLP) network [4] as shown in Figure 1. This has t wo layers o f w eights which co nnect the i nput la yer to t he output layer. T he middle of the network is made up o f a hidden layer. The general equation of the MLP neural network is shown b elow (1): ) ) ( * ( 1 1 ) 2 ( 0 ) 1 ( 0 ) 1 ( ) 2 ( ∑ ∑ = = + + = M j d i k j j ji inner kj outer k w w x w f w f y (1) Parameter k y is the o utput fro m the neural net work, j x represents the i nputs i nto t he neu ral network and w represents the d ifferent weights b etween the node s in t he neural net work. For the classification network the outer f activation function i s a loga rithmic acti vation function and inner f is the hyper bolic tangent function. Tr aining is done using the back-propagation algor ithm [4]. T he inputs into the neural network are dem ographic data from an antenatal survey while the o utput from t he ne ural net work is the HIV status o f the subject a t hand. Figure 1 MLP Neural Network 2.3 Rela tional Network The other network t hat is pr oposed in this p aper and then used i s the Relational Net work. T he networ k uses all the inputs as o utputs fro m the s ys tem. T his is what distinguishes the Relationa l N etwork from an extension neural network [5]. Each feature is taken a s a nod e. All o f the nodes a re connected to each o ther with edges. Every node is co nnected to anot her node with t wo edges. The edges represent the r elations of the one node on the other and visa versa. T here is a weight assigned to a n edge to quantify ho w connected t he two cor responding nodes are. This is sho wn in an example in Figure 2. Figure 2 Relational Network The general equation for all node s in the network is: k f or k j x f w x N j j kj k ≠ = ∑ = ) ( * 1 (2) Here kj w r epresents the weights between t he assigned to each function o f a nother nod e ) ( j x f . The functions used in this paper ar e: • Linear - x x f = ) ( • Logistic - x e x f − + = 1 1 ) ( • Hyperbolic T angent - 1 1 ) ( 2 2 + − = x x e e x f Thus in this configuration all nodes are represented as weighted function o f al l othe r nodes. W hen trainin g, the weights ar e ad justed so as to reduce the er rors between true node values a nd calculated nod e values from (2). Thus the training of t he net work is supervised. The functions in t he edges are used in order to find out how the data i s related. By testing dif ferent net w ork architecture one c an gauge i f the relations a re linear or non-linear. The higher the weighting of the function of a node then t he more dep endent the t wo are. One node might be mor e dependent o n the other; t his will be noted by the weights. Thus thi s ar chitecture can be vie wed as a transparent ar chitecture as the weights the mselves can be analysed to e xplain t he interc onnections b etween the data being analysed. The traini ng of the net work a nd how it reduces its error is discussed in Section 4 .2. 3. Data Collection and Pre-processing The da taset that is used for this investigatio n is HIV data from ante natal cli nics from around South Africa. It was collected b y t he depart ment of health in the year 20 01. The dataset contains multiple input fields that result from a survey. For example the provinces, region a nd r ace ar e strings. The age, gravidit y, p arity etc. are integers. Thus conversions are needed . T he strings are converted to integers by using a look-up table e.g . there are only 9 provinces so 1 was substituted for a province etc. Data collected from surve ys and other data collectio n methods normally h ave outliers. These ar e nor mally removed from the d ataset. I n this investi gation d atasets that h ad outliers had o nly t he o utlier removed and the dataset was the n classified as inco mplete. This the n means that t he data ca n still be used in the final s urvey results if the missi ng values are i m puted. The dataset with missing val ues was not used for the trai ning of the computational m ethods. The data v ariables and their ranges are sho wn below in Table 1 . Table 1. Fea tures from Survey Data Variable Type Range Age Integer 1- 60 Education Integer 0 - 13 Parity Integer 0 - 15 Gravidity Integer 0 - 11 Age of Father Integer 1 - 90 HIV Status Binary [0 , 1] Age is the age o f the mothe r. Education is the le vel of education the mother has 1-12 b eing grades a nd 13 being tertiary educatio n. Parity is the num ber o f times the mother ha s given birth while Gravidity is the number o f times the mother ha s b een p regnant. Age of father is the age of the father a nd the last feature is the HIV status o f the mother. The p re-processing of the data r esulted in a reduction o f tra ining data. To use the d ataset for tr aining it needs to b e normalised. This ensures that all the d ata variables can b e used i n training. I f the data are not normalised, some of the data variables wi th lar ger variances will influence the r esult more than others. For an example, if we use Parity and Age data only the age data will be influential as it has large values. Thus all of the data are nor malised between 0 and 1. 4. Methodology The approach taken for this experi m ent is to build t wo classifiers a nd t hen compar e their performances. Their performance is m easured accord ing to accuracy. The previous work car ried o ut b y Leke [3] is used as the base for the d esign of the MLP network. The Relational Network is the n designed and the weights ad justed u sing the Metropolis Hasti ngs algorithm. 4.1 Neura l Network Training The toolbox used for th e neural net work i s t he Netlab Toolbo x [6] . T he MLP was trained using the scaled conjugate gradient algorithm [6]. Education, Parity a nd Gravidity were used as bi nary n umbers (4 b inary digits each). T hus the n umber of in puts into the neural network is 14, this include s the nor m al ised Age and Age of father. The output fro m the neural net work is th e HIV status. 1000 training cycle s were used to trai n the neural network. I t is importan t that the training data is unbiased . Most of the respondents of the survey are HIV negative thus if the neural network is t rained with t he data as is, it will m ost li kely classify a ll data as negative as most of the data is negative. Thus the trai ning data the number of HI V positive and negative respon dents had to be the same. Thus in the trai ning set t he n umber of HIV positi ve sets can be re-used until we ha ve an equal number of HIV positive. 4.2 Rela tional Network Training To tr ain the Relational Network a sampling a lgorithm was used. The sampling algorithm uses the mean square er ror as the basis o f select ion of the best solution. Initially weights are generated rando mly. The error is calculated by comparing the real node i nput and the calculated value from the equation in the n etwork. This is s hown in equation 3: ∑ = − = n k k x x n e 1 2 ) ( 1 (3) x is the train ing d ata, k x are the data output s from the network a s described in (2 ) and n is the number of training sets. This is termed the mean square error. The algorithm works in t he manner sho wn in Figure 3. This is the Metropolis-Ha stings algor ithm [7] that is modified to sample for weights. T he weights at the end of the algorithm have t he least error . As can be noticed from this training method, the erro r used is the one that minimises the err or of calculation for all features. T his is different from an extension neural network [5]. The training chosen tries to b uild a general represe ntation of all of the i nput features and not o nly for the d ata feature that needs to b e classified. The training ca n be used to only focus on t he feature that need be classified. All of the weights varied b etween 0 and 1. 5. Results To test the classificatio n methods a dataset t hat was not used in training was u sed. T he testing dataset had 15 00 sets fro m the survey t hat was unsee n. The HIV classification was rounded as the output numbers from the networks ranged fro m 0 to 1. The outputs from the classifiers were then co mpared to the real outputs fro m the testing set and thus th eir per formance could b e measured. 5.1 Accura cy Measure To measure the ac curacy o f the methods o ne cannot simply use the mean square er ror. The mean square error is a good m easure to use for optim isation or sa mpling methods. I n order to q uantify the results, percentage accuracy is used as well as co nfusion matrices in order to be able to view how the clas sification is fairing especia lly for binary data such as HI V status. The confusion matrix [8] shows the cross -classification of the predicted class against the true class. Thus the co nfusion matrix indicates t he number of true positives ( TP ), false positive s ( FP ), tr ue negatives ( TN ) and false negatives ( F N ). The total accurac y is measure as: 100 (%) × + + + + = FN FP TN TP TN T P Accuracy (4) Initialise random weights w Calculate mean square error due to w , e for ( e > threshold or iterations < maxIterations) Generate new weights w’ Calculate error e’ a = e/e’ if (a >1) w = w’ else accept w’ with probability a return w end Figure 3 Rela tional Netwo rk Training 5.2 MLP R esults The be st MLP config uration had 17 hidden nod es and t he accuracy o n the validation set was 55%. T hus the MLP could pred ict the HIV status 55% o f the time. Table 2 M LP confusion m atrix Predicted positive Predicted negative True positive 221 131 True negative 526 622 5.3 Rela tional Network Result s The Relational Network performance was trained with different acti vation functio ns in t he edges. T he best activation f unction w as t he linear activation w hich resulted in 60% classificatio n accurac y. T he lo gistic activation function r esulted in an a ccuracy of 65 .73%. The hyperbolic ta ngent activatio n resulted in 60% accuracy. The first confusion matrix is t hat o f t he li near function, sho wn in Table 3 . Table 3. Linear f unction confusion matrix Predicted positive Predicted negative True positive 127 225 True negative 370 772 The total accuracy for the li near function is 60%. Its false positives are numerous but not as severe as the ot her functions. The seco nd con fusion matrix, for the lo gistic function, is sho wn in Table 4 . Table 4. Logistic function confusion matrix Predicted positive Predicted negative True positive 77 275 True negative 239 909 The logistic fu nction has a higher accuracy of 65 .7%. This though i s at a sacrifice of higher fal se positives. T hus the pred iction that a per son is HI V positive given their demographic is only co rrect 22% of the ti me. T he final confusion matrix ( Table 5 ) is that for the h yperbolic tangent function Table 5. Hy perbolic tangent functio n confusion matrix Predicted positive Predicted negative True positive 167 185 True negative 455 693 The hyperbo lic tangent function ha s a total accurac y o f 57%. 5.3 Weight ing and Relations The r elational net w ork allows for observation of the weights. B y analysing t he weights, the r elations (linear or non li near) betw een th e data featu res can be ob served. The weights values varied betwee n 0 and 1. For the linear function the lar gest weights connected to HI V were for age (0 .3) while the lea st was 0.04 for Gr avidity and 0.15 for Age of father. T he logistic function had high weighting b etween HIV status and the age of the father. The hyperbo lic tangent function had high wei ghting for the age (0 .42) as well as the age of the father (0 .25). Lo w weights were observed in all functions for gravidit y a nd parity. T he weights for these were in the order of 0.05. From observing the weights we can t hen setup questions like: • T he older the mother c oming to the cli nic the higher the chance o f HIV? • T he older the father of the c hild the higher t he HIV? These questions then call for further investi gation in t he medical field. 6. Discussion The results of the HIV classification vary with the different methods. T he total accuracy of all the methods is compared in Figure 4. Figure 4 Comparison of Accuracies The lo gistic relational network has the highest to tal accuracy. T his tho ugh re sults in a high false negative count as compared to the other methods. When anal ysing the results o f all of t he metho ds a pattern emerges where if the total accurac y increases the false po sitives? T his may be the re sult of the nature of t he data itself. As discussed earlier to train the met hods the data needs to b e unbiased. T he bias is due to the fact tha t close to 75% of the responde nts of the sur vey is HIV negative. Thus i f one predicts that a responde nt is HIV negati ve they will be right 75% of the ti me. It seems t hat the higher t he accuracy o f the classificatio n method the more the true negatives will increase while the true po sitives d ecrease. Thus a new goal reco mmen ded for researchers using this data is to have accuracies tha t are in the 90% range. T he closer the accurac y is to 75% the higher the inaccuracies in predicting the HIV p ositive re spondents. Missing d ata imputat ion o f HIV data has also been an area of resear ch interest [ 9][10]. In this field the prediction of HIV has yielded results with total accuracies of up to 68% using m ethods such a s Rough Set s [1 1], Auto-Associative Neural Net w orks [9] and Supp ort Vector Regression [1 0]. These results are comparable to classification results. Thus further inve stigation o n how the data itsel f impacts on t he accurac y of the classificatio n is crucial in improv ing the over-all resu lts. 7. Conclusion The use of a rela tional net work to classify HIV has b een discussed and the re sults ar e co mparable to an MLP classification method. T he results indicate t hat there are inter-relationships betwee n t he HI V data features. The HIV stat us is related to the ag e of the mother a nd the father. A n increase in t he classi fication accurac y of the method is an increa se also in the number o f false positive classification. This phenomeno n occurs even though the training data i s unbiased. T hus a challenge for future researchers i s to ge t the classification acc uracies for the HIV dataset to levels beyon d 80% and c lose to the 90 percentile. The data itself is pri marily co mposed (75%) of HIV negative respondents thus having accuracies higher than 80% are needed . References [1] Marx, J. L. Ne w d isease baffl es medical community. Science , 217 (4560), pp. 618-621, 1982 [2] Depar tment o f Health, So uth Africa. HIV /AIDS/STD strategic plan for So uth Africa, 2000. [3] Leke, B., Marwala, T. And Tette y, T. Autoencoder networks for HIV clas sification. Cur rent Science , 91(11), 2006. [4] Bishop, C. Pa ttern Recognition and Machine Learning . Springer, 2006. [5] Wang, M. H., H ung, C. P. Ex tension neural network and its app lications. Neural Networks, 16, pp. 779– 784, 2003. [6] Nabne y, T. Netlab Toolbox . URL: http://www. ncrg.aston.ac.uk/netlab/, la st accessed 24 April 2008. [7] Chib, S. and Greenber g, E . " Understanding t he Metropo lis–Hastings Algorithm". American Statistician , 4 9(4), 327–335, 199 5 [8] Hand, D., Mannila, H. Pri ncip les of Data Mining , MIT Pr ess, Cambridge-MA, USA, 20 01. [9] Abdella, M., Marwala and T. The Use o f Genetic Algorithms and N eural Networks to Approximate Missing D ata. Datab ase in Comp uters and Artificial Intelligence , 24(6), 2005. [10] Marivate V. N., Nel wamondo, F. V., Mar w ala, T., Autoencoder, Principal Component Analysis a nd Support Vector Regression for Data Imputation, Proceeding s of th e I nternationa l Fe deration of Automatio n and Control Con ference 2008 , 2007 . [11] Nelwamondo, F.V., a nd Ma rwala, T. Rough Sets Computations to I mpute Missing Data. ArXiv e- prints, 704 , 2007.
Original Paper
Loading high-quality paper...
Comments & Academic Discussion
Loading comments...
Leave a Comment