Popularity, Novelty and Attention
We analyze the role that popularity and novelty play in attracting the attention of users to dynamic websites. We do so by determining the performance of three different strategies that can be utilized to maximize attention. The first one prioritizes…
Authors: Fang Wu, Bernardo A. Huberman
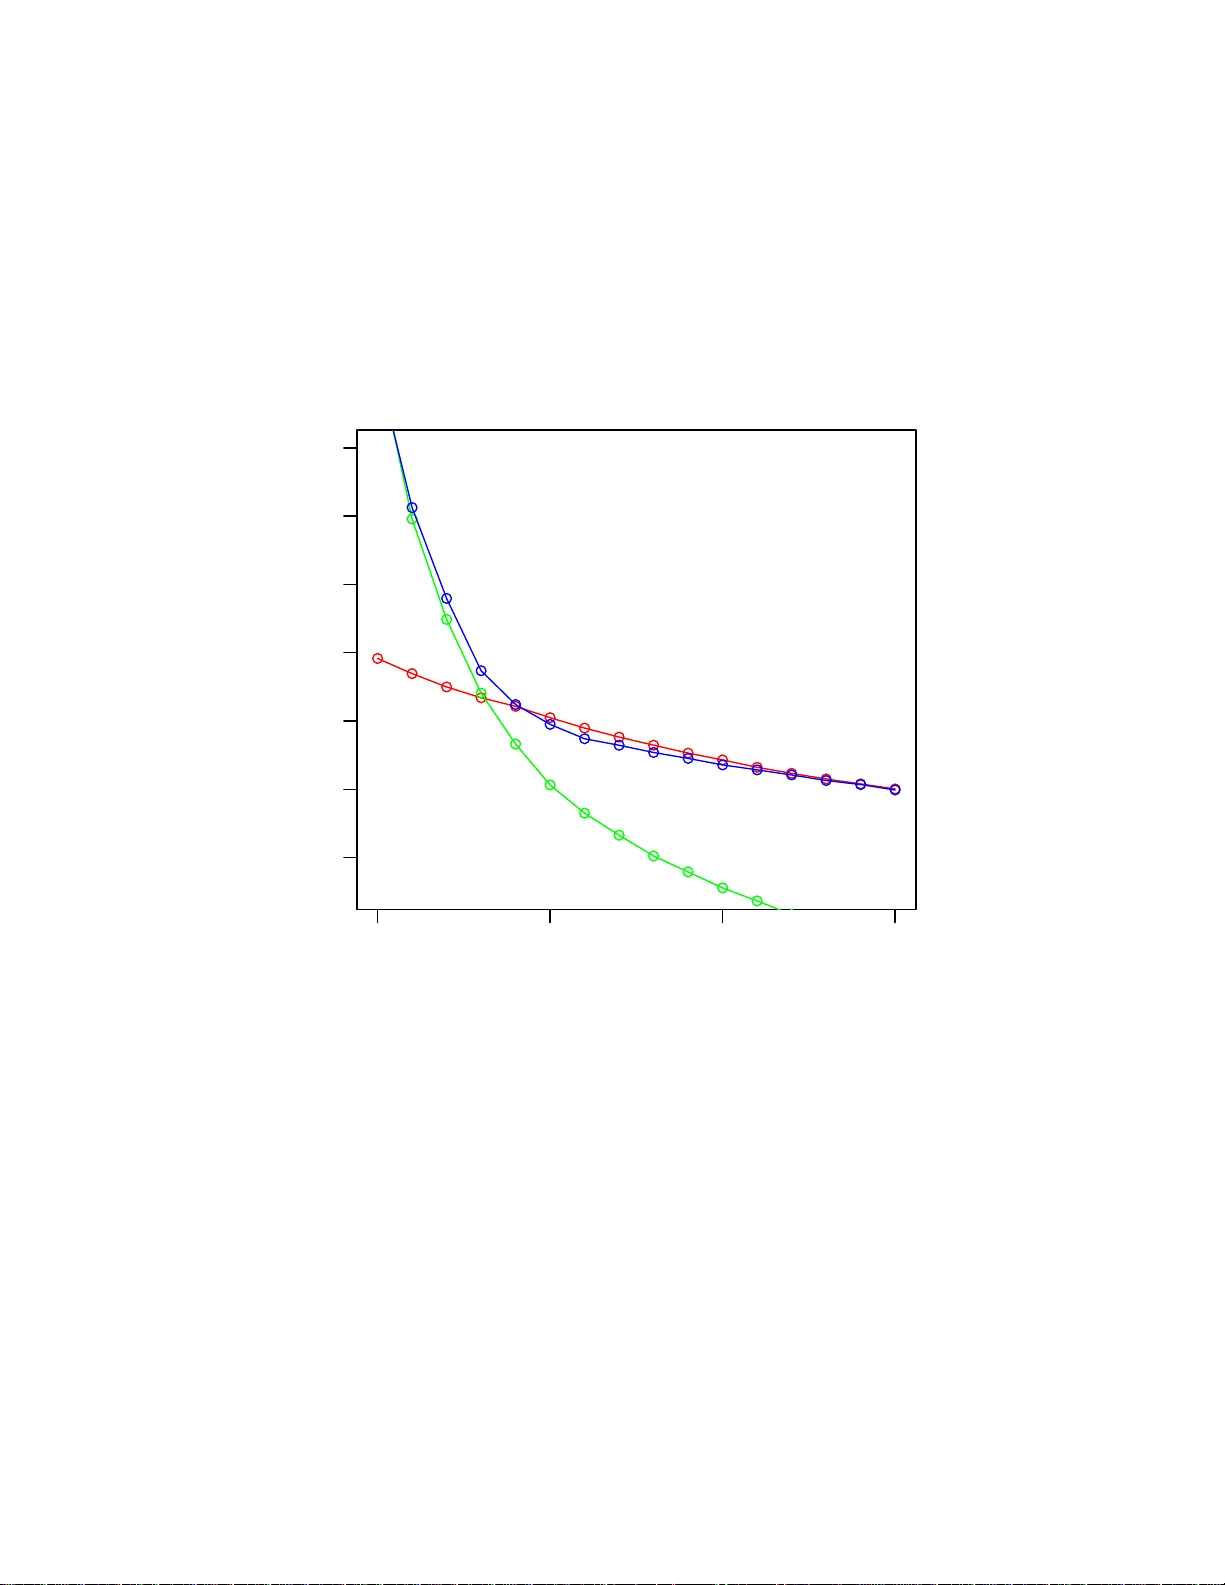
P opularit y , No v elt y and A tten tion F a ng W u and Ber nardo A. Hub erman HP Lab or ator ies P al o Alto, CA 9430 4 Octob er 29, 201 8 Abstract W e analyze the role that p opularit y and nov elt y p la y in attracting the atten tion of users to dyn amic websites. W e do so b y d etermin in g the p erformance of three differen t strategie s that can b e utilized to maximize atten tion. The fi rst one pr ioritizes n o v elty while th e sec- ond emp hasizes p opularity . A third strategy lo oks m yopicall y in to the fu tu re and prioritizes stories th at are exp ected to generate the most clic ks within the n ext few minutes. W e s ho w that the first t wo strategies should b e selected on the b asis of the rate of no v elt y d eca y , while the third strategy p erform s sub-optimally in most cases. W e also demonstrate that the relativ e p erforman ce of the firs t t wo strategies as a function of the rate of no velt y deca y c hanges abr uptly aroun d a critical v alue, resembling a p hase transition in th e physical world. 1 1 In tro ducti on As millions of p eople u se the web for their so cial, informational, and consumer needs, cont ent pro vid ers vie for their limited atten tion by resorting to a num b er of strategies aimed at maximizing the num b er of clic ks dev oted to their web sites [1]. These strategies range from data p ersonalization and short videos to the dynamic rearrangemen t of items in a give n page, to n ame a few [2, 3, 8 ]. I n all these cases th e ultimate goal is th e same: to draw the atten tion of the visitor to a w ebsite b efore she p ro ceeds to the next one [4]. Ob v ious ly , the more in teresting and relev an t the site the more v aluable it w ill b e to users. In addition, since users n eed to d ecide among the existing plethora of links and sites, their p opularities are a determinan t of their success, for p eople often clic k on giv en links for no other reason than the fact that many others do. If we add the f act that without n ov elt y attent ion tends to deca y in time, one has a first order list of the requirements for capturing p eople’s atte ntion. Within this con text, w e h av e recen tly sh o wn that there is a stron g in terplay b et we en no velt y and collectiv e atten tion, w hic h is un iv ersally manifested in a r ather swift initial gro wth of the num b er of p eople lo oking at a new it em within a sit e and its e ven tual slo wd o wn as in terest fades among th e p opulation [7]. This result su ggests that ordering the links of a giv en page by their n o ve lty can guarantee a high degree of atten tion. This is indeed the case in man y news w ebsites, notably digg. com . And y et, giv en the rol e that popu larit y pla ys i n attracting the atten tion of users, a natural question arises as to wh ether alte r nativ e orderings, like one giving priorit y to p opularit y o ver no ve lty , m igh t not do b etter at attracting viewers to a site. This pap er answe r s this question b y taking the dynamics of col- lectiv e atten tion to a finer lev el of d etail and examining the role that p opularity and no velt y play in determining the num b er of clic ks within a giv en p age. In particular, we study three different strateg ies that can b e d ep lo y ed in order to maximize atten tion. The fi rst strategy prioritizes no ve lty while the second emphasizes p opularit y . Th e third strategy looks m yopical ly into the fu ture and prioritizes stories that are exp ected to generate the m ost clic ks in the next few min utes. W e 2 sho w that the first t wo str ategies sh ould b e selected on the basis of the rate of no ve lty deca y , while the thir d strategy p erforms sub-optimally in m ost cases. Most interestingly , w e disco ver that the relativ e p erfor- mance of the fi rst t wo b enchmark strategi es as a fun ction of the rate of n o v elty d eca y switc hes so sharply around some critical v alue that it resem bles phase transitions observ ed in the real w orld. The w ork is organize d as follo ws. W e first study th e question of w hether or n ot the lo cation of a lin k in a page dete r mines the o v erall num b er of clic ks in a give n time in terv al. Ha ving answered this in the affirmative through an empirical study of digg.com , we then p ro ceed to introduce a set of indexes w hose v alues determine the optimal strategy to b e pursued in order to maximize atten tion to a page. Usin g m easured v alues of the rate of d eca y from digg.com w e bu ilt a realistic simulator to collect s tatistically significan t data to measure eac h of th e indices in tro duced. W e then stud y the p erf ormance of eac h of these ind ices as a fun c- tion of the deca y rate and sh o w which strategy optimizes viewing for giv en v alues of the deca y . Most imp ortan tly we compu te a full phase diagram that indicates at a gla n ce the optimal strategy to us e giv en the parameter v alues of the site. This phase d iagram exhibits a sharp b ound ary b et w een th e c hoice of prioritizing nov elty o ver p opu larit y , th us resembling a phase transition. Finally w e su mmarize our resu lts and d iscu ss th eir imp licatio n s f or the design of d y n amic websites. 2 Lo cation m atte rs In this section we study ho w the ord er in which links are placed within a webpage (e.g. the n ews stories of digg.com ) determines the n u mb er of clic ks within a certain time frame. Assume that time flows discretely as t = 0 , 1 , 2 . . . min utes. Let N t denote the num b er of clic ks, or digg numb er of a story in digg.co m , th at app eared on the we b site t minutes ago (in this case w e sa y that the story h as lifetime t ). As we sho wed earlier [7] the gro wth of N t satisfies the follo wing sto chastic equation: N t +1 = N t (1 + ar t X t ) , (1) 3 where r t is a novelty factor that deca ys with time and satisfies r 0 = 1, X t is a r andom v ariable with mean 1, and a is a p ositiv e constant. This equ ation tak es in to accoun t tw o imp ortant factors that to- gether determine the gro wth of collectiv e atten tion: p opularity and novelty . Th e p opu larit y effect is captured by the multiplica tive form of Eq. (1), and the n o v elty effect is describ ed b y r t . All other factors are contai n ed in the noise term X t . W e next take the analysis to a fin er lev el by co n sidering a third p osition factor . A news s tory display ed at a top p osition on the fron t page easily d ra ws more atten tion th an a similar story placed on later pages. Hence the growth deca y ar t should d ep end on the physical p osition at whic h the story is p osted. In the sp ecific case of digg. com , its fron t page is divided int o 15 slots, b eing able to display 15 stories at a time. The stories are alw a ys sorted c hronologically , w ith the latest story at the top. If w e lab el the p ositions from top to b ottom b y i = 1 , 2 , . . . , 15, w e can mo dify Eq. (1) to allo w for an explicit dep endency of a on i : N t +1 = N t (1 + a i r t X t ) , (2) where a i is a p osition factor that decreases w ith i . The assump tion that the n o ve lty effect and the p osition effect can b e separated into t w o factors r t and a i needs to b e tested empirically . T o this end we trac k ed the gro wth rate for eac h slot, rather than for eac h story . F or multiplica tive mo dels it is conv enient to define th e logarithmic gro wth rate s t = log N t +1 − log N t . (3) When a is small (wh ic h is alw ays true for short time p erio ds) we ha ve from Eq. (2) s i t ≈ a i r t X t (4) for a story placed at p osition i at time t . T aking exp ectation of b oth sides, w e ha ve E s i t ≈ a i r t , (5) since E X t = 1. The logarithmic gro wth r ate s i t can b e measured as follo ws. F or eac h fi xed p osition i , if a digg story app ears on that p osition at b oth 4 0 20 40 60 80 100 120 140 0.0 0.1 0.2 0.3 0.4 0.5 t s t 1 (a) 0 50 100 150 0.0 0.1 0.2 0.3 0.4 0.5 t s t 1 (b) Figure 1 – The logarithmic gro w th rate for the top tw o p ositions on the fron t p age of d igg.com . Time is m easured in min u tes. Data is collect ed ev ery 5 minutes, the rate at whic h th e fr ont p age is refr eshed. The solid curve in (a) is the r esult of a minimum mean square fi t to the data (see text for more details). It has the fu nctional form f ( t ) = 0 . 120 e − 0 . 4 t 0 . 4 . The curve in (b) has the functional f orm f ( t ) = 0 . 106 e − 0 . 4 t 0 . 4 . times t and t + 5 (the fr ont page is refr esh ed ev ery 5 minutes), th en the observ ed qu an tit y 1 5 (log N t +5 − log N t ) coun ts as one sample p oint of s i t . Fig. 1(a) plots 1,220 s amp le p oint s coll ected from the top p osition at v arious times. Fig. 1(b) is a similar p lot f or the second top p osition. By comparing (a) and (b) w e see that s 2 t indeed tends to f all b elo w s 1 t , whic h ind icates that the p osition effect is real. T o b etter illustrate the p osition effect, w e plot the exp ected gro w th rate for p osition 1, 3 and 5 in Fig. 2. As can b e seen th ere, the gro wth rate deca ys as the story mo v es to lo wer p ositions. F rom this data we can also d etermine the v alues of a i quan tita- tiv ely . W e already established that f or digg.com the precise functional form of the deca y factor is r t = e − 0 . 4 t 0 . 4 . Th us, for these particular 5 0 20 40 60 80 100 0.02 0.04 0.06 0.08 0.10 t Es t i=1 i=3 i=5 Figure 2 – The exp ected logarithmic growth rate for p osition 1, 3 and 5 on th e front page of digg.co m . T ime is measured in min utes. As can b e seen, the gro wth rate deca ys as the story mo ves to lo wer p ositions. v alues, the minim u m mean squ are estimat or ˆ a i minimizes min a i X j [ s i t j ( j ) − a i r t j ] 2 = min a i X j [ s i t j ( j ) − a i e − 0 . 4 t 0 . 4 j ] 2 , (6) where t j is the lifetime of the j ’th data p oint. The estimator for the 1,220 d ata p oin ts obtained from the top p osition is calculated to b e ˆ a 1 = 0 . 120. Th e fitted curve ˆ a 1 r t = 0 . 120 e − 0 . 4 t 0 . 4 j is sho wn as a solid curv e in Fig. 1(a). An estimator ˆ a 2 = 0 . 106 for the second top p osition is also calculated and plotted in Fig. 1(b). As can b e seen from those figures, the p osition effect ( a i ) and the no velt y effect ( r t ) can indeed b e separated. W e can then conclude that Eq. (2) fits the data v ery w ell. 6 3 Optimal ordering for maximal at- ten tio n W e no w consider th e ord er in w hic h n ews stories s hould b e displa yed on a web page so as to ge n erate the largest n um b er of clic ks within a certain time p erio d T . This time p erio d needs to b e fi nite b ecause the total num b er of clic ks div erges as T go es to in fi nit y . Equiv alently , in an infinite-horizon framewo r k, we could discount future clic ks with a d iscoun t parameter δ , so that one clic k at time t count s a s δ t clic k at time 0. The ob jectiv e then is to maximize P ∞ t =0 δ t N t , where N t is the total n umber of clic ks generated from the n ews page in p erio d t . In what follo ws we will consider the finite-horizon ob jectiv e. T o simplify th e problem w e confine ourselv es to a s u bset of ordering strategies called indexing str ate gies , which is defined as follo w s. Giv en a story’s state, w hic h in our mo del is just a t wo- vecto r ( N t , t ), one first calculate s an index O for eac h story using a predefined index func tion O ( N t , t ), and th en sorts the stories based on their indices. The story with the largest index is disp la y ed at the top, the story with the second largest index n ext, and so on [5, 6]. Rather than considering a general index f u nction w e w ill concen- trate on three simple s tr ategie s . While neither of them is p erfect, eac h can increase o v erall atten tion to the site. 1. O 1 ( t ) = − t . The stories are sorted by their no velt y , with the new est story at the top. This is what digg.com is d oing tod a y . 2. O 2 ( t ) = N t . The stories are sorted b y their p opu larit y , with the most p opular story at the top. This strateg y is b ased on the fact that atten tion grows in a m u ltiplicativ e fashion (p opular stories are more lik ely to b ecome ev en more p opu lar). 3. O 3 ( t ) = N t r t . Th is is the “one-step-greedy” strategy . Ignoring the p osition effect (assume a = 1), a story in state ( N t , t ) ge n - erates on a verag e N t r t more clic ks (or “diggs” if one considers digg.com ) in the next p erio d. This strategy thus places the m ost “replicated” story at the top. Notice that b ecause N t gro ws with time, the effect of sorting by O 1 is almost the opp osite of sorting according to O 2 . 7 In ord er to test these strategies, w e b uilt a simula tor that closely resem bles the f u nctioning of digg.co m in that it incorp orates the fol- lo wing rules: 1. Initially there are 15 stories, all in state ( N t , t ) = (1 , 0). In w ords , eac h story starts with 1 digg and lifetime 0. (Because our mo d el is pu rely multiplic ative , the initial digg num b er do es not matter. W e just set it to b e 1.) 2. Allocate the 15 stories to 15 p ositions, in d ecreasing order of their O ( N t , t ), for an y giv en in dex function O . 3. Time ev olv es on e s tep (5 min u tes) at a time. The n u mb er of diggs generated from a story at p osition i is giv en b y ∆ N t +5 = N t +5 − N t = 5 a i r t X t N t . (7) The total num b er of diggs generated in this time step is th e s um of 15 suc h n u m b ers. The v alues of a i w ere estimated from r eal data an d sh o wn in Fig. 3. r t = e − 0 . 4 t 0 . 4 . X t is rand omly d ra wn from a normal distribution with mean 1 and standard deviation 0.5 (obtained from the real data f rom digg.com ). 4. On a verage every 20 m in utes a new story arr iv es. Th us th e n u m b er of stories arriving in one time step (5 minutes) follo ws a P oisson distribution with m ean 0.2 5. When a n ew story enters the p o ol, the story w ith the lo west index is dropp ed, main taining 15 stories in total. (It is p ossible the a new story is d ropp ed immediately after its arr iv al if it happ ens to h a ve the low est index.) 5. Go back to Step 2 un til the loop h as b een rep eated for enough rounds. The p erf orm ance of all thr ee index fun ctions w ere tested in our sim- ulator. F or eac h ind ex f u nction, Steps 2 to 5 w ere rep eated 100,00 0 times (or equiv alen tly 500,000 minutes). Strategy O 1 (sort by nov- elt y) ac hiev ed a total n u m b er of 514 ,314.8 d iggs. Strategy O 2 (sort b y p opularity) only generated 354.6 diggs. Str ategy O 3 (one-step-greedy) generated 452,40 2.3 diggs. Thus for th ese parameter v alues O 1 turns 8 2 4 6 8 10 12 14 0.06 0.07 0.08 0.09 0.10 0.11 0.12 i a i Figure 3 – The p osition factor deca ys as th e p osition low er s . The v alues of a i are measured by trac king the 15 slots on digg.c om ’s front page. out to b e b est strategy , since it is 13 . 7% b etter than O 3 and tremen- dously b etter than O 2 . T his confirms that digg.com is u sing the r igh t strategy . The r eason for the p o or p er f ormance of the in dex O 2 is easy to understand . O 2 giv es higher priorit y to stories that ha ve b een dugg man y times. According to the ind exing ru le, after one p erio d new stories can n ev er find their w ay to the front page since all the old stories ha ve more than 1 digg! When nov elty deca ys fast, the old stories r emaining on the fron t page s o on lose their freshness and cease to generate any n ew diggs. Th e system thus gets frozen in an unf r uitful state. The fact th at O 1 outp erforms O 3 is a b it harder to understand. Some int u ition can b e gained by considerin g an extreme case. Sup p ose eac h story completely loses its no v elty after one second ( r 0 = 1, r t = 0 for all t > 0). Then only “new arriv als” should b e disp la y ed since they are the only on es that can generate n ew diggs. S orting stories b y their lifetime is a goo d idea when no velt y deca ys fast. On the other hand, if 9 no vel ty nev er deca ys ( r t ≡ 1), the lifetime fac tor b ecomes ir relev ant . Th u s in this case, strateg y O 3 , which prioritizes pop u lar stories, will win ov er O 1 . Hence, the fact that O 1 w orks b etter than O 3 in our sim ulations sh ows that no vel ty deca ys relativ ely fast for dig g.com . Should it deca y at a slo wer rate, O 3 w ould b e a b etter c h oice. W e p oint out that our simulat ion only sho we d that the ordering implied by O 1 w orks b etter than O 3 for a p articular choi ce of T . In general this ma y n ot b e tru e for other v alues of T . In fact, for a time in terv al of T = 5 min utes (one time step) O 3 is b y definition the b est strategy . Hence, comparin g the p erformance of t wo or m ore index functions only mak es sens e after one has sp ecified a time horizon (or ho w muc h the future should b e discount ed if an in finite horizon is assumed). In order to quan titativ ely test the limiting b eha vior of the three strategies, w e rep eated our simulatio n s for a range of different v alues of the deca y parameter r t . O ur previous w ork suggested that r t deca ys as a stretc hed exp onen tial function, whose general form can b e written as r t = e − αt β . F or digg.com it turns out α = β = 0 . 4. The p arameter β determines the deca y rate. F or fixed α , the larger β , the faster r t deca ys. W e rep eated our exp erimen t for α = 0 . 4 and β ∈ [0 . 30 , 0 . 45]. The result is shown in Fig. 4. The p erf ormance of eac h indexing strategy is measured b y the logarithm of the total num b er of d iggs generated in 10,000 roun ds. W e see that as β increases (faster deca y), the num b er of diggs decreases f or all three indexing strategies. When β > 0 . 34 , O 1 p erforms slight ly b etter than O 3 and muc h b etter than O 2 . When β < 0 . 33, ho we ver, O 3 and O 2 p erform significan tly b etter than O 1 . In other w ord s, on the t wo sides of the v alue of β = 0 . 335, the stories should b e display ed in completely rev ersed order! W e therefore sa y that a phas e tr ansition tak es place at the v alue of β = 0 . 33 5. Other p oin ts w orth mentio n ing are that in Fig. 4 O 3 asymptotically approac hes O 1 and O 2 b oth in the fast and slo w d eca y limits, and that in general O 3 is the b est index among the three s tr ategie s (although for the sp ecific parameters of digg.c om ( α = β = 0 . 4) and our particular time horizon O 1 is slight ly b etter). T his is b ecause O 3 trades off b et ween p opularity and nov elt y in s tead of b etting on only one factor. 10 T o see this, consider th e equiv alen t index function O ′ 3 ( N t , t ) = log O 3 ( N t , t ) = log N t + log r t . (8) Clearly , O ′ 3 linearly trades off b et wee n log N t and log r t , assigning iden tical w eight to the t wo effects. Th is is b y no means the b est tradeoff. F or example, the index function O 4 ( N t , t ) = 0 . 6 log N t + log r t (9) ac hiev es 556,444 .1 diggs after 100,000 rounds of sim ulation, whic h is 8.2% more than O 1 and 23.0% more than O 3 ! How ever arbitrary it ma y s eem to giv e the term log N t w eight 0.6 rather than 1 is b ey ond the scop e of this pap er, bu t it do es show the complexit y of our p roblem. These exp erimen ts demons trate that the no velt y deca y r ate n eeds to b e measured with great care, as a sligh t c h ange in the deca y rate may totally rev erse the optimal order needed to m aximize atten tion. It is usually hard to analytically compu te the p erformance of a general index f u nction. F or the tw o simple s trategies O 1 and O 2 , how- ev er, some rough estimate can b e ac h iev ed. F or the sak e of generalit y , assume that there are m p ositions on the fron t p age. New stories ar- riv e at a r ate λ > 0. No ve lty deca ys as r t = e − αt β , w here 0 < β ≤ 1. Let ¯ a = 1 m P a i b e th e av erage p osition f actor, whic h equals 0.08 for digg.com . Let ∆ t b e the r efresh time step, which is 5 minutes for digg.com . Consider strategy O 2 first. According to the in dex rule, new stories nev er app ear on the fron t page. All diggs are generated b y the initial m stories. After time T we hav e from Eq. (3) that log N T = X t =0 , ∆ t,...,T − ∆ t a i r t X t ∆ t. (10) Hence on av erage eac h s tory’s log-p erf ormance is E log N T = X t =0 , ∆ t,...,T − ∆ t ¯ ar t ∆ t ≈ ¯ a Z T 0 r t dt. (11) When T is large, w e ha ve E log N T ≈ E log N ∞ = ¯ a Z ∞ 0 r t dt. (12) 11 0.30 0.35 0.40 0.45 8 10 12 14 16 18 20 β log(total digg) O 1 O 2 O 3 Figure 4 – T he total num b er of d iggs generated using th ree ordering strategies O 1 , O 2 , and O 3 , for α = 0 . 4 and a range of β . The nov elt y factor deca ys as r t = e − αt β . Pe r formance is measur ed by the logarithm of the total n umb er of diggs generated in 10,000 time steps. As can b e seen, O 3 asymptotically approac h es O 1 and O 2 in the fast deca y (large β ) and slo w deca y (small β ) limit, resp ectiv ely . A p hase transition happ ens around β = 0 . 33 5. 12 Next consider O 1 , which ord ers the sto r ies b y their lifetime. On a v erage every s ≡ 1 /λ min utes a new story replaces an old story , and eac h old story mo v es do wn one p osition. Hence on a verage eac h story sta ys on the front p age for ms minutes, wh ere m is the num b er of p ositions. W e call ms one p age cycle . It is the av erage time it tak es to refresh the whole page. W e no w see th at, b efore a story disapp ears from the f ron t page, it generates N ms = exp X t =0 , ∆ t,...,ms − ∆ t a i ( t ) r t X t ∆ t (13) diggs, w here i ( t ) is the story’s p osition at time t . When an story get s replaced by a n ew story , they are coun ted as one story r estarting fr om the state N t = 1 and t = 0. The multiplica tive pro cess starts o ver, and another N ms diggs are generated in the next ms minutes, on av erage. Th u s, in a total time p erio d T the pro cess is rep eated T / ( ms ) times, and a total num b er of N ms T / ( ms ) diggs are generated p er story . The log-p erformance of O 1 is appro ximately log N ms + log T ms = X t =0 , ∆ t,...,ms − ∆ t ¯ ar t X t ∆ t + log T ms , (14) where we replaced a i ( t ) by ¯ a s in ce on av erage eac h s tory s ta ys in p osition 1 , . . . , m for equal times. T aking exp ectation on b oth sides, w e ha ve E log N ms + log T ms ≈ ¯ a Z ms 0 r t dt + log T ms . (15) The critical p oin t can b e determined b y equating Eq. (12) and (15): E log N T − E log N ms = log T − log ( ms ) , (16) or ¯ a Z ∞ ms r t dt = log T ms , (17) whic h holds for any functional form of r t . T he left sid e of Eq. (16) can b e int erp reted as the total nov elty left after a time ms , or th e total log- p erformance that can b e gained from one story after one page cycle. The right h and side of Eq. (16) is the total log-time left after on e page 13 cycle. Thus, Eq. (16) and (17) sa y that, after one page cycle, if there is more no velt y left th an the log-time remained, the stories should b e ordered b y decreasing p opularity rather than b y d ecreasing no v elty ( O 2 is b etter than O 1 ). Conv er s ely , if no velt y deca ys to o f ast (not enough no velt y left after one page cycle ), then the stories should b e ordered by decreasing n o v elty rather than decreasing p opularit y ( O 1 is b etter than O 2 ). When r t = e − αt β it holds that Z ∞ ms r t dt = α − 1 β β Γ 1 β , α ( ms ) β , (18) where Γ( a, x ) = Z ∞ x t a − 1 e − t dt (19 ) is the i nc omplete Gamm a func tion . In this case the critical equation can also b e written as ¯ a α − 1 β β Γ 1 β , α ( ms ) β = log T ms . (20) F or the p arameters of digg .com (¯ a = 0 . 08, m = 15, s = 20) and horizon T = 50 , 000 one can solv e for the critical cur v e ( α, β ) on whic h O 1 and O 2 ha ve th e same p erformance. The curve is sho w n in Fig. 5 as a phase diagram. When the parameters ( α, β ) lie ab o ve the critical curve, the stories shou ld b e sorted by O 1 . Otherwise they should b e sorted by O 2 . T o illustr ate ho w sharp the ph ase transition is, w e plot the r elativ e p erformance O 2 / ( O 1 + O 2 ) as a fun ction of β , for fi xed α = . 4, in Fig. 6. As can b e seen, the trans ition is indeed v ery sharp. 4 Conclus ion In this pap er w e ha v e sho wn that dep en ding on the rate of deca y of no vel ty , t wo differen t strategies can b e deplo yed in order to maximize atten tion. The first one prioritizes no v elt y while the seco n d empha- sizes p opu larit y . Most in terestingly , th e shift from one to the other as a fun ction of the rate of deca y is extremely sharp, resem blin g the phase transitions ob s erv ed in the physical world. 14 0.3 0.4 0.5 0.6 0.7 0.20 0.25 0.30 0.35 0.40 α β O 1 O 2 Figure 5 – The phase diagram. The critical cu rv e is calculated by solving Eq. (20) with ¯ a = 0 . 08, m = 15, s = 20 and T = 50 , 000. When ( α, β ) lies in th e upp er half of the phase d iagram O 1 w orks b etter than O 2 . Otherw ise O 2 w orks b etter. 0.25 0.3 0.35 0.4 0.45 0.5 Β 0.2 0.4 0.6 0.8 1 O 2 O 1 + O 2 Figure 6 – The relativ e p erformance O 2 / ( O 1 + O 2 ) as a fun ction of β , for fixed α = . 4. 15 These results were obta in ed by focus in g on the dynamics of col- lectiv e atten tion and examining the role that p opularit y and no velt y pla y in d etermining the num b er of clic ks w ithin a giv en page. In par- ticular, we analyzed thr ee different strategie s that can b e deploy ed in order to maximize atten tion. Th e firs t strategy prioritizes no vel ty while the s econd emph asizes p opularit y . The third strategy lo oks my- opically into the future and p rioritizes stories that are exp ected to generate th e most clic ks in the next f ew minutes. W e then sh o we d that th e first t w o strategi es should b e selected on the basis of the rate of no v elt y deca y , while the third strategy p er f orms sub-optimally in most cases. Most in terestingly , we discov ered that the relativ e p erfor- mance of the fi rst t wo b enchmark strategi es as a fun ction of the rate of n o v elty d eca y switc hes so sharply around some critical v alue that it resem bles phase transitions observ ed in the real w orld. Giv en the imp ortance of m aximizing page views for m ost con tent pro vid er s , this w ork suggests a prin cipled w ay of choosing wh at to prioritize when d esignin g dynamic w eb s ites. Kno wledge of th e rates with whic h nov elt y and p opularit y ev olve within the w eb s ite can then b e translated into decisions as to wh at to show first, second, etc. References [1] Josef F alkinger. Att ention economies. Journal of Ec onomic The- ory , v ol. 133, pp . 266–294 , 200 7. [2] J. Garofalakis, P . Kapp os and D. Mourlouk os. W eb site optimiza- tion u s ing page p opularit y . IE EE Internet Com puting , volume 3, issue 4, pp. 22– 29, 1999. [3] W eiyin Hong, James Y. L. Thong and Kar Y an T am. Does anima- tion attract online u sers attent ion? The effects of Flash on infor- mation search p erformance and p erceptions. Information Systems R ese ar ch , v ol. 15, no. 1, pp. 60–8 6, 2004. [4] Bernardo A. Hu b erman, Peter L . T. Pirolli, James E. Pitk o w , and Ra jan M. Luk ose. S trong regularities in W orld Wide W eb surfing. Scienc e , vol. 280, no. 5360, pp. 95–97 , 1998. 16 [5] Jos ´ e Ni ˜ no-Mora. S to chastic scheduling. E ncyclop e dia of O ptimiza- tion , C. A. Floudas and P . M. P ardalos, eds., v ol. V, pp . 367–372, 2001. [6] F ang W u and Bernardo A. Hub erman. Th e economics of attent ion: Maximizing user v alue in information-ric h environmen ts. The First International Workshop on Data Mining and Audienc e Intel ligenc e for A dvertising (A DKDD’07) , 200 7. [7] F ang W u and Bernardo A. Hu b erman. No v elty and collectiv e at- ten tion. Pr o c e e dings of National A c ademy of Scienc es , vo l. 104, no. 45, pp. 175 99–17601, 2007. [8] Ping Zhang. The effects of animation on information seeking p er- formance on the W orld Wide W eb: S ecur ing atten tion or int erf er- ing w ith primary tasks? Journal of the A IS , volume 1, issue 1, 2000. 17
Original Paper
Loading high-quality paper...
Comments & Academic Discussion
Loading comments...
Leave a Comment